
Gold Refuses to Break — But Can the $4,100 Base Survive 5% Yield
Gold is doing something it shouldn't be doing. With the 10-year Treasury yield at 5.10%, the dollar above 101, and the Fed having just hiked for the first time since 2023, spot gold should be crumbling. Instead, it's holding $4,100 — and that resilience is the real story.
📊 Why This Matters Right Now
The September CPI print landed on October 14 at 3.7% YoY — hotter than expected, with gasoline surging 9.1% on the back of Strait of Hormuz tensions. Core CPI ticked up to 2.6%. That data pushed December FOMC hike odds to roughly 83% on Kalshi, and the October 27–28 meeting is now a live coin flip at ~54% hike probability. Add the 30-year yield at a multi-decade high of 5.63%, and the macro backdrop for non-yielding gold couldn't look much worse. Yet here we are, sitting inside the $4,107 - $4,153 demand zone — the level that decides whether the broader uptrend from 2025 survives into Q4.
🎯 The Range Structure
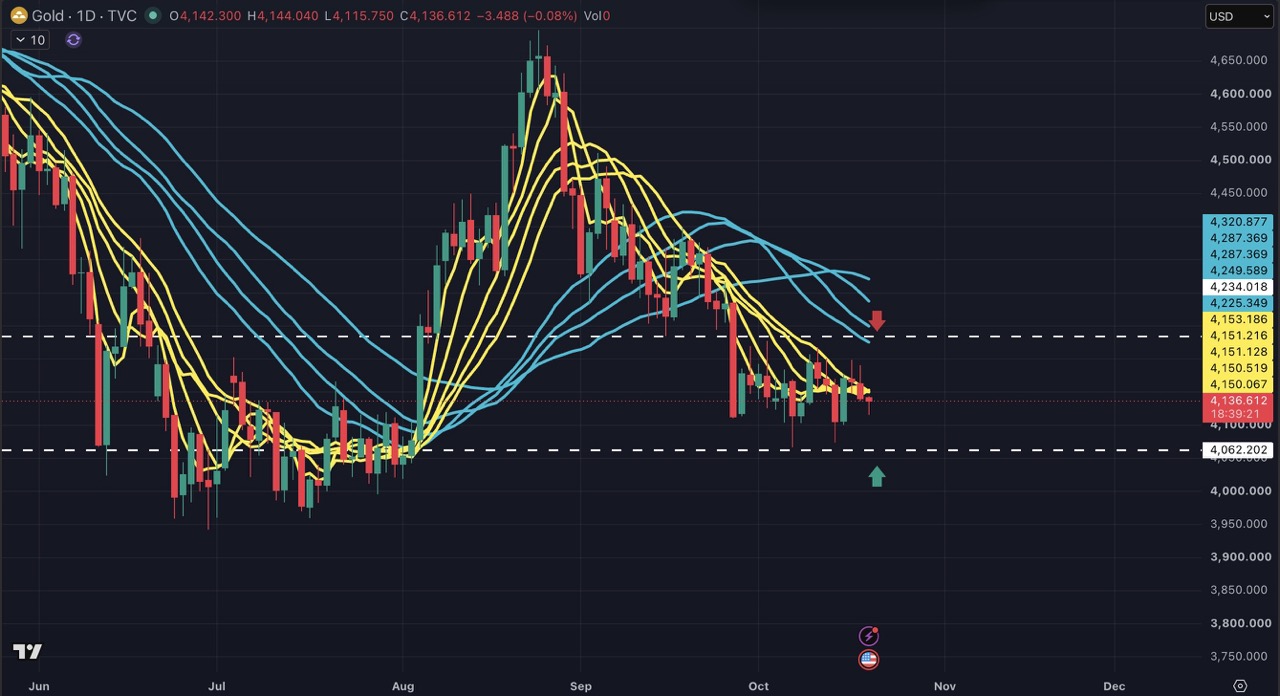
On the daily chart, gold is trading below a converging cluster of short- and medium-term moving averages stacked between $4,150 and $4,235. This layered resistance has rejected every rally attempt since the August pullback from $4,700.
My read: as long as price stays below that MA cluster, upside is capped and rallies will attract sellers.
But the downside tells a different story. The $4,060 - $4,100 region has absorbed multiple tests and continues to hold. This isn't a market in freefall — it's a market building a range.
Key levels I'm watching:
-
Immediate resistance: $4,150 - $4160
-
Major resistance: $4,225 - $4,235 (MA cluster ceiling)
-
Higher resistance: $4,285 - $4,320
-
Immediate support: $4,100 (psychological + demand zone)
-
Range floor: $4,060
⚠️ Risk View — What Breaks the Range
The range thesis dies in two scenarios. A decisive daily close above $4,235 would neutralize the bearish MA structure and reopen upside toward $4,285 - $4,320. Conversely, a sustained break below $4,060 would confirm sellers have regained control and could open the door to the $4,000 area.
The wildcard is the October FOMC on the 27th–28th. A second consecutive hike would strengthen the bearish macro case; a hold with dovish guidance could be the catalyst that flips the range upward. Either way, that meeting is the most likely trigger to resolve this consolidation.
💡 Bottom Line
Gold is caught between a bearish macro wall and a technical floor that refuses to crack. The trade isn't directional — it's boundary-dependent. Sell into the $4,150 - $4,235 resistance cluster. Look for buying signals near $4,060 - $4,100. And above all, respect the October 27–28 FOMC as the event that likely breaks this range one way or the other.
All trading education provided by Bitget is for educational purposes only and should not be considered financial advice. The strategies and examples shared are for reference only and may not reflect actual market conditions. CFD trading involves significant risk, including the potential loss of capital. Past performance does not guarantee future results. Please conduct thorough research and ensure that you understand the risks involved. Bitget is not responsible for any trading decisions made by users.


- 📊 Why This Matters Right Now
- 🎯 The Range Structure
- ⚠️ Risk View — What Breaks the Range
- 💡 Bottom Line