ExxonMobil Holdings Corporation stock closes at $163.54 as hourly momentum stalls
ExxonMobil Holdings Corporation stock closed at $163.54 on September 18, with the daily chart still favoring bulls. The session opened soft at $162.50 before firming, gaining 0.64% intraday. The broader uptrend remains structurally intact, though shorter-term momentum is starting to show hesitation.
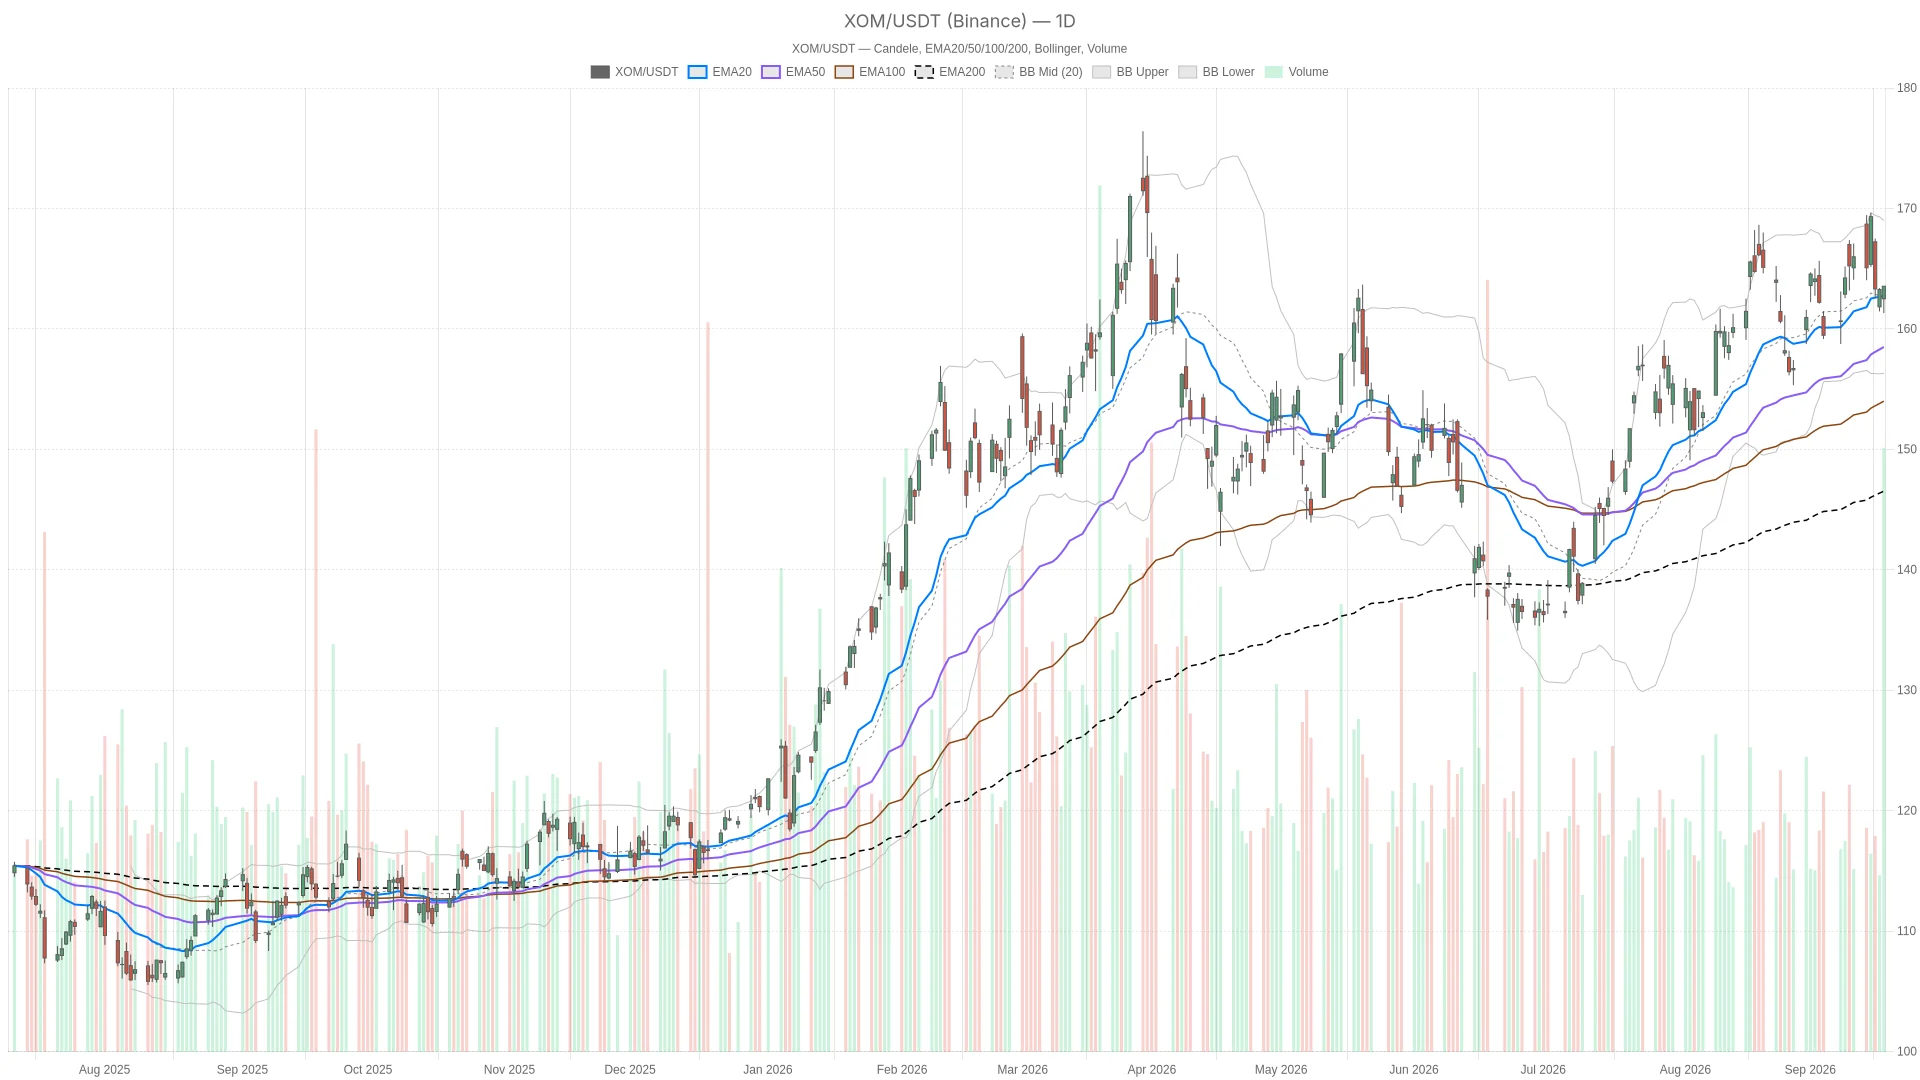 XOM — daily chart with candlesticks, EMA20/EMA50 and volume.
 Summary
- Key takeaways
- Daily Trend Still Favors ExxonMobil Holdings Corporation Stock Bulls
- Hourly Momentum Cools for ExxonMobil Holdings Corporation Stock
- 15-Minute Chart Defines Key XOM Execution Levels
- News Backdrop: Dividends, Buybacks, and Refinery Risks
- Bullish Scenario for ExxonMobil Holdings Corporation Stock
- Bearish Scenario: When the Hourly Inversion Deepens
- Closing Take on ExxonMobil Holdings Corporation Stock
- FAQ
Key takeaways
- ExxonMobil Holdings Corporation stock closed at $163.54, up 0.17% close-to-close on September 18.
- The daily trend is flagged as bullish, with price above the 20-, 50-, and 200-day EMAs stacked in classic bullish order.
- Daily RSI14 at 53.59 remains neutral-to-firm, while the MACD histogram is slightly negative at -0.27, signaling soft momentum divergence.
- Hourly momentum has cooled, with RSI14 at 46.86 and the 20-hour EMA slipping below the 50-hour EMA.
- Key resistance sits at 164.28 (daily R1), while support is clustered around the 161.87–162.05 zone.
Daily Trend Still Favors ExxonMobil Holdings Corporation Stock Bulls
The daily trend remains structurally bullish for ExxonMobil Holdings Corporation stock. Price trades above all three key moving averages, arranged in the classic bullish order.
Meanwhile, the 20-day EMA sits at 162.74, the 50-day at 158.50, and the 200-day at 146.53. This configuration reflects a sustained uptrend, not a short-lived bounce. Price trading comfortably above the 200-day EMA by a wide margin reinforces the structural case for bulls.
Momentum Shows Subtle Divergence
RSI14 on the daily chart reads 53.59, a neutral-to-firm reading comfortably above the 50 midline. This indicates the rally has room to extend without entering overbought territory. However, the MACD presents a more nuanced picture: the line sits at 1.93, well above zero, but the histogram is negative at -0.27. In this configuration, the signal line has crept above the MACD line, creating a soft momentum warning inside an otherwise bullish setup.
Bollinger Bands show the mid-band at 162.66, with the upper band at 169.00 and the lower band at 156.31. Price is essentially riding the midline. This leaves both an upside path toward 169 and a downside cushion toward 156 open. ATR14 stands at 3.89, a healthy volatility reading. Notably, the daily pivot sits at 162.80, resistance at 164.28, and support at 162.05. Price parked on top of the pivot suggests the market is still deciding its next move.
Hourly Momentum Cools for ExxonMobil Holdings Corporation Stock
The hourly chart paints a different picture. The regime is neutral, not bullish, with short-term momentum fading. The 20-hour EMA at 163.43 has slipped below the 50-hour EMA at 163.96, a short-term inversion pointing to softer buying pressure.
At the same time, price remains above the 200-hour EMA at 161.80. The broader hourly trend is therefore intact, even as near-term softness layers on top. RSI14 on the hourly chart reads 46.86, just under the 50 line. This is a subtle but meaningful shift from the firmer daily reading.
Meanwhile, MACD confirms the hesitation: the line sits at -0.68 against a signal of -0.72, with the histogram barely positive at 0.03. Hourly momentum is essentially flat, hovering near the zero-cross rather than pushing in either direction.
Bollinger Bands on the hourly chart show the mid-band at 163.08, upper at 164.77, and lower at 161.38. ATR14 has compressed to 0.88, notably tighter than the daily reading. This compression is typical during consolidation phases. The hourly pivot sits at 162.62, with resistance at 163.93 and support at 161.87. Overall, the daily trend still points higher. Still, the hourly chart signals the move needs to pause and digest before extending further.
15-Minute Chart Defines Key XOM Execution Levels
On the 15-minute chart, RSI14 reads 56.92, slightly firmer than the hourly reading. This suggests short-term buyers remain active at the margin. However, MACD tells a different story. The MACD line and signal are essentially glued together at -0.09, with a flat histogram of 0.00. That is about as neutral as momentum gets.
Notably, the 200-period EMA on this timeframe sits at 164.06, just above the last close of 163.19. It acts as a near-term ceiling for intraday moves. Bollinger Bands are tight, with the mid-band at 162.73, upper at 163.34, and lower at 162.12. ATR14 has dropped to 0.44, a compression level that typically precedes a directional push once price clears either band.
For execution, the confluence of the 15-minute and hourly resistance in the $163.93–164.28 zone is the level bulls need to clear. Meanwhile, the 161.87–162.05 area lines up as the first support if the pullback deepens.
News Backdrop: Dividends, Buybacks, and Refinery Risks
Beyond the charts, the news flow around ExxonMobil Holdings Corporation stock has been steady rather than dramatic. A Motley Fool piece ranked ExxonMobil among the safest dividend stocks in the energy sector, alongside Enterprise Products Partners and Brookfield Renewable.
Separately, a Yahoo Finance comparison between Chevron and Exxon noted that both companies raised their dividends again this year. Both carry decades-long growth streaks, framing the debate around which balance sheet can better withstand a crude price downturn.
On the operational side, a report described an Exxon Midwest refinery going dark after a flooded pump. The facility can process 11 million gallons. Questions linger about how far regional gas prices from Chicago to Pittsburgh could rise while the unit stays offline.
Another Motley Fool comparison weighed ExxonMobil’s buyback program against ConocoPhillips. The discussion centered on relative size as the key factor in which repurchase program moves results. On the sustainability front, Exxon’s annual Energy Outlook raised its 2050 global emissions forecast. The report warned that continued coal use will likely push emissions past climate targets. None of these headlines directly explain the day’s price action, but they shape the broader narrative around the name.
Bullish Scenario for ExxonMobil Holdings Corporation Stock
The bullish case rests on the daily structure holding. If price clears the daily R1 at 164.28 and pushes toward the upper Bollinger Band at 169.00, the uptrend would be confirmed as resuming rather than stalling.
Meanwhile, a recovery in the hourly MACD back above the signal line would provide momentum confirmation. RSI14 reclaiming the 50 level on both the hourly and 15-minute charts would reinforce the signal. Given the EMA alignment already in place on the daily chart, a fresh leg higher would not require a major structural shift. It would simply need a resumption of the buying that has driven the stock above its 200-day average by a wide margin.
Bearish Scenario: When the Hourly Inversion Deepens
The bearish risk starts with the hourly EMA inversion. If the 20-hour EMA continues to slip further below the 50-hour EMA, and price loses the daily S1 at 162.05, the door opens toward the daily EMA50 near 158.50 as the next reference point.
Meanwhile, a daily MACD histogram that stays negative and widens, rather than recovering, would reinforce the concern. It would suggest the fading momentum is becoming more than a minor wobble. Losing the 161.87–162.05 support band on both the hourly and daily charts would be the clearest signal that the bullish thesis needs reassessing.
Closing Take on ExxonMobil Holdings Corporation Stock
The picture for ExxonMobil Holdings Corporation stock is one of a daily uptrend that remains structurally intact. Yet hourly and 15-minute momentum show enough hesitation to warrant caution around current levels.
FAQ
What is the overall trend for ExxonMobil Holdings Corporation stock?
The daily trend is flagged as outright bullish. Price trades above the 20-day EMA at 162.74, the 50-day at 158.50, and the 200-day at 146.53, with all three moving averages stacked in classic bullish order.
Is hourly momentum weakening on XOM?
Yes, hourly momentum has cooled. RSI14 on the hourly chart reads 46.86, below the 50 midline. The 20-hour EMA has slipped below the 50-hour EMA, and the MACD is essentially flat near the zero-cross.
What are the key resistance levels to watch?
The main resistance zone sits at 163.93–164.28, representing the confluence of hourly resistance and the daily R1 pivot. Beyond that, the daily upper Bollinger Band at 169.00 marks the next upside target.
Where does support sit if ExxonMobil Holdings Corporation stock pulls back?
Immediate support lies in the 161.87–162.05 zone. A break below this area would open the path toward the daily EMA50 near 158.50.
{"@context":"https://schema.org","@type":"FAQPage","mainEntity":[{"@type":"Question","name":"What is the overall trend for ExxonMobil Holdings Corporation stock?","acceptedAnswer":{"@type":"Answer","text":"The daily trend is flagged as outright bullish. Price trades above the 20-day EMA at 162.74, the 50-day at 158.50, and the 200-day at 146.53, with all three moving averages stacked in classic bullish order."}},{"@type":"Question","name":"Is hourly momentum weakening on XOM?","acceptedAnswer":{"@type":"Answer","text":"Yes, hourly momentum has cooled. RSI14 on the hourly chart reads 46.86, below the 50 midline. The 20-hour EMA has slipped below the 50-hour EMA, and the MACD is essentially flat near the zero-cross."}},{"@type":"Question","name":"What are the key resistance levels to watch?","acceptedAnswer":{"@type":"Answer","text":"The main resistance zone sits at 163.93–164.28, representing the confluence of hourly resistance and the daily R1 pivot. Beyond that, the daily upper Bollinger Band at 169.00 marks the next upside target."}},{"@type":"Question","name":"Where does support sit if ExxonMobil Holdings Corporation stock pulls back?","acceptedAnswer":{"@type":"Answer","text":"Immediate support lies in the 161.87–162.05 zone. A break below this area would open the path toward the daily EMA50 near 158.50."}}]}
Article produced with the assistance of artificial intelligence and reviewed by the editorial team.





