


Dogecoin is moving deeper into a long term compression zone, with both price and market cap charts showing pressure near key resistance. $DOGE still needs a confirmed breakout, but the narrowing structure shows that the next major move may be getting closer.
Dogecoin Price Chart Shows Large Pennant as $DOGE Compresses
Dogecoin is moving inside a large long term pennant structure after its major impulse move, according to a chart shared by Bitcoinsensus on X.
The chart shows $DOGE forming lower highs and higher lows inside a narrowing triangle. This type of setup usually shows compression, where price moves into a smaller range before a larger move develops.
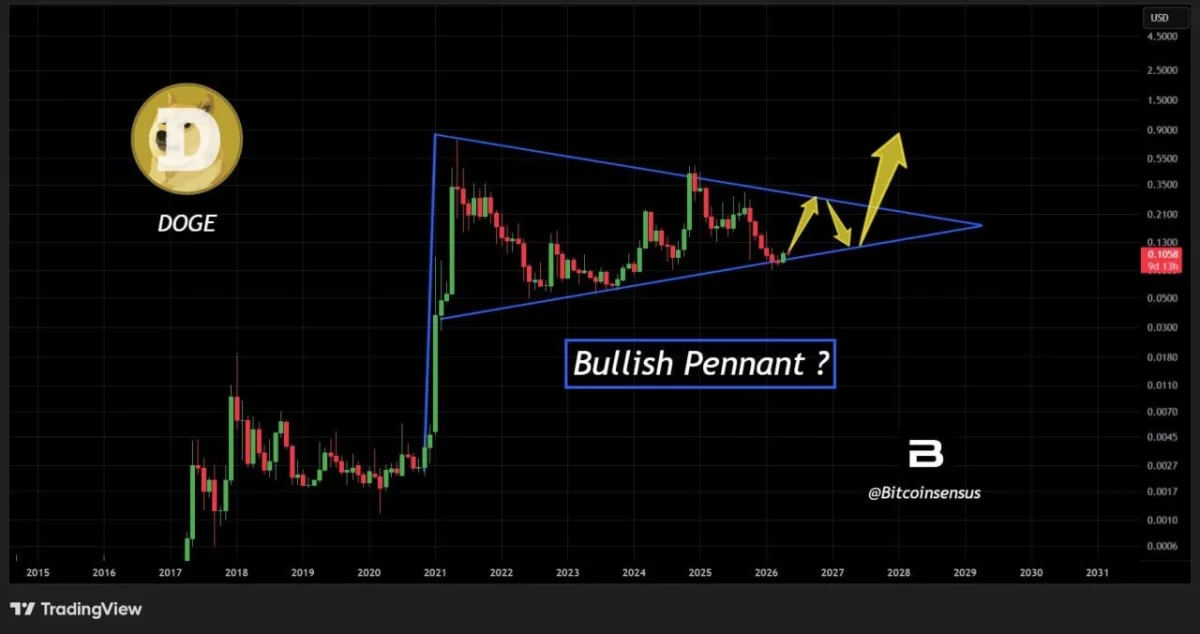
$DOGE Long Term Chart. Source: Bitcoinsensus on X
The upper blue trendline has acted as resistance since the post rally peak. Each rejection from that line has kept $DOGE inside the structure. A clean move above that trendline would be the first sign that buyers are trying to regain control.
The lower blue trendline remains the key support area. $DOGE has held that rising support several times since the 2022 low. If price loses that line, the pennant structure would weaken and the bullish setup would become less reliable.
The chart also marks a possible path where $DOGE breaks higher after one more pullback inside the pattern. However, the breakout still needs confirmation. Without a strong candle above resistance, $DOGE may continue moving inside the narrowing range.
For now, the main signal is compression. $DOGE has not confirmed a breakout yet, but the long term chart shows price approaching the point where the pennant structure may decide the next larger move.
Dogecoin Market Cap Chart Shows Breakout Pressure Near Apex
Dogecoin market cap is compressing near the end of a long term triangle structure, according to a chart shared by DonWedge on X.
The chart shows $DOGE market cap moving under a descending resistance line that started after the 2021 peak. At the same time, a rising support line has held the lower side of the structure for several years.
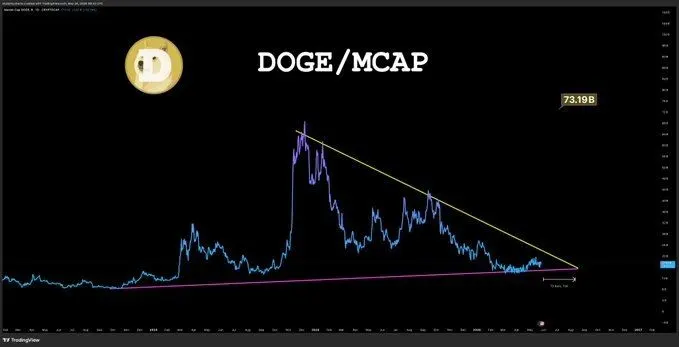
$DOGE Market Cap Chart. Source: DonWedge on X
This setup shows a tightening range. $DOGE has not confirmed a breakout yet, but the chart suggests that pressure is building as price action moves closer to the triangle apex.
A clean move above the yellow resistance line would be the first stronger bullish signal. The chart marks a possible upside target near $73.19 billion in market cap if buyers push $DOGE out of the structure.
However, $DOGE still needs confirmation. Without a breakout above resistance, the market cap could continue moving sideways near the apex or retest the rising support line.
The key risk sits at the lower purple trendline. If $DOGE loses that support, the long term compression setup would weaken and the bullish breakout case would lose strength.
For now, the chart shows $DOGE holding inside a major multi year structure. The next larger move depends on whether buyers can break the descending resistance line with follow through.


