
Netflix, Inc. stock falls to $75.31 amid bearish technical breakdown

Netflix, Inc. stock closed at $75.31 on September 17, down 1.44% from the prior close of $76.41. Price has broken below every major moving average on the daily chart. The technical picture now leans firmly bearish, though short-term oversold readings complicate the near-term path.
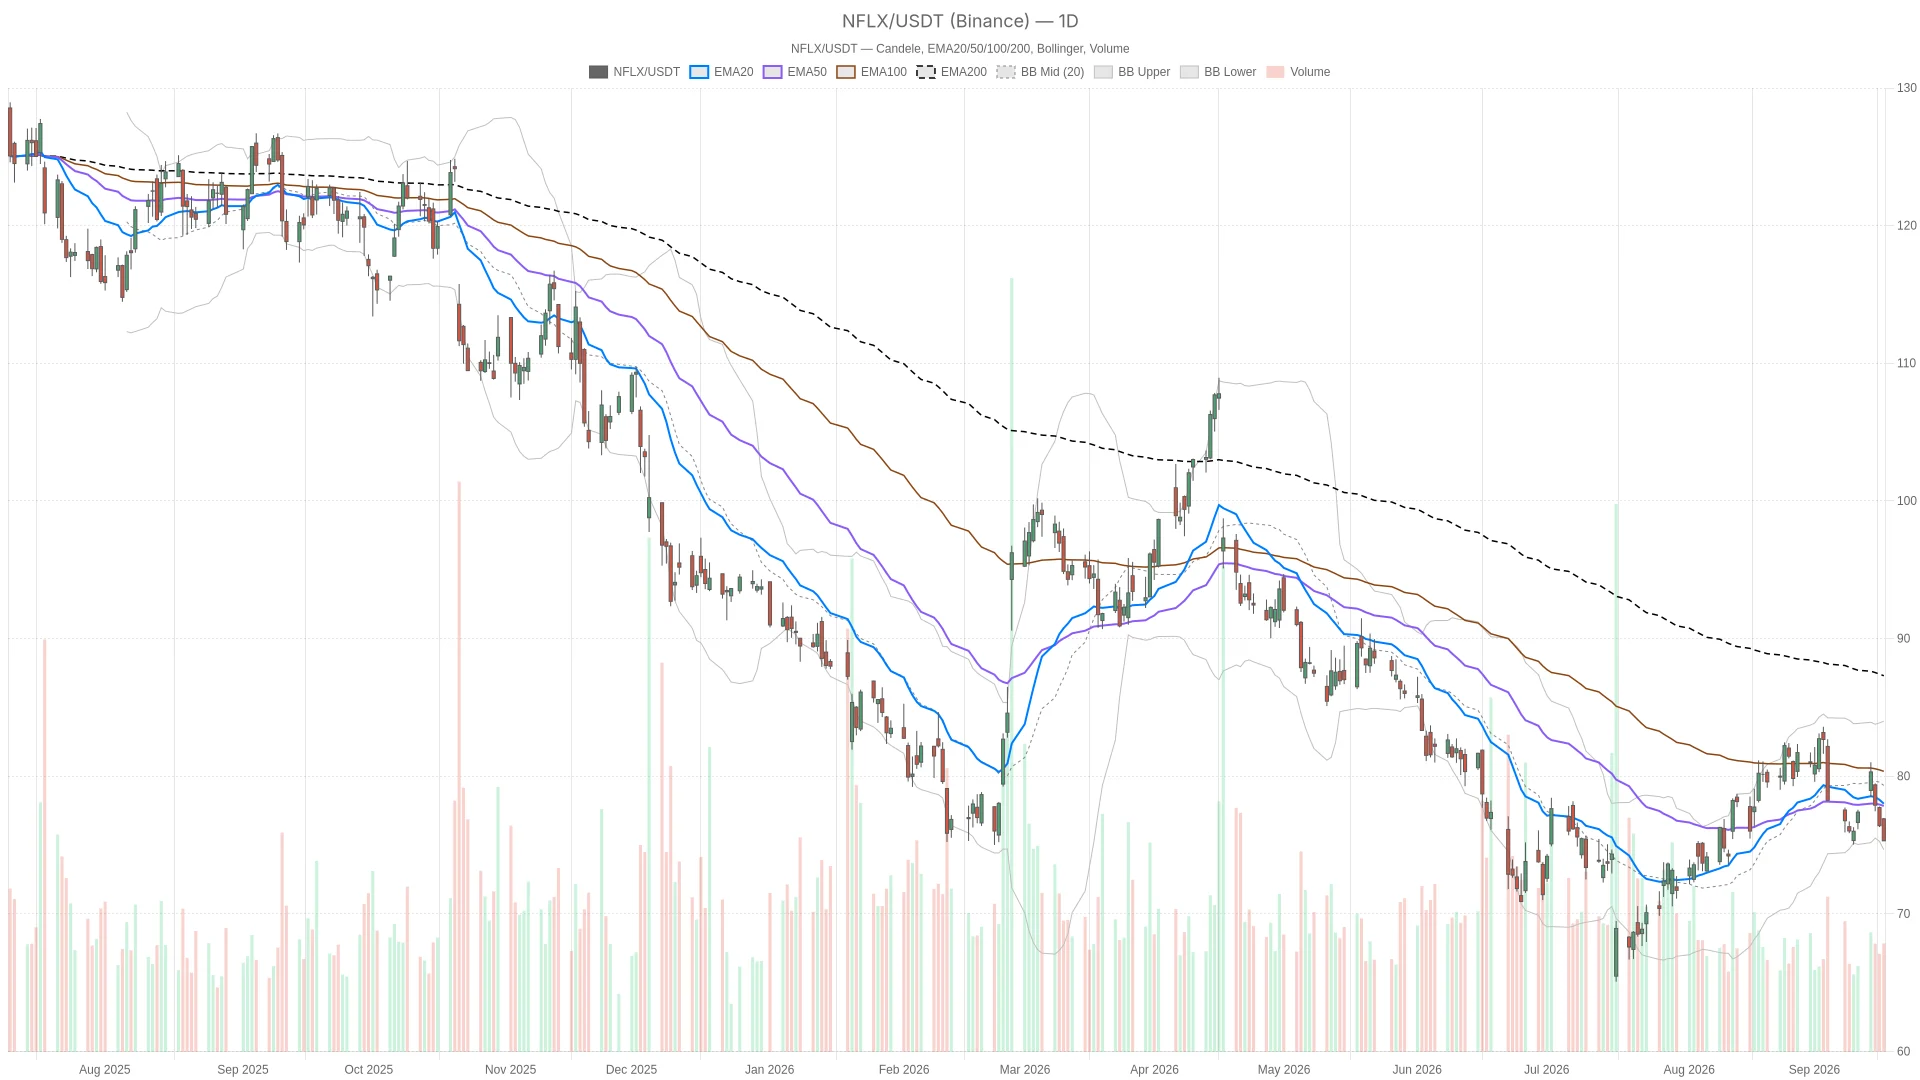 NFLX — daily chart with candlesticks, EMA20/EMA50 and volume.
Summary
- Key takeaways
- Daily Trend: Netflix, Inc. Stock Breaks Below Key Averages
- 1H Timeframe: Confirmation, Not Contradiction
- 15-Minute Execution Context
- What’s Driving the Move in Netflix, Inc. Stock
- Bullish Scenario for Netflix, Inc. Stock
- Bearish Scenario for Netflix, Inc. Stock
- Positioning and Volatility Outlook
- FAQ
Key takeaways
- NFLX closed at $75.31, below its EMA20 ($78.01), EMA50 ($77.85), and EMA200 ($87.30)—a textbook bearish structure.
- Daily RSI14 at 43.14 remains neutral, meaning sellers still have room to push lower before exhaustion signals appear.
- A Wells Fargo downgrade on a weak content slate followed the stock’s latest leg of selling pressure.
- Hourly RSI14 has fallen to 26.06 (oversold), hinting at a potential short-term relief bounce.
- Key support sits at $74.66–$74.75; a daily close below this zone would confirm extended bearish control.
Daily Trend: Netflix, Inc. Stock Breaks Below Key Averages
The daily trend for Netflix stock has turned decisively bearish, with price closing below all three major EMAs and momentum indicators confirming downside pressure.
On the daily timeframe, price closed at $75.31, below the EMA20 at $78.01, the EMA50 at $77.85, and well under the EMA200 at $87.30. The gap to the 200-day average, roughly 12 points, shows this is not a shallow pullback. It reflects meaningful trend deterioration that has been building for some time.
Meanwhile, the daily RSI14 sits at 43.14, which is neutral rather than oversold. This leaves sellers with room to push lower before the daily chart flags exhaustion. The daily MACD line at -0.05 sits below its signal line at 0.59, producing a histogram of -0.64. That negative reading confirms momentum has shifted decisively to the downside.
Bollinger Bands add another layer. The mid-band stands at 79.33, the upper band at 84.00, and the lower band at 74.66. Price at $75.31 is hugging the lower band. This typically signals either a strong trending move lower or an approaching stretch that invites a technical bounce.
At the same time, the daily ATR14 reads 2.23, indicating volatility has expanded meaningfully compared with a calmer regime. On the pivot framework, the daily pivot point sits at 75.86, with resistance at 76.41 and support at 74.75. Price trading below the pivot and just above support confirms sellers are in control heading into the next session.
1H Timeframe: Confirmation, Not Contradiction
The one-hour chart reinforces the bearish outlook for Netflix stock, though an oversold RSI reading of 26.06 hints at a possible short-term bounce.
Price at 75.30 sits below the EMA20 at 76.63, the EMA50 at 77.49, and the EMA200 at 77.50. This alignment is categorically bearish. The H1 RSI14 has dropped to 26.06, which is genuinely oversold territory. This contrasts with the more neutral daily reading. The bigger trend is bearish but not yet exhausted, while the shorter-term swing is stretched and vulnerable to a relief bounce.
At the same time, the H1 MACD line at -0.72 remains below its signal at -0.53, with a histogram of -0.19. It is still negative but narrower than earlier readings. This hints that downside momentum may be decelerating slightly on this timeframe.
Meanwhile, Bollinger Bands show the mid-band at 76.87, upper at 78.96, and lower at 74.79, with price again pressing the lower boundary. The H1 ATR14 of 0.48 is modest relative to the daily reading. This suggests the intraday move is orderly rather than panicked. The hourly pivot sits at 75.39 with resistance at 75.48 and support at 75.21, placing the market right at a decision point.
15-Minute Execution Context
The 15-minute chart shows a bearish consolidation phase for Netflix stock, with tight Bollinger Bands compressing ahead of the next directional move.
Price closed at 75.30, still below the EMA20 at 75.68, EMA50 at 76.32, and EMA200 at 77.63. The regime here is also flagged as bearish. Yet the RSI14 at 29.55 is deep in oversold territory. Meanwhile, the MACD histogram has flipped slightly positive at 0.03, even though the MACD line at -0.27 remains below the signal at -0.30. That small histogram flip is a short-term detail, not a trend reversal. However, it does suggest sellers are losing some intraday steam at current levels.
Notably, Bollinger Bands on this timeframe are tight: mid at 75.60, upper at 75.87, lower at 75.34, with an ATR14 of just 0.16. This compression points to consolidation forming right above the 74.66 daily lower band and near the 74.75 daily support. In practice, this is the kind of setup where a decisive break in either direction tends to set the tone for the next few sessions once volatility expands again.
What’s Driving the Move in Netflix, Inc. Stock
A Wells Fargo downgrade, tied to a weak content slate, emerged as a fresh fundamental headline following the selloff, compounded by a valuation comparison that favors Disney.
At the same time, Investing.com separately flagged the stock’s slide during the session. A Yahoo Finance comparison piece argued that Disney’s diversified growth, streaming profitability, and content slate give it an edge over Netflix stock right now on valuation grounds. Taken together, the news flow explains why sellers had a fresh trigger to press the daily breakdown.
However, not all headlines point one way. Bill Ackman’s Pershing Square took a new stake in Netflix in 2026, years after a previous money-losing bet, with Ackman saying this time is different. Separately, a Motley Fool piece noted that Netflix stock has fallen 35% or more on six prior occasions. Every one of those drawdowns eventually resolved into a new high. Neither point changes the current technical picture, but they do show that long-term positioning views on Netflix, Inc. stock remain split even as the charts turn defensive.
Bullish Scenario for Netflix, Inc. Stock
A bullish reversal requires buyers to defend the $74.66–$74.75 support zone and reclaim the daily EMA20 near $78.01, with oversold readings on shorter timeframes providing the initial spark.
The confluence of the lower Bollinger Band and the S1 pivot creates a critical floor. A reclaim of the daily EMA20 near 78.01 would be the first real sign that the downtrend is losing force. On the hourly and 15-minute charts, oversold RSI readings of 26.06 and 29.55 already hint at bounce potential. The slight positive tilt in the 15-minute MACD histogram could be an early tell. Therefore, a short-term relief rally toward the daily pivot at 75.86 and then resistance at 76.41 is plausible if selling pressure simply pauses rather than reverses outright.
Bearish Scenario for Netflix, Inc. Stock
The bearish case remains the path of least resistance, with a breakdown below $74.75 likely to trigger a deeper decline toward levels far closer to the 200-day EMA distortion zone.
In contrast to any bounce hopes, the daily chart shows price below all three EMAs, a negative MACD histogram, and a close pressed against the lower Bollinger Band. If support at 74.75 gives way, the next technical reference becomes the lower Bollinger Band itself at 74.66. Beyond that, there is little structural support until price approaches levels far closer to the 200-day EMA. The Wells Fargo downgrade and the Disney comparison narrative add fundamental weight to that risk. A daily close below 74.66 would invalidate any near-term bullish attempt and confirm sellers are extending control into the next leg lower.
Positioning and Volatility Outlook
The overall bias is bearish across daily and hourly timeframes, but compressed intraday volatility signals the market is pausing to digest the move rather than accelerating it.
Overall, the weight of evidence across the daily and hourly timeframes points to a bearish bias for Netflix, Inc. stock. The daily trend is broken and the hourly regime confirms rather than contradicts that view. However, the 15-minute chart’s oversold readings and tight volatility compression suggest digestion, not acceleration. Elevated daily ATR of 2.23 against a much calmer 15-minute ATR of 0.16 underlines how uncertain the next directional push could be. Given the mixed fundamental narrative—split between a fresh analyst downgrade and renewed institutional interest—positioning around current levels calls for caution and close attention to price behavior near the $74.66 to $75.86 range in the sessions ahead.
FAQ
Is Netflix stock in a bearish trend?
Yes. The daily chart shows price below all three major EMAs—EMA20 at $78.01, EMA50 at $77.85, and EMA200 at $87.30—with a negative MACD histogram of -0.64 confirming bearish momentum.
What support levels should traders watch on NFLX?
The key support zone is $74.66–$74.75, representing the confluence of the daily lower Bollinger Band and the S1 pivot. A daily close below this area would signal extended selling pressure.
Is a short-term bounce likely for Netflix stock?
Short-term oversold readings on the H1 RSI14 (26.06) and 15-minute RSI14 (29.55) suggest a relief bounce is possible. However, any rally would need to reclaim the daily EMA20 near $78.01 to signal a meaningful shift in momentum.
What fundamental factors are pressuring Netflix, Inc. stock?
A Wells Fargo downgrade citing a weak content slate followed the stock’s latest slide, while a separate analysis argued Disney’s diversified growth and streaming profitability give it a valuation edge over Netflix right now.
{"@context":"","@type":"FAQPage","mainEntity":[{"@type":"Question","name":"Is Netflix stock in a bearish trend?","acceptedAnswer":{"@type":"Answer","text":"Yes. The daily chart shows price below all three major EMAs—EMA20 at $78.01, EMA50 at $77.85, and EMA200 at $87.30—with a negative MACD histogram of -0.64 confirming bearish momentum."}},{"@type":"Question","name":"What support levels should traders watch on NFLX?","acceptedAnswer":{"@type":"Answer","text":"The key support zone is $74.66–$74.75, representing the confluence of the daily lower Bollinger Band and the S1 pivot. A daily close below this area would signal extended selling pressure."}},{"@type":"Question","name":"Is a short-term bounce likely for Netflix stock?","acceptedAnswer":{"@type":"Answer","text":"Short-term oversold readings on the H1 RSI14 (26.06) and 15-minute RSI14 (29.55) suggest a relief bounce is possible. However, any rally would need to reclaim the daily EMA20 near $78.01 to signal a meaningful shift in momentum."}},{"@type":"Question","name":"What fundamental factors are pressuring Netflix, Inc. stock?","acceptedAnswer":{"@type":"Answer","text":"A Wells Fargo downgrade citing a weak content slate followed the stock's latest slide, while a separate analysis argued Disney's diversified growth and streaming profitability give it a valuation edge over Netflix right now."}}]}
Article produced with the assistance of artificial intelligence and reviewed by the editorial team.
Disclaimer: The content of this article solely reflects the author's opinion and does not represent the platform in any capacity. This article is not intended to serve as a reference for making investment decisions.
You may also like
XRP eyes $2 target as Evernorth secures $30M for institutional XRP purchases
JPMorgan: Custom chip shipments will surpass GPU in 2027; Broadcom TPU's "supply chain invisibility" does not indicate questionable orders
J.P. Morgan expects that by 2027, the shipment share of ASICs/XPUs will reach 54%, surpassing GPUs, with custom chips becoming an important new driver of AI computing power. The five-year TPU agreement between Broadcom and Google covers 2026 to 2031; although supply chain information is not transparent, this does not imply doubts about the orders, and revenue visibility remains strong. During the same period, demand for wafer equipment and storage is also strengthening, supporting the continuation of the semiconductor cycle.
US stocks' September downturn not over yet? Citadel strategist warns: Downward pressure still exists before month-end, potential turnaround in October
Citadel Securities strategist Rubner stated that as US stocks face the $7 trillion options expiration on "triple witching day" this Friday, there is still room for quantitative strategies to sell off, and the overlap of the stock buyback blackout period and pension fund end-of-quarter rebalancing means bearish forces will prevail before the end of the month. However, with the sharp decline in AI trading mania, combined with seasonal tailwinds in the fourth quarter, earnings season catalysts, and the restart of stock buybacks, he is optimistic about the market outlook for Q4.


