Gold Price Moves Sideways: Stronger US Dollar Offsets Cooling Fed Rate Hike Expectations

Huitong News, October 6—— Gold prices remain in a sideways range, with a strong US dollar and high US Treasury yields limiting the upside for gold. Persistent inflation risks keep the overall Fed policy stance leaning towards further monetary tightening. Bulls need to reclaim the $4,200 threshold to regain short-term bullish momentum.
On Monday (October 5), spot gold lacked clear directional impetus. A strengthening US dollar and elevated Treasury yields suppressed gold prices, while waning expectations for a Fed rate hike provided downside support for gold. Spot gold traded at $4,128.02, down 0.30%.
Latest US business survey data has not provided new direction for gold. The S&P Global Services PMI for September was revised up slightly from the initial 58.7 to 58.8, while the Composite PMI remained unchanged at 58.4. In contrast, the Institute for Supply Management (ISM) Services PMI fell from 55.4 to 54.9, slightly below market expectations of 55.0.
Prior to the release of this data, last Friday's employment report missed expectations: Nonfarm payrolls in the US rose by just 29,000 in September, well below the market forecast of 90,000. Employment figures for the previous two months were revised down by a total of 60,000, the unemployment rate edged up to 4.2%, and wage growth slowed to 3.0% year-over-year.
Earlier, the August Personal Consumption Expenditures (PCE) inflation data also missed expectations and previous data was revised downward. Both the labor and inflation data weakening has dampened expectations for another Fed rate hike at the October 27-28 FOMC meeting.
According to the CME FedWatch tool, traders now price the probability of a rate hike in October at just about 20%, compared to nearly 70% last week. However, as policymakers remain concerned about inflation staying above the 2% target—and with ongoing Middle East tensions further elevating energy inflation risks—the overall monetary policy outlook remains tilted towards further tightening. This both limits gold’s upside and provides support for the US dollar and Treasury yields.
Deutsche Bank economists said: “Despite disappointing nonfarm data, the overall labor market remains resilient, as reflected in the ADP employment numbers and initial jobless claims data. As such, we still expect the Fed to hike two more times in the next two quarters, at 25 basis points each.” Economists further noted, “After the nonfarm payroll release, Fed officials’ speeches largely maintained the quarterly rate hike pace implied by the September dot plot. Even if nonfarm missed expectations, our assessment of the Fed's policy path has not changed significantly.”
Domestic political and fiscal strains in France continued to intensify, causing a significant drop in the euro, which in turn boosted the US dollar. The US dollar index reached an intraday high of 102.53 (the highest since April 2025), before retreating towards 102.20.
Meanwhile, the benchmark US 10-year Treasury yield remains near 5.30%, having briefly spiked to 5.34% last week, the highest since 2002. A strong US dollar makes gold more expensive for overseas buyers; high yields increase the opportunity cost of holding non-yielding assets like gold.
Looking ahead, the market will focus on the September FOMC meeting minutes released Wednesday, initial jobless claims data on Thursday, and Friday’s University of Michigan consumer sentiment and inflation expectations data.
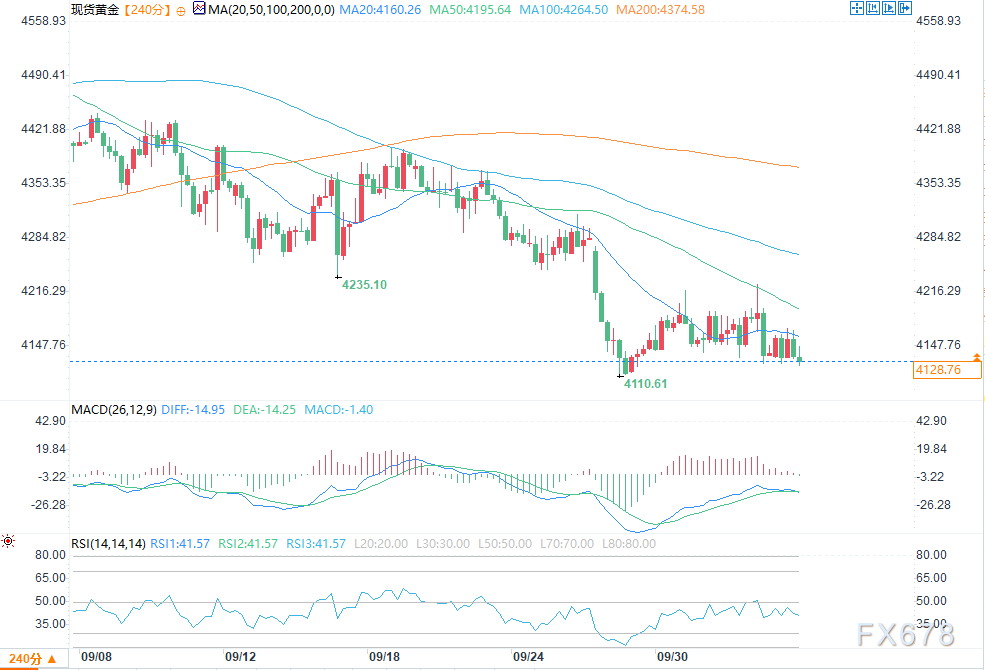
(Spot gold 4-hour chart Source: EasyHuitong)
On the 4-hour chart, spot gold is trading sideways below all major moving averages, with short-term price action biased to the downside. Bulls have difficulty holding above the $4,160 psychological and technical level, which is close to the chart’s 50-period MA (4,195.64), forming the first major resistance in the short term.
If gold prices can effectively break above the current consolidation range and hold above the 50-period moving average, the next target is the 100-period moving average at 4,264.50; further upside resistance lies at the 200-period MA at 4,374.58. Only if the price sustainably stands above both the 100- and 200-period moving averages can the bullish repair outlook be effectively confirmed.
RSI(14) is currently at 41.57, hovering in the 40–50 range, not yet reaching the 46 level, indicating slightly weak to neutral momentum with limited bullish impetus; the MACD indicator shows DIFF = -14.95, DEA = -14.25, and MACD histogram at -1.40, all below zero, demonstrating that while there has been a minor rebound attempt, bears still dominate and the recovery is limited.
On the downside, the previous low at 4,110.61 acts as the first key support, followed by the critical psychological level at $4,100. If the candles validly break below the 4,110–4,100 support zone, further selling will be triggered and bearish pressure magnified, with subsequent support seen at the 4,000–3,950 dollar range.
Disclaimer: The content of this article solely reflects the author's opinion and does not represent the platform in any capacity. This article is not intended to serve as a reference for making investment decisions.
You may also like
SUI holds above $1.045 support as Basecamp 2026 drives market focus
Gold hits two-month low as bears await break below $4,100 amid sustained USD strength
Inflation and Employment Projections: US Neutral Interest Rate May Remain Elevated