Gold surges over 2%, US dollar retraces gains after Federal Reserve decision
Huitong Network, September 18 — Due to the Federal Reserve's hawkish rate hike and the subsequent retreat in the US dollar and US Treasury yields, gold rebounded. The FOMC dot plot suggests further tightening of monetary policy, which may limit the upside for spot gold (XAU/USD). From a technical perspective, the price of gold found support near the 50-day simple moving average and is now testing the 100-day simple moving average.
During the US session on Thursday (September 17), spot gold saw a sharp rebound earlier in the day and is currently holding near the intraday high, as the US dollar gave up part of its gains following the Fed decision. Cooling gains in crude oil also prompted US Treasury yields to retreat from recent highs, providing extra support to precious metals. However, the possibility of further Fed hikes remains, capping gold’s upside potential. Spot gold is trading around $4370 during the session, up 2.50% on the day.
The US Dollar Index (DXY), which measures the dollar against a basket of six major currencies, has retreated from 100.37 (the highest since July 31) and is currently trading around 100.15. Meanwhile, the benchmark 10-year US Treasury yield remains near 4.94%, down from the 5.04% hit earlier this week, the highest since 2007.
West Texas Intermediate (WTI) crude fell nearly 2%, quoted near $95.50. Following a drone attack last week, Saudi Arabia is rerouting crude exports via Oman and repairing the damaged East-West pipeline.
The US central bank implemented its first rate hike since 2023 on Wednesday, with all FOMC members unanimously agreeing to raise the federal funds rate target range by 25 basis points to 3.75%-4.00%.
After the decision, the dollar and Treasury yields spiked, erasing gold’s intraday gains. As traders digested the latest rate expectations and Fed Chair Walsh’s speech, selling pressure increased, and spot gold briefly fell to $4235, hitting its lowest since August 7.
The updated dot plot shows that 16 of the 18 Fed policymakers expect at least one more 25-basis-point rate hike by year-end; the median rate expectation points to a policy rate of 4.1%. Walsh also sent hawkish signals, saying inflation remains too high and the current hike is a “partial withdrawal of accommodative policy.” He noted current financial conditions hardly reflect tightening and added that most committee members share this view, suggesting the Fed may be ready for another hike in the coming months.
Therefore, the selling pressure on the dollar may be limited, and gold’s rebound potential is constrained. Gold, as a non-interest-bearing asset, is typically less attractive when rates rise, which boosts the appeal of interest-bearing assets and, in turn, drags on gold prices. US weekly labor market data previously released also provided some support to the dollar: Initial jobless claims came in at 196,000, lower than the expected 208,000 and the previous 206,000.
Tensions in the Middle East continue to attract market attention. US President Trump told reporters that the US is “hopeful” of nearing the end of the Iran war, claiming Tehran wants to reach a deal. However, regional tensions remain high, with Saudi Arabia and Iran-backed Houthi forces continuing to exchange strikes.
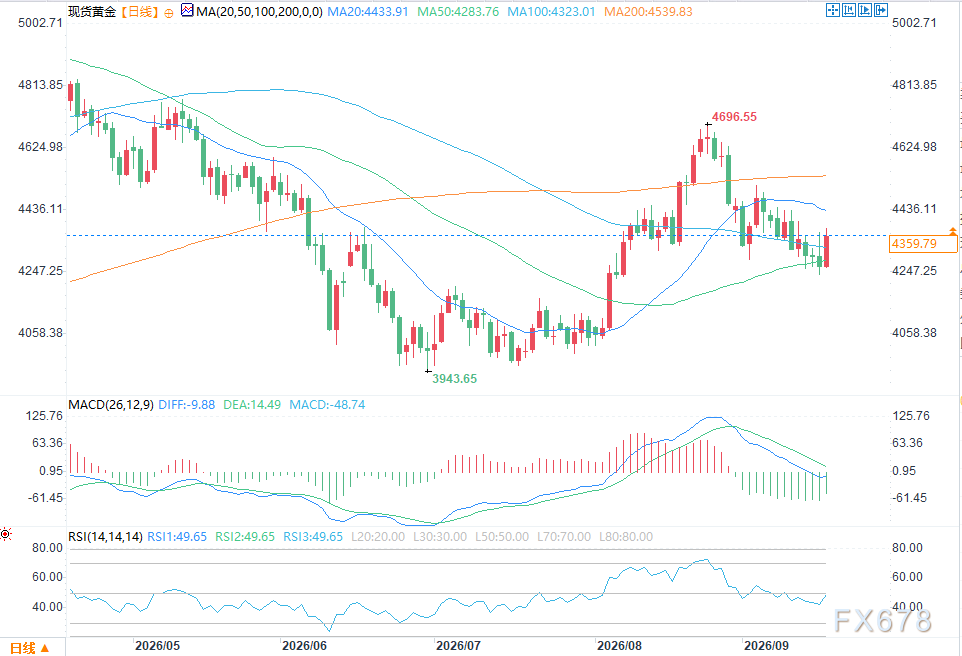
(Spot Gold Daily Chart Source: Easy Huitong)
On the daily chart, spot gold is currently fluctuating around the key moving average range, with short-term price action displaying a consolidation pattern. From the chart, the recent high for gold prices was near 4696.55, before pulling back to around 4436.11 and forming a short-term low near 4235.10.
The current price is near 4436.11, slightly above the moving average reference points shown on the chart. The 50-day moving average is around 4284, the 100-day moving average is around 4323, and the 200-day moving average is near 4540. This indicates that, after a previous rebound, gold is currently trading in the medium-term range above the 50- and 100-day moving averages, but below the 200-day moving average.
Initial resistance can be watched in the 4436–4447 zone, with further resistance at the 200-day moving average near 4540; if prices continue to rise, stronger resistance comes from the previous high near 4686.55 and the psychological barrier at 4700.
To the downside, initial support is at the 50-day moving average around 4284, with stronger support at 4235.10; if that level is breached, further support can be watched at 4150 and the round number 4000.
As for indicators, the RSI is currently around 50.12, close to neutral, indicating a short-term balance between bulls and bears. While the MACD remains in negative territory, its histogram is narrowing, suggesting the downside pressure is easing, though a clear bullish reversal has yet to appear.
Overall, gold is more likely to continue consolidating between 4235 and 4447 in the short term. If prices can hold above 4436 and break out over 4447, then short-term upside momentum could continue; otherwise, dipping below 4284 may lead to a retest of the recent low around 4235.





