
ETH Still Bullish Despite Drop to $2.5K, What’s the Next Target? (Ethereum Price Analysis)

Ethereum’s price has encountered a substantial obstacle following a significant surge last week.
The market is currently correcting, and traders are wondering whether a reversal is on the horizon.
Technical Analysis
By TradingRage
Ethereum Price Analysis: The Daily Chart
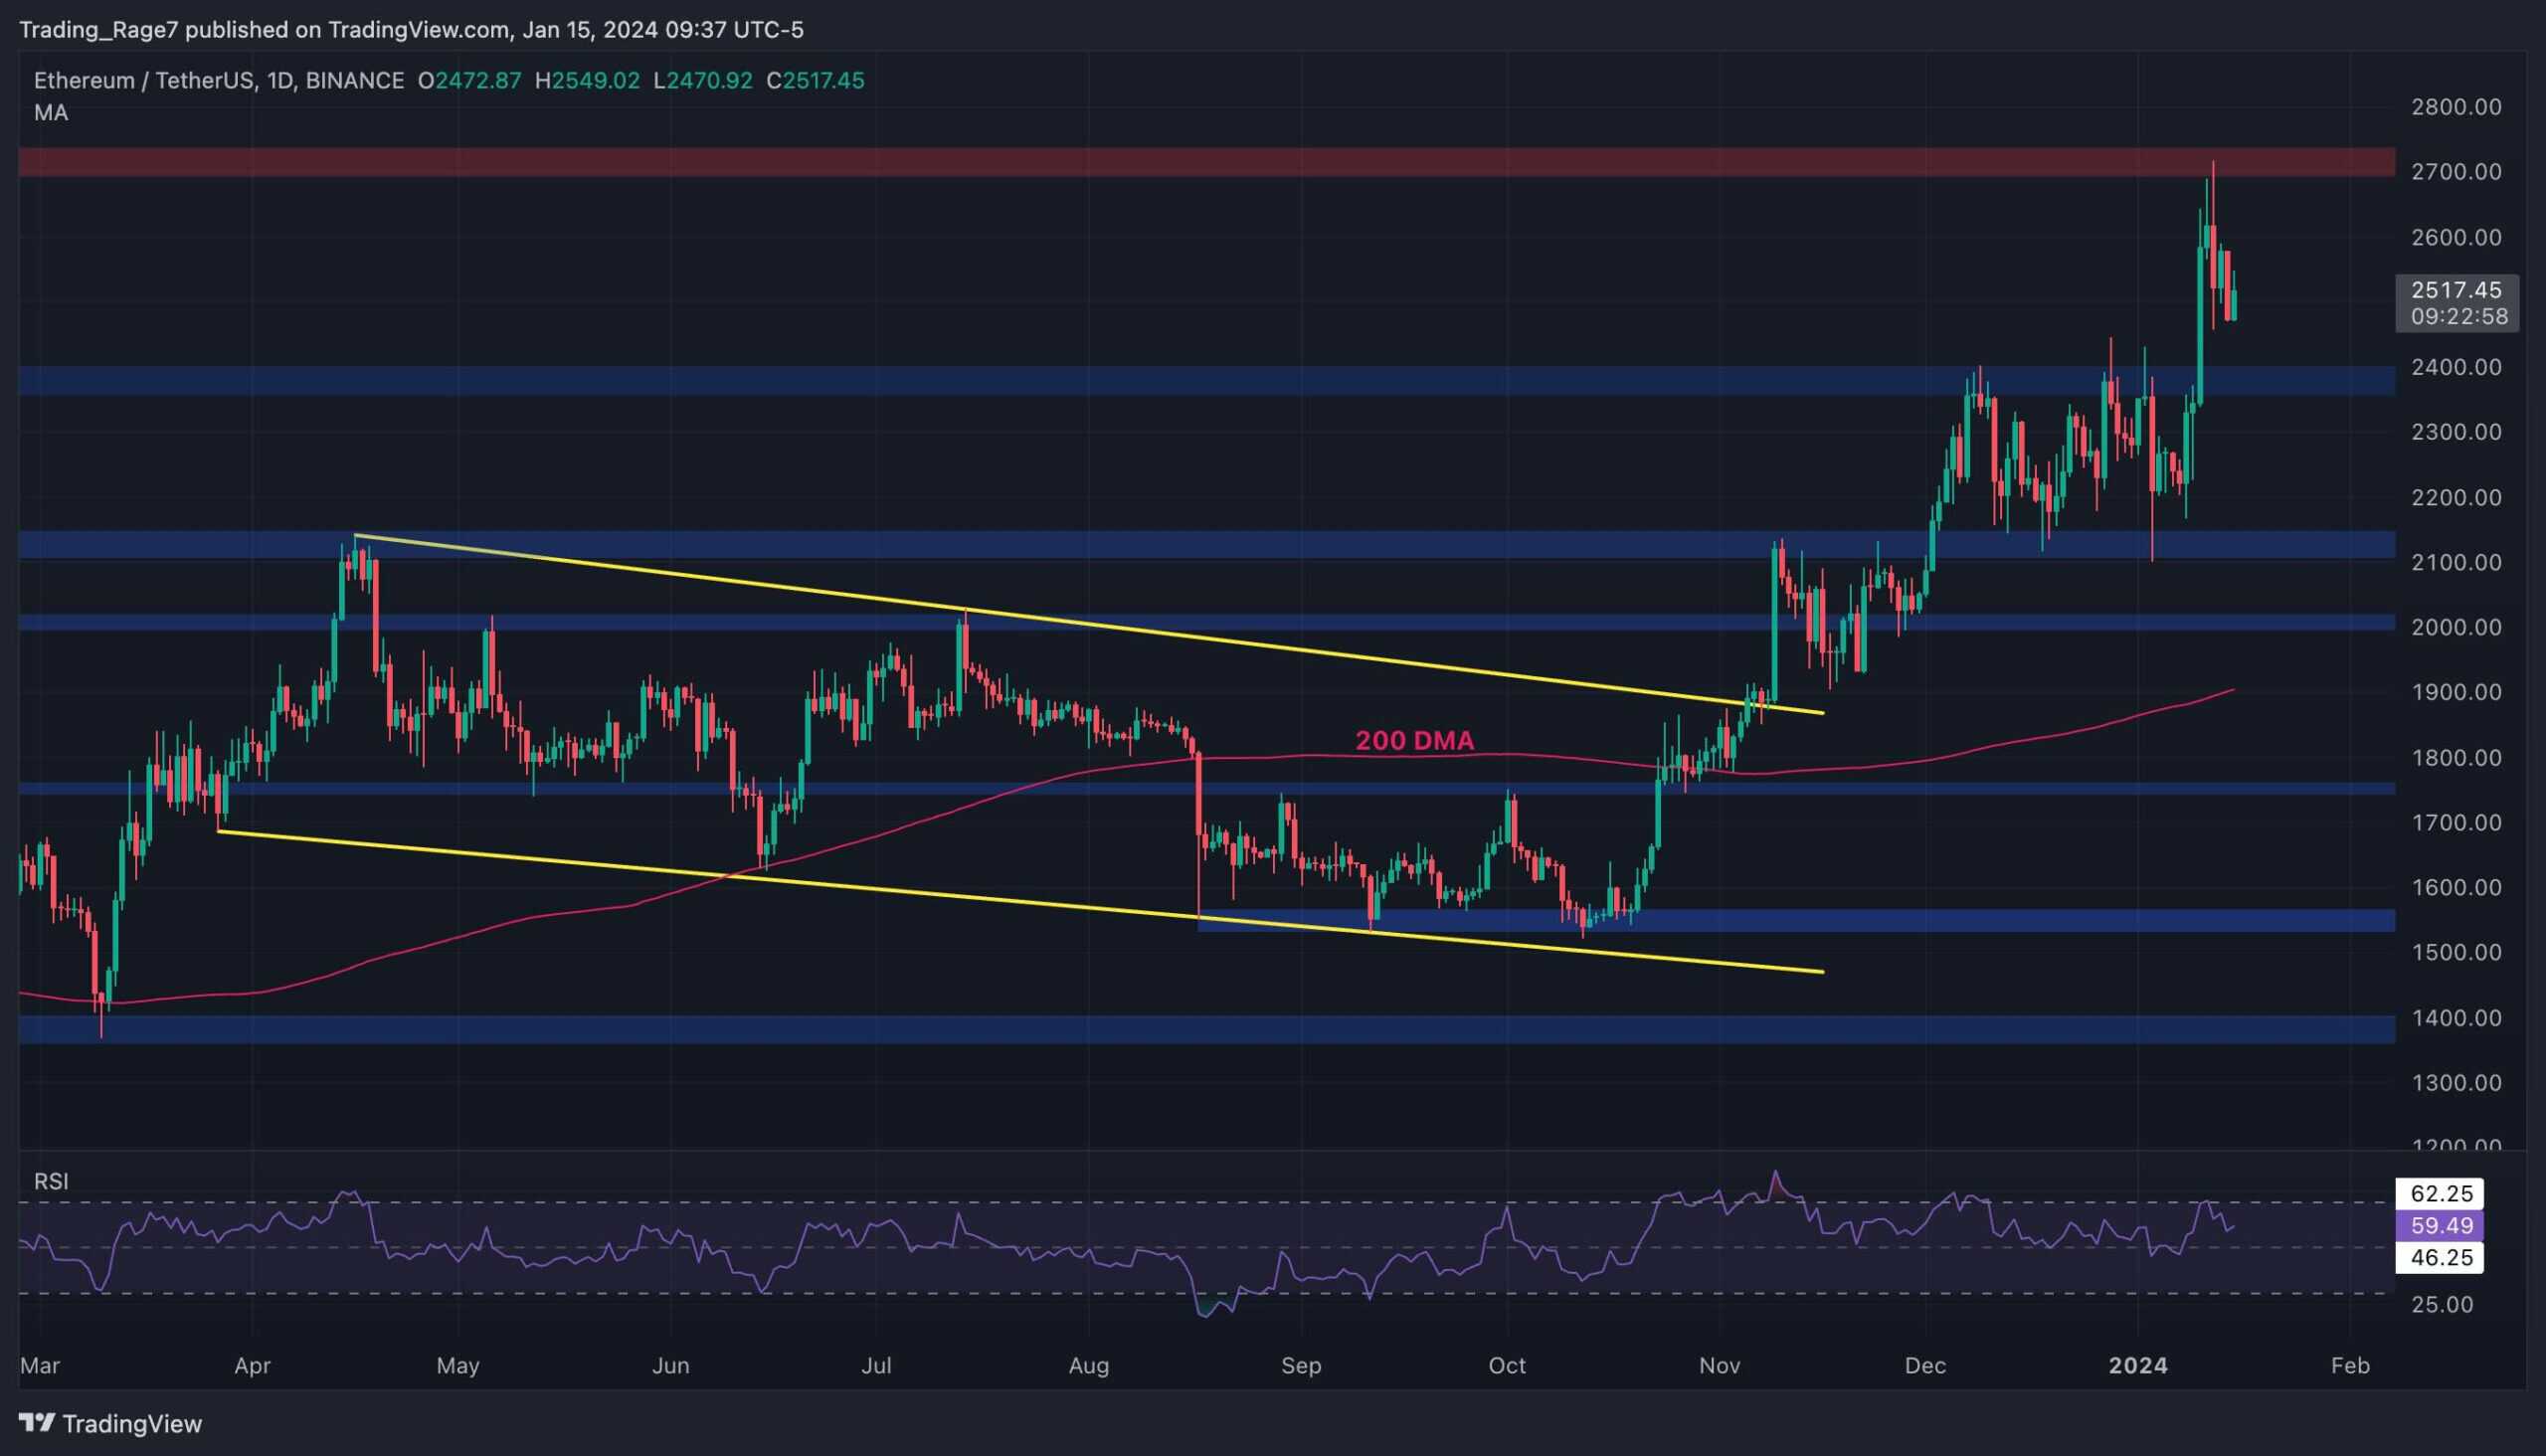
On the daily chart, the price has been very bullish over the last quarter of 2023, increasing by more than $1,000. Recently, ETH has experienced an aggressive rally toward the $2,700 resistance zone. However, this level has decisively rejected the price, and a correction toward the $2,400 area has begun.
Meanwhile, the Relative Strength Index still demonstrates values above 50%, indicating that the momentum is still bullish and the price is likely to continue its uptrend after the correction is done.
The 4-Hour Chart
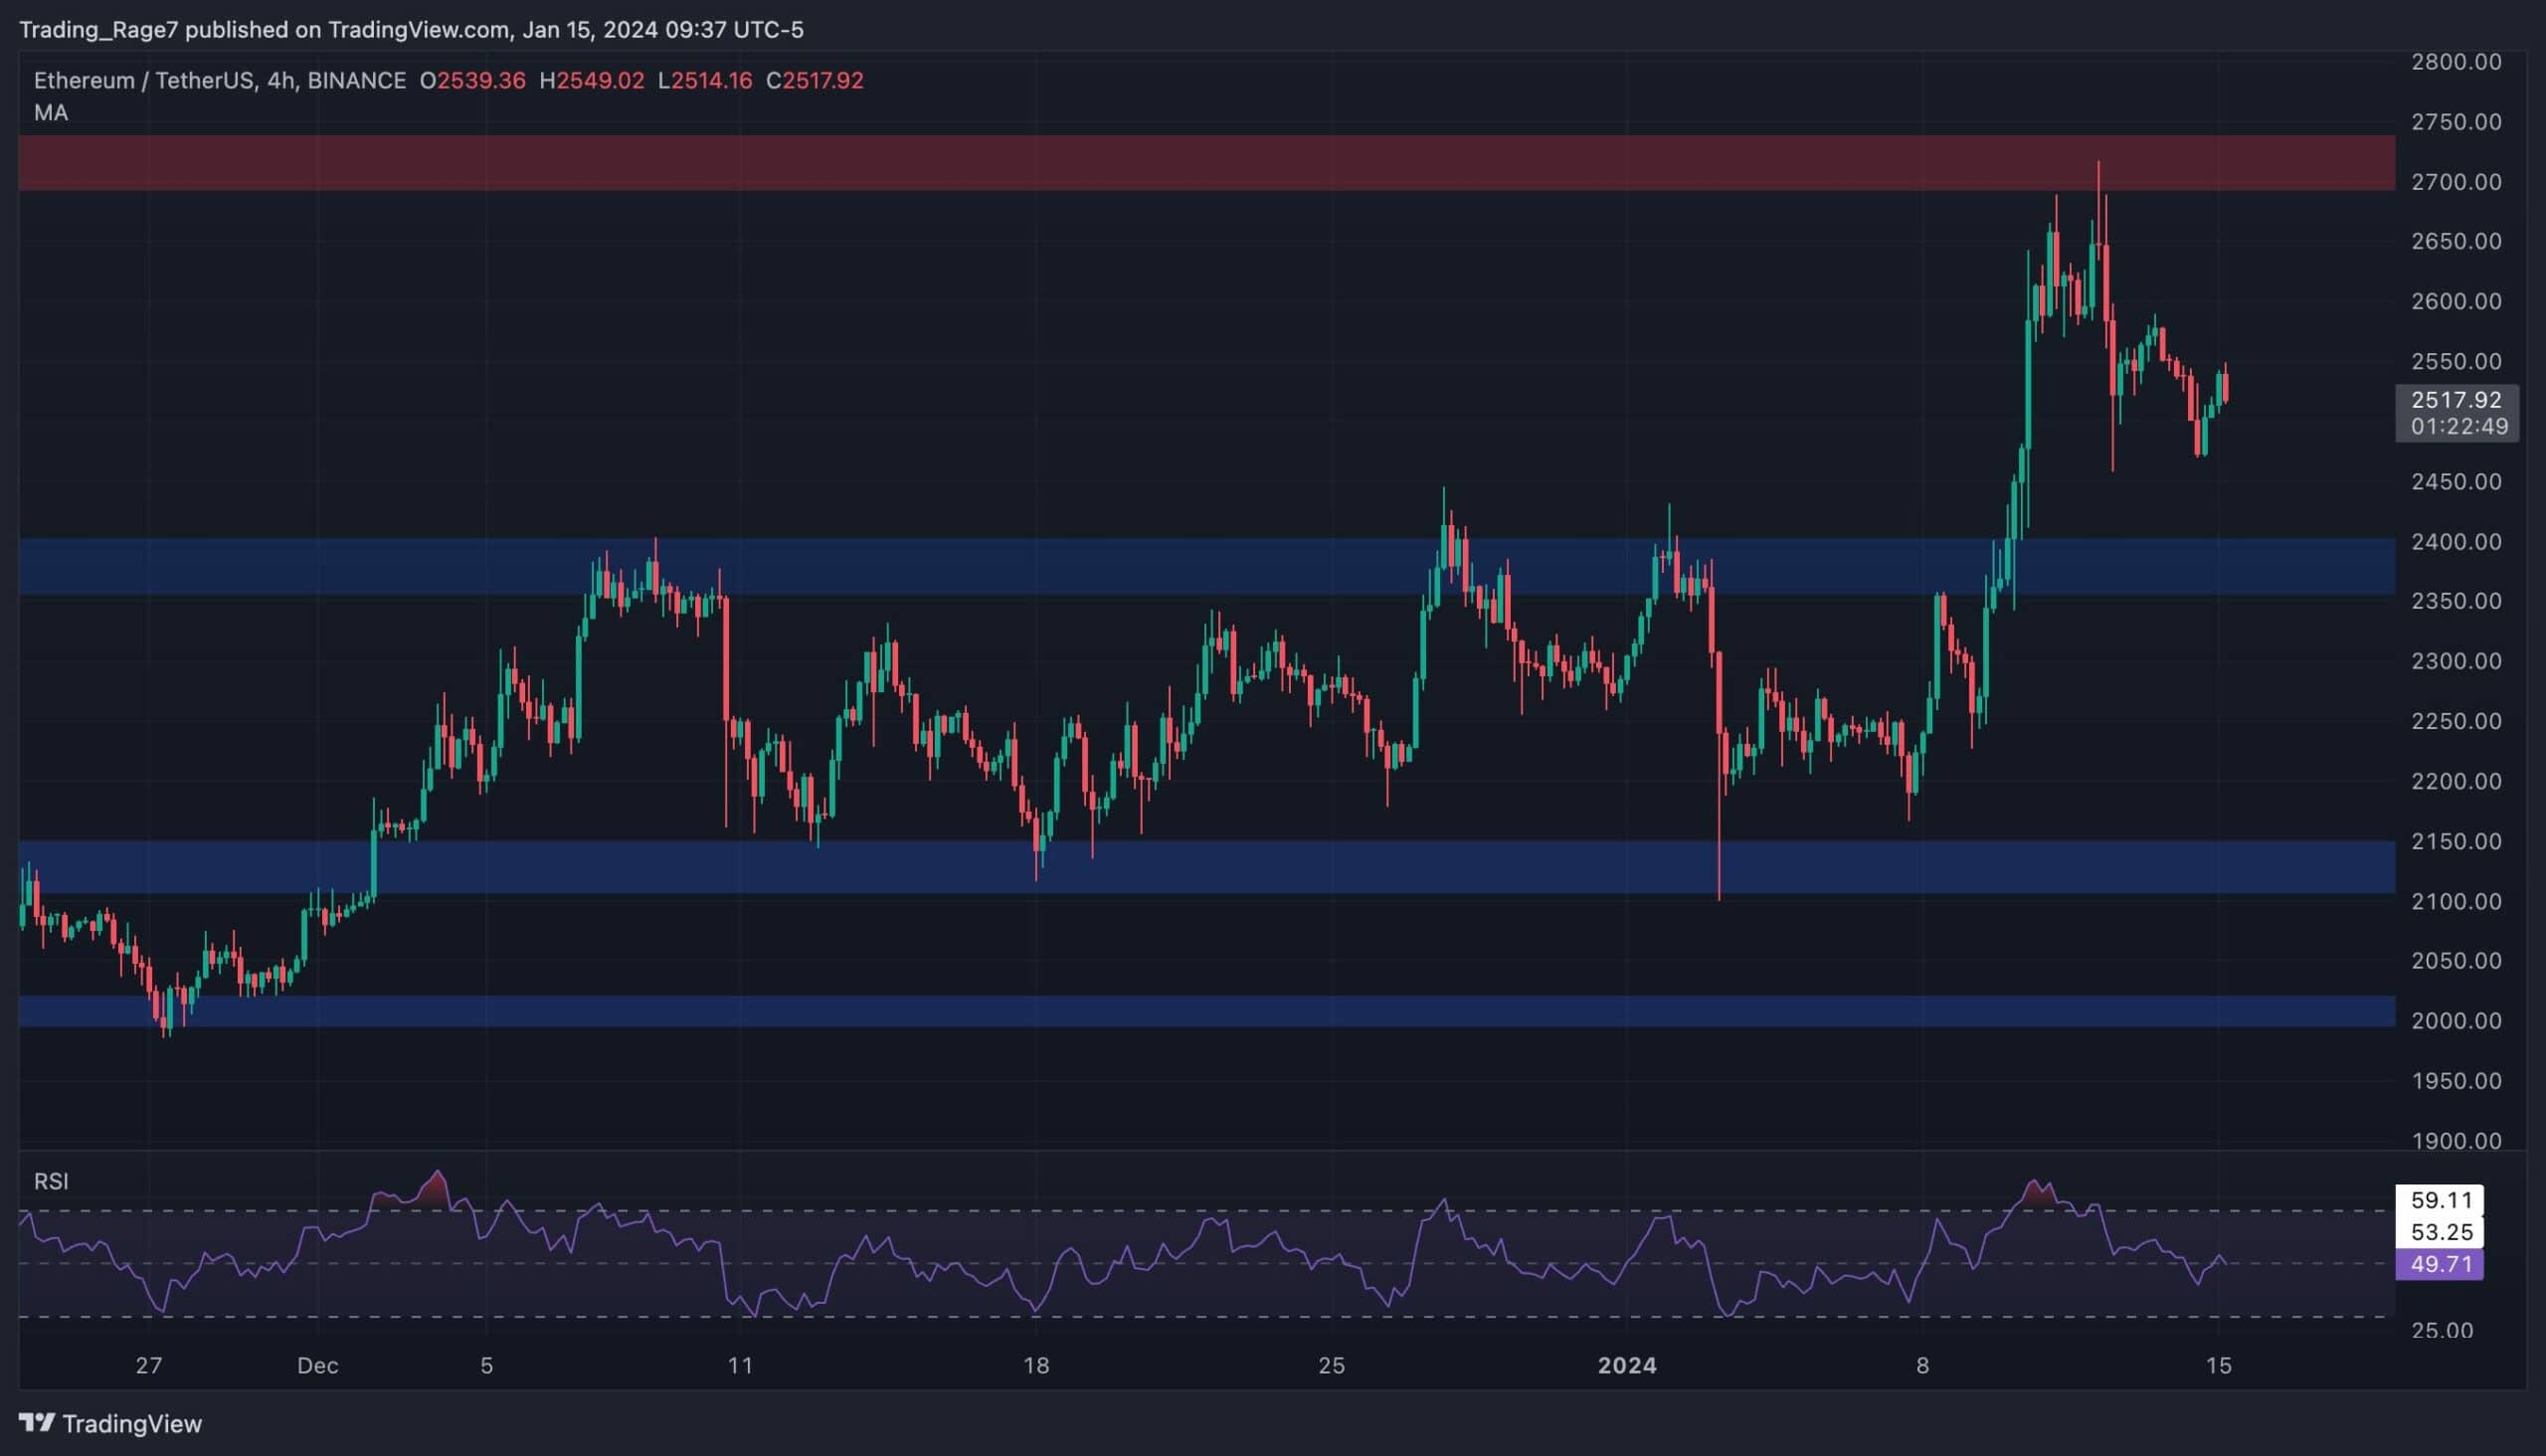
Looking at the 4-hour chart, it is clear that ETH’s price has formed a double-top pattern at the $2,700 resistance level. The relative strength index also signaled that the asset is overbought in this timeframe.
Currently, the price is forming lower highs and lows, potentially targeting the $2,400 level in the short term. Yet, this level seems likely to hold the price and initiate a rebound back toward the $2,700 level afterward, as the overall market structure is still bullish.
Sentiment Analysis
By TradingRage
Ethereum Open Interest
While Ethereum’s price is still continuing its bullish trend, some worrying signs are arising from the derivatives market. It is beneficial to have a closer look to determine whether a bearish reversal can be expected or not.
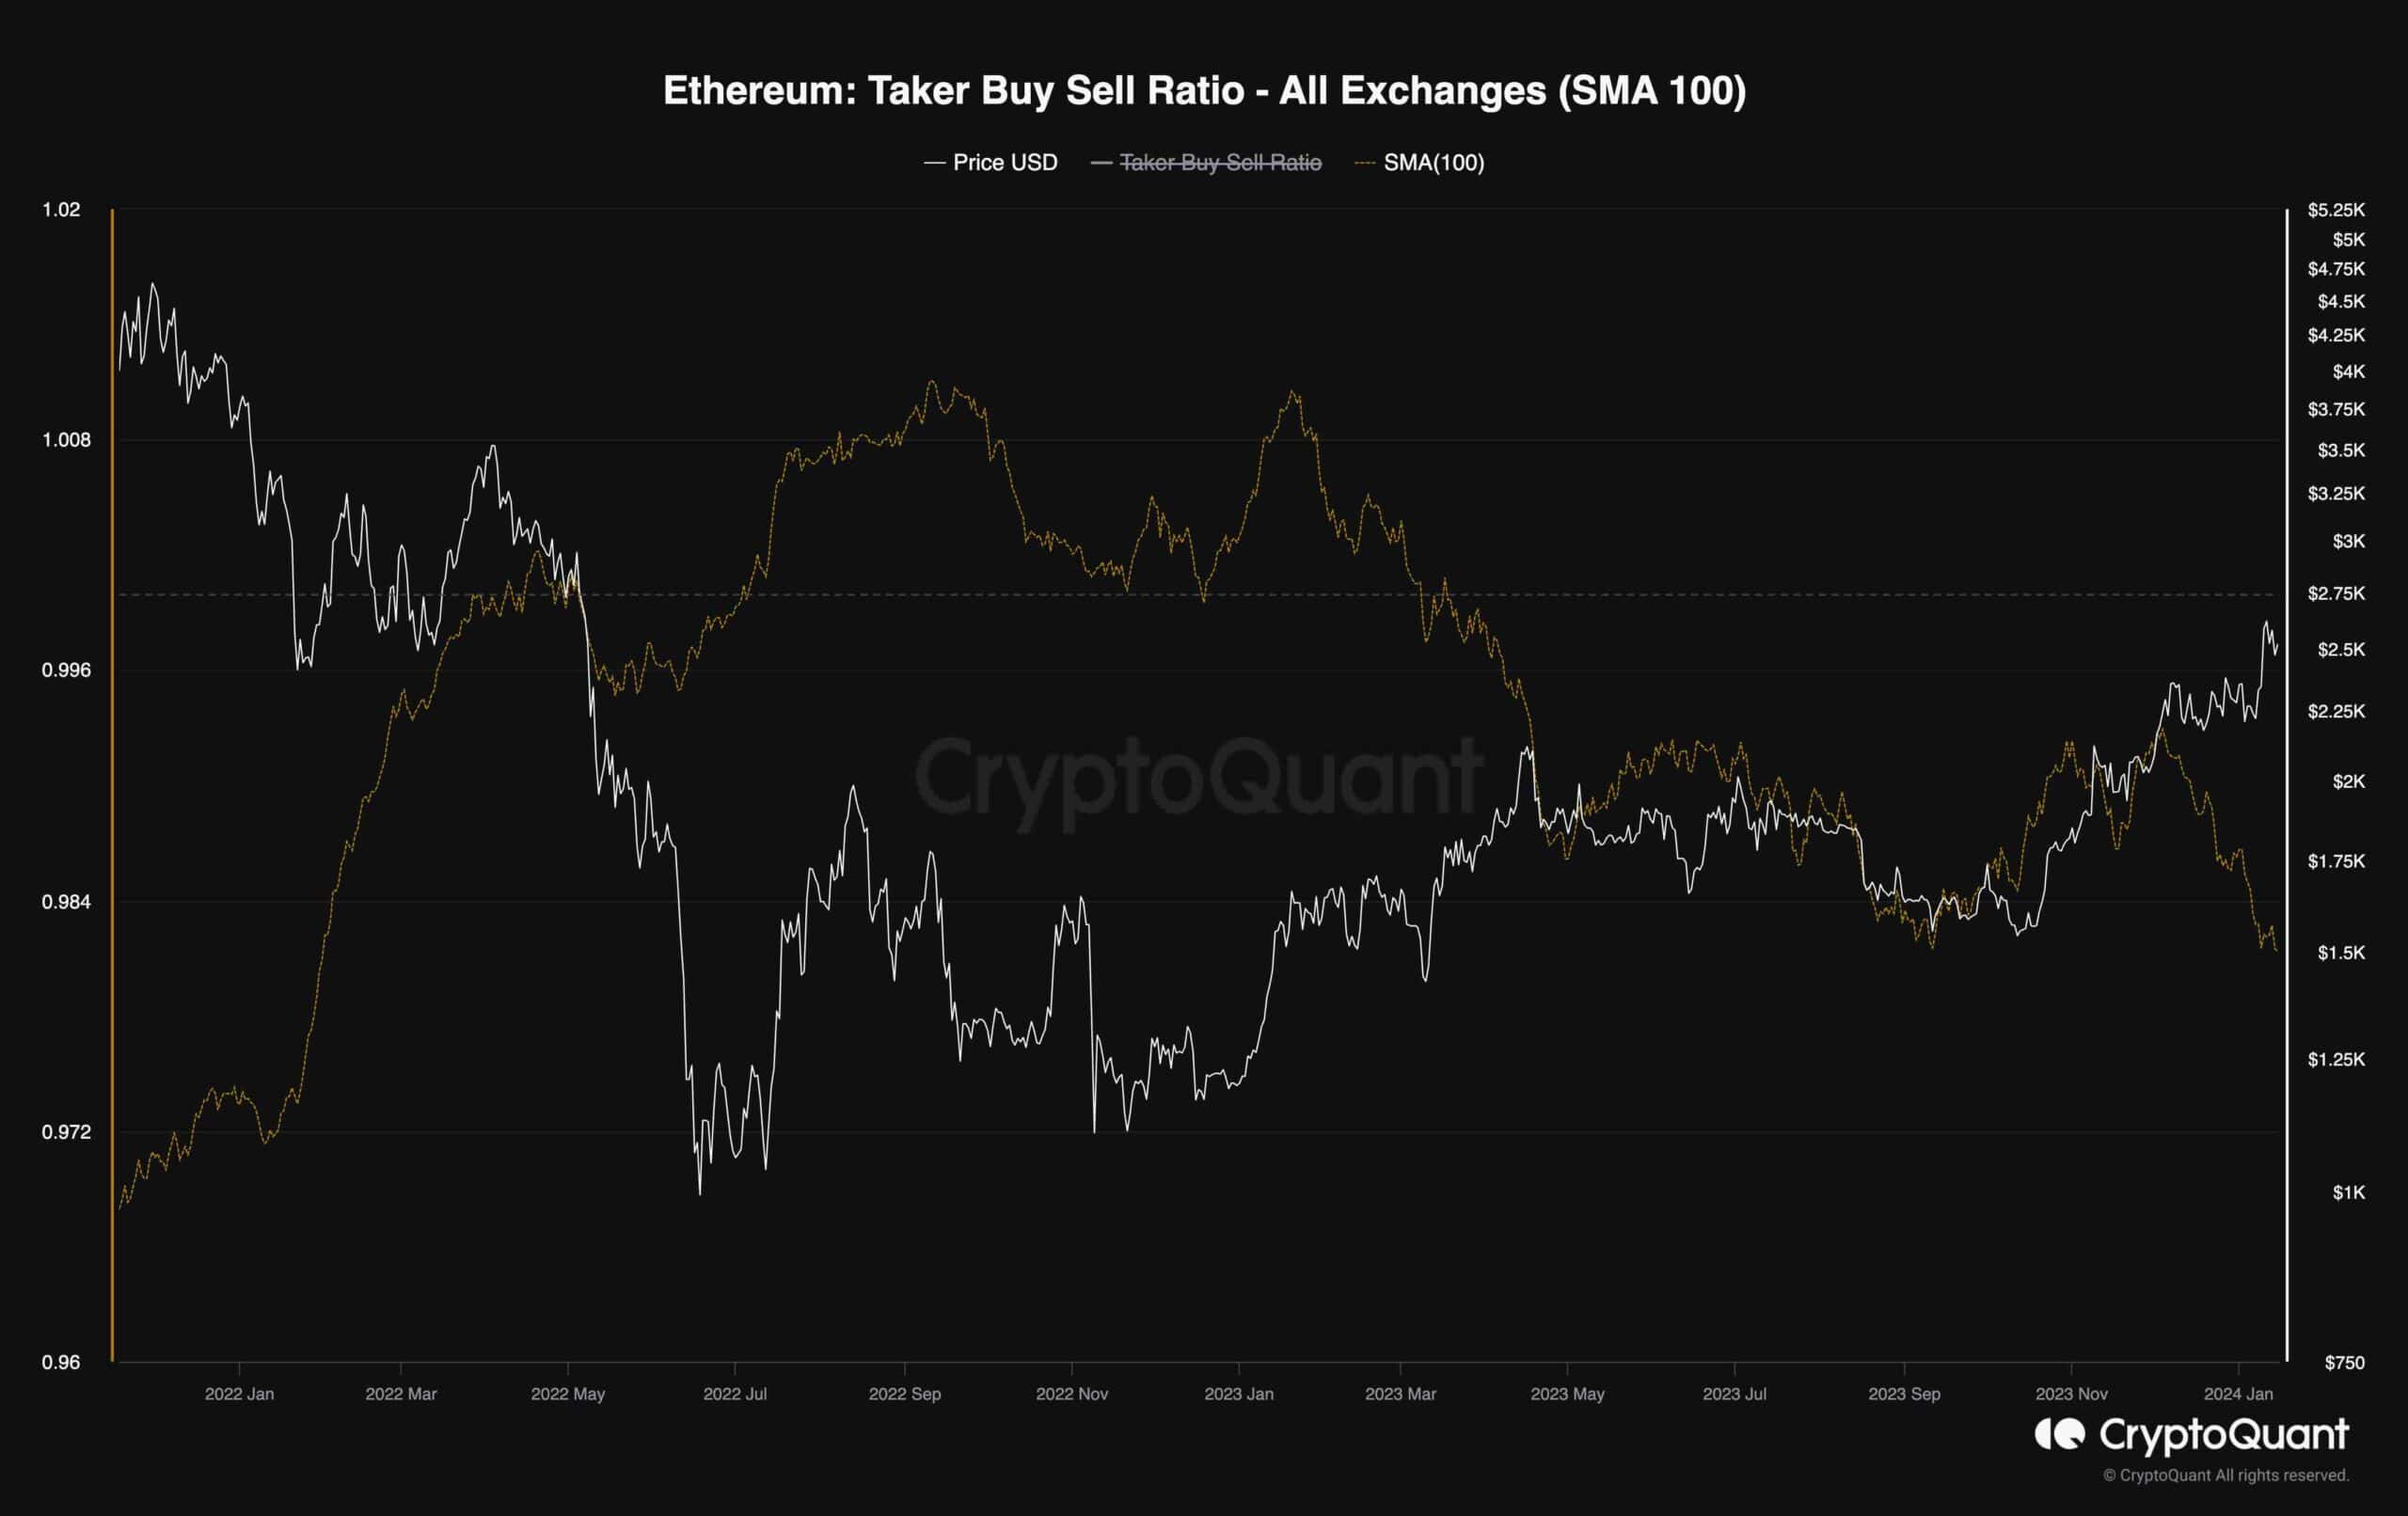
This chart depicts the Taker Buy Sell Ratio, one of the most valuable metrics for futures market sentiment evaluation. Values over 1 indicate that the bulls are executing their orders more aggressively, while values below 1 point to the bearish selling pressure.
While the Taker Buy Sell Ratio has never recovered above one during the recent uptrend, the price has been rallying higher. However, it is currently dropping rapidly, making a new low. This cannot be interpreted well, and the subsequent aggressive selling pressure by the futures trader can soon cause a considerable decline in price.
Disclaimer: The content of this article solely reflects the author's opinion and does not represent the platform in any capacity. This article is not intended to serve as a reference for making investment decisions.
You may also like
Famous US stock investor Eric Jackson joins Shanda Technology (SDA.US) Advisory Board to support the company's internationalization strategy and investor relations development
Eric Jackson, founder of EMJ Capital and renowned technology investor, has officially joined the company's advisory board.

In the era of AI inference, demand for "optical interconnects" is booming! Lumentum (LITE.US), "standing in the light," is ahead of NPO, expanding OCS to embrace the moment of profit surge
From an underlying engineering perspective, the growing demand for optical interconnection arises from more frequent and stricter data exchanges between computing nodes: expert parallelism in Mixture of Experts (MoE) models requires distributing and aggregating data across GPUs; Prefill–Decode Disaggregation necessitates the transfer of KV Cache; complex agent workflows increase the concurrency of model invocation, tool execution, and data access.

Federal Reserve rate hike rationale further reinforced! US August PPI sees biggest increase in three months, energy as main driver; tomorrow's CPI may determine the outcome
Driven by the rebound in energy product prices, the U.S. Producer Price Index (PPI) for August accelerated further, continuing a series of elevated readings since renewed hostilities between the U.S. and Iran. This may further strengthen the case for the Federal Reserve to raise interest rates at next week's meeting.

Macy's Raises Full-Year Outlook Following Fiscal Second-Quarter Beat
Crypto prices
More


