
Here’s How Low ETH Can Go if $3.5K Fails to Hold Selling Pressure (Ethereum Price Analysis)

Ethereum has recently breached a significant resistance level, crossing the psychological milestone of $4K and achieving a new high for the year.
However, this breakthrough was met with resistance, leading to a noticeable correction. The question that arises now is whether this correction is merely a temporary setback or the beginning of a broader reversal in the bullish trend.
Technical Analysis
By Shayan
The Daily Chart
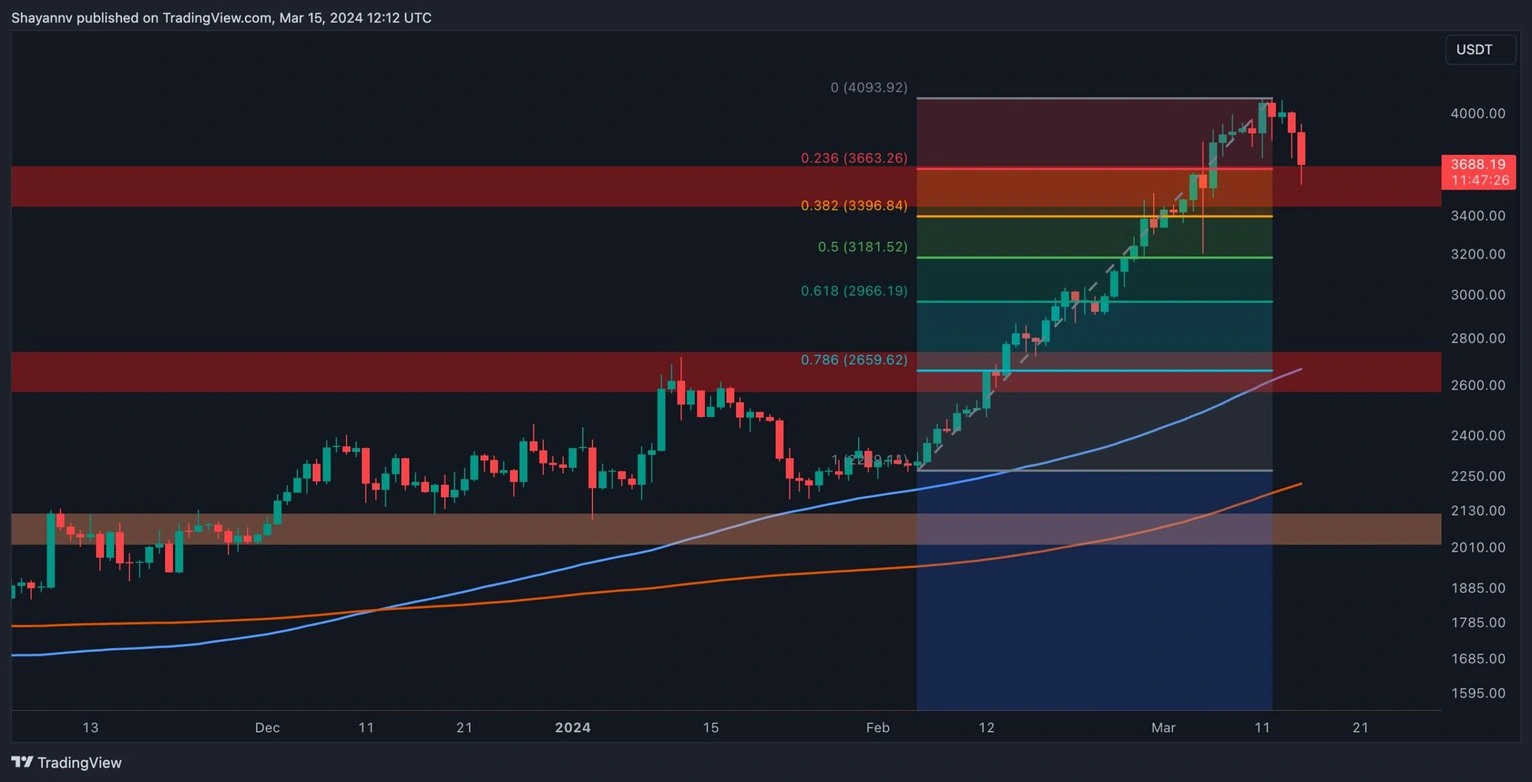
A thorough analysis of the daily chart indicates a prevailing bullish sentiment surrounding Ethereum, evident in a strong and sudden upward surge that surpassed the critical resistance at $4K. This surge reflects heightened interest from market participants in Ethereum, resulting in increased volatility.
However, after briefly surpassing the crucial $4K resistance level, the price encountered intensified selling pressure, likely due to profit-taking among participants, leading to a significant decline toward the substantial support zone of around $3.5K. It seems likely that the market will find support in this region and initiate a fresh rally.
However, in the event of a continued corrective retracement, Ethereum’s price is expected to find support around key levels within the Fibonacci retracement, specifically between the 0.5 ($3,181) and 0.618 ($2,966) levels.
The 4-Hour Chart
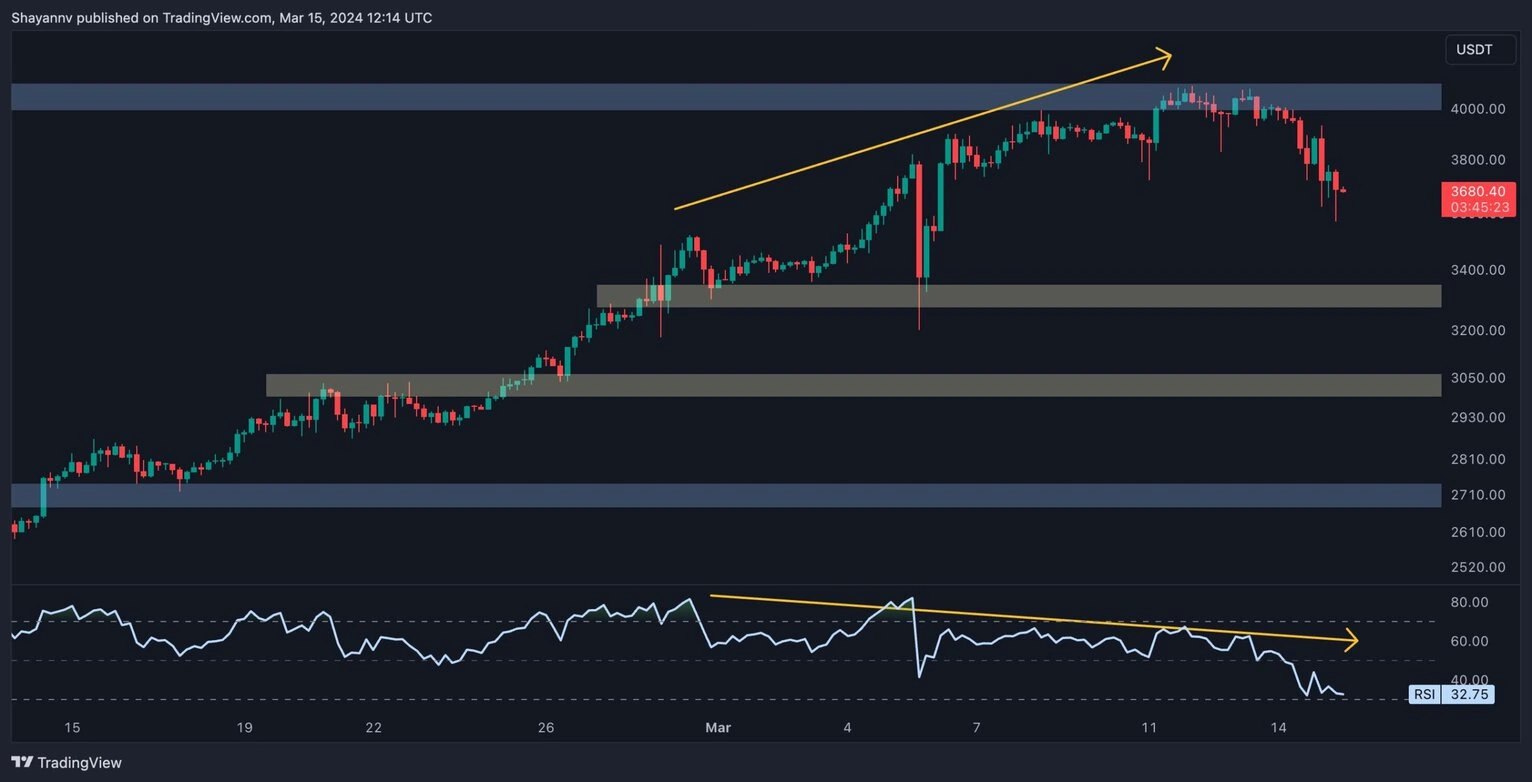
Further examination of the 4-hour chart confirms the presence of buyers in the Ethereum market, propelling the price to its highest level since April 2022. This surge, accompanied by increased market volatility, demonstrates significant buying interest aimed at surpassing the previous all-time high of $4.8K.
However, following the breakthrough above the critical $4K resistance level, the price faced rejection, leading to a sharp decline aiming for the key support zones around $3.5K and $3.3K. Additionally, an expanding bearish divergence between the price and the RSI indicator suggests the potential for a notable market correction.
Nevertheless, it is important to recognize that healthy bullish markets often experience periods of consolidation correction, allowing the asset to rest and rebuild demand. Therefore, it seems likely that the price will find support in the medium term, continuing its overall upward trend.
On-chain Analysis
By Shayan
Ethereum’s price has surged rapidly in recent weeks, briefly surpassing its previous all-time high of $4,000. This surge has attracted numerous speculators to the market, driving up buying pressure and instilling confidence among investors.
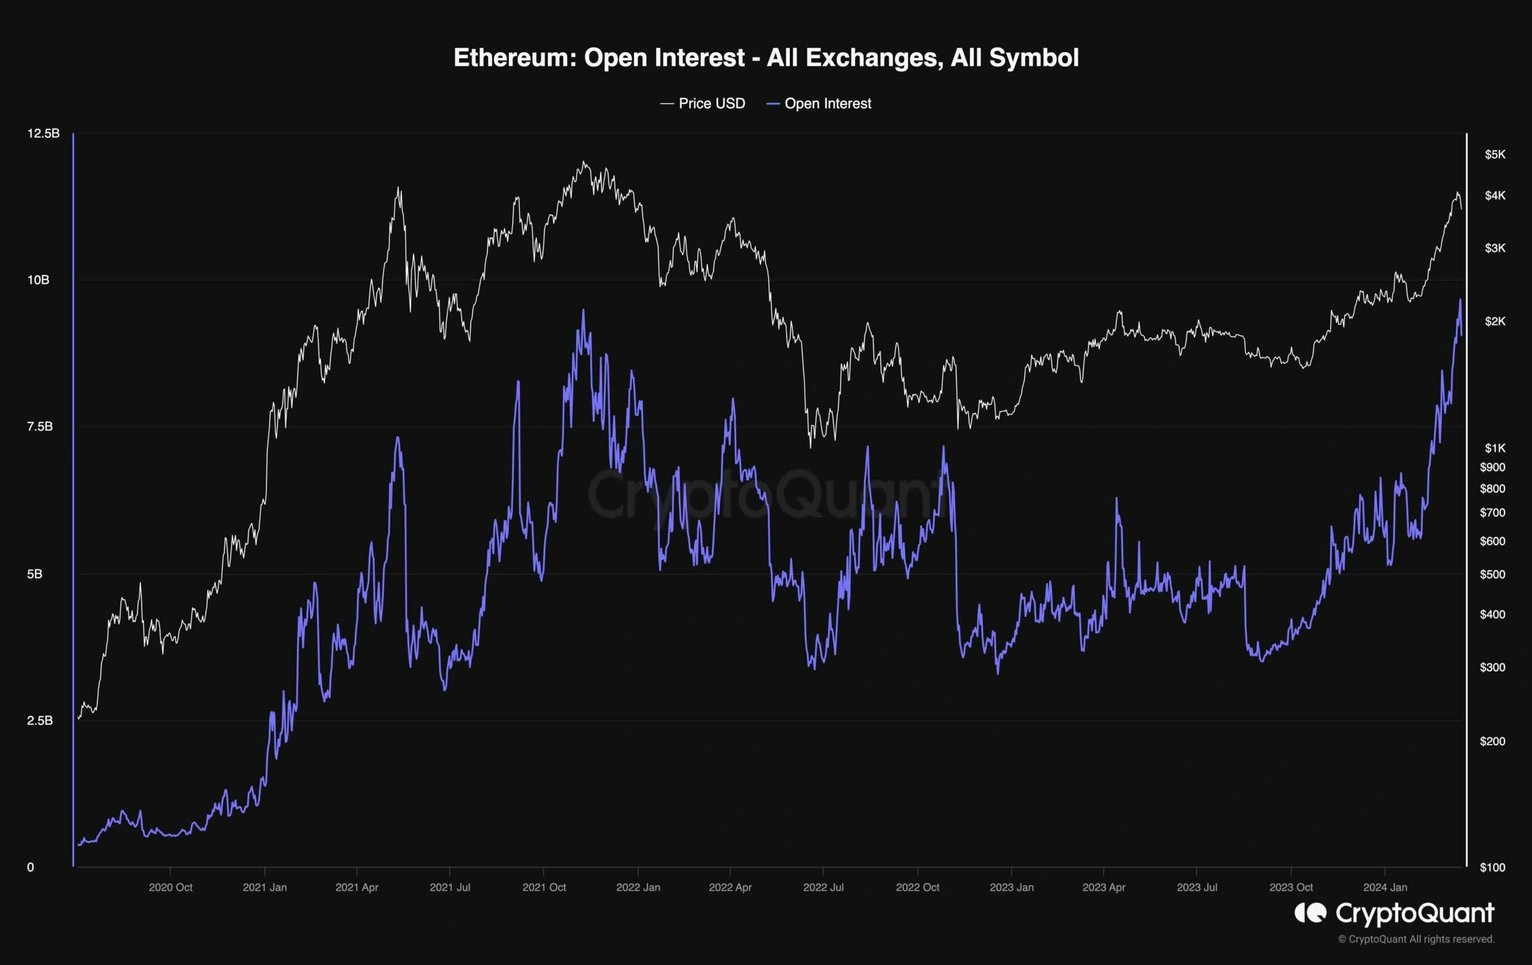
The accompanying chart illustrates the open interest, a valuable metric for assessing sentiment in the futures market. Open interest quantifies the number of outstanding perpetual futures contracts across various crypto exchanges.
It’s evident that the open interest has soared alongside the recent bullish trend, reaching unprecedented levels. This surge indicates the intensity of both long and short positions in the perpetual futures market, resulting in an overheated environment.
While elevated open interest is typical in a robust bull market, it can also contribute to heightened volatility and unexpected market corrections. As such, it’s prudent for investors to carefully manage their risk in the short term.
Disclaimer: The content of this article solely reflects the author's opinion and does not represent the platform in any capacity. This article is not intended to serve as a reference for making investment decisions.
You may also like
Trump presses the Federal Reserve to "cut rates to save the economy," but the market is betting on a 60% probability of a rate hike in September
Ahead of the Federal Reserve’s September monetary policy meeting (scheduled for September 15-16), U.S. President Trump and senior administration officials have made intensive statements, urging the central bank not to raise interest rates and even calling for a cut in the benchmark rate.

US energy stocks remain "cheap" after surging: High oil prices may lead to a valuation recovery
The Energy Select Sector SPDR ETF, which tracks US energy stocks, has surged over 43% year-to-date, far outperforming other S&P 500 sectors. Despite this, the energy sector remains one of the lowest-valued sectors within the S&P 500. High oil prices have led to excess profits for energy stocks; although Wall Street previously viewed this round of earnings growth as a temporary phenomenon, if elevated oil prices persist longer than expected, the valuation recovery of energy stocks may have only just begun.
Apple ties $119 Quest blood panel to new Health Age score
Besant brings Peashooter to tank battle, US Treasury repo hits a wall, 10-year US Treasury yield at three-year high
U.S. Treasury bonds are currently facing multiple pressures, including high oil prices intensifying inflation, rising expectations of Federal Reserve rate hikes, soaring fiscal deficits, and large-scale corporate bond issuances. At the same time, the $6 billion buyback scale has fallen short of market expectations. While Bessent had previously made lowering long-term yields a policy goal, on Tuesday he admitted that it's impossible to change the "equilibrium" price of government bonds. Analysts pointed out that buybacks cannot stop the fundamentals-driven yield trends, likening it to "the Treasury bringing a pea shooter to a tank battle."
Crypto prices
More


