
Polkadot Just Hit a Danger Zone!

Polkadot (DOT) has seen better days. Once hailed as a core layer-0 infrastructure token, its recent price action has left many traders on edge. As May 2025 unfolds, DOT is sitting at a critical support level after a multi-week consolidation and a sharp recent dip. With trading volume fluctuating and moving averages pointing downward, investors are asking : is DOT price preparing for a rebound , or will the support finally give way?
Polkadot Price Prediction: Current Price Action and Market Structure
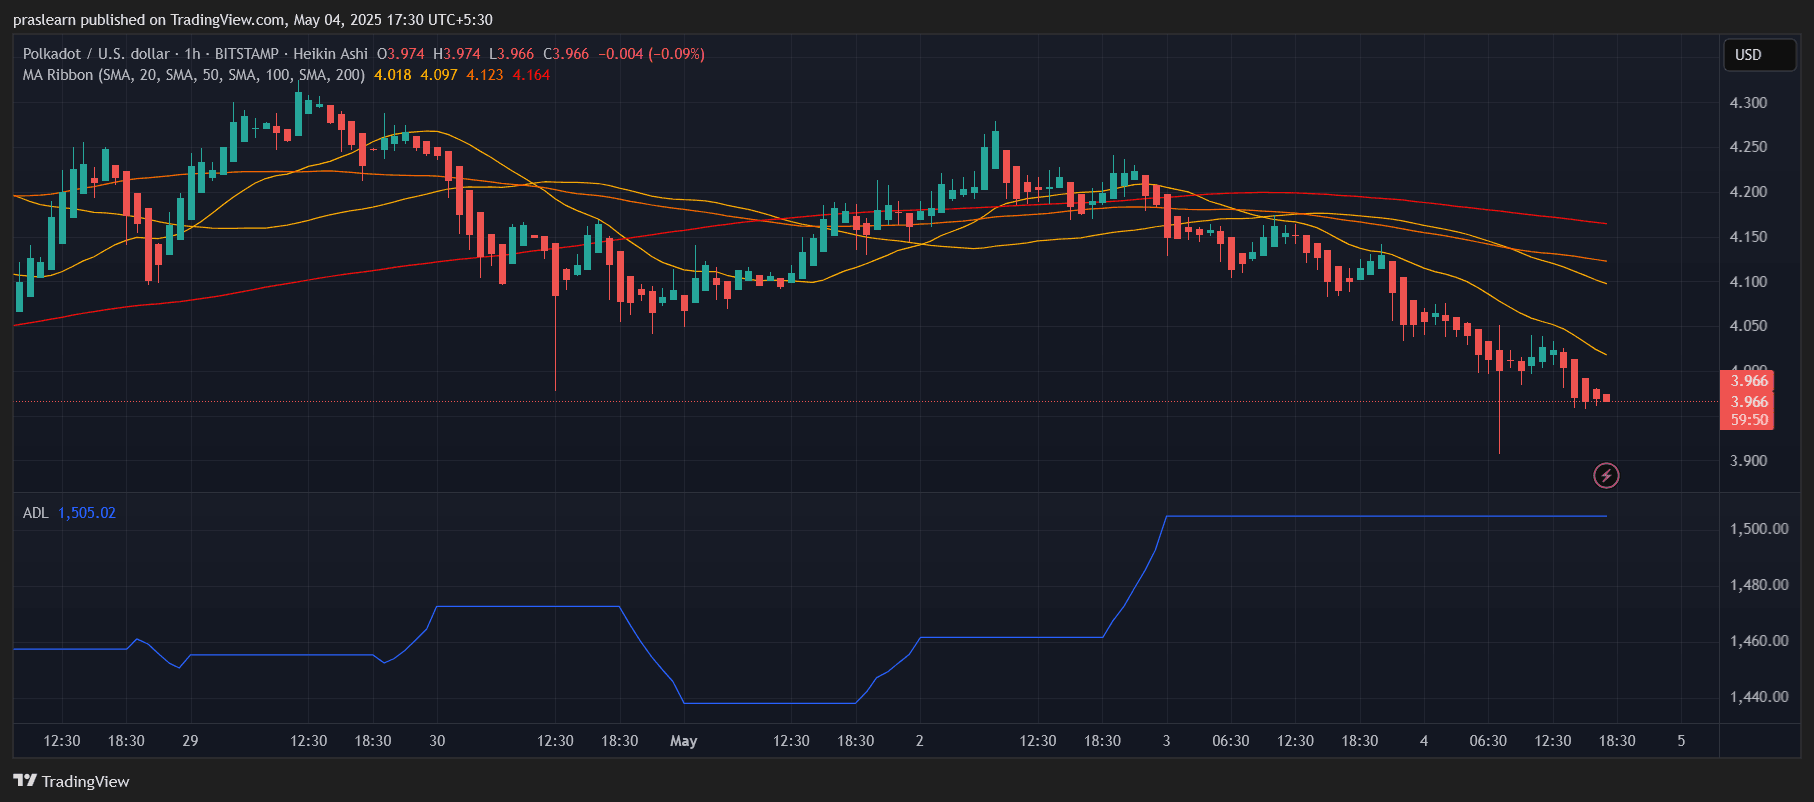 DOT/USD 1 Hr Chart- TradingView
As of the latest candle close, DOT is trading around $3.98 , with hourly charts revealing sustained selling pressure. The price has decisively broken below the short-term support range around $4.10, and has lost grip of all key short-term moving averages (20, 50, and 100 SMA). The hourly 200 SMA, which often acts as the final defense for bullish momentum, is well above the price at $4.16 — now serving as stiff resistance.
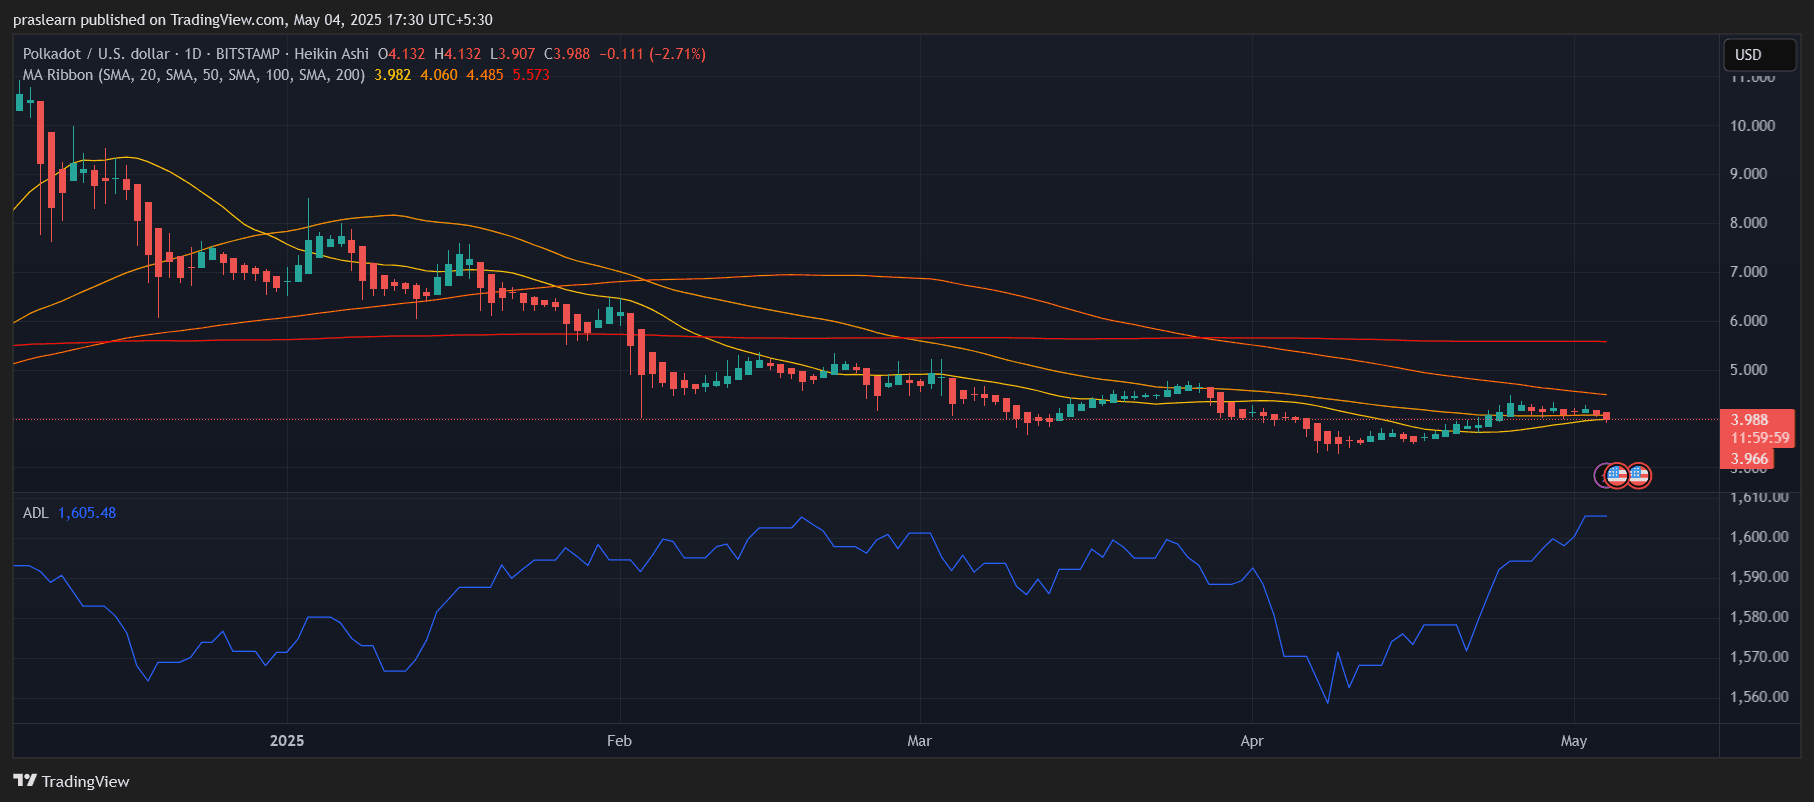 DOT/USD 1 Day Chart- TradingView
On the daily chart, DOT price rejection from the 100 SMA (currently at $4.48) capped the recent rally. The 50 SMA is currently positioned at $4.06, and the price is now sitting just below it. This confluence suggests a weakening bullish structure with an increasing risk of further decline if DOT closes a few more candles below $4.00.
Volume and ADL Analysis: Bearish Divergence
Looking at the Accumulation/Distribution Line (ADL), DOT shows a concerning pattern. Despite slight upticks in price during late April, the ADL failed to make a corresponding higher high. This divergence signals that smart money may be exiting positions during price relief rallies. On the hourly chart, the ADL continues its slow descent, confirming that bearish sentiment is currently stronger than what surface-level price action suggests.
Volume has also dried up, meaning there's little conviction from buyers to defend the $4 mark. Unless a catalyst emerges to spike demand, this stagnation may lead to a stronger downside move in the coming sessions.
Key Support and Resistance Levels
- Immediate Support: $3.90 — A psychological and technical level where price previously bounced.
- Next Major Support: $3.60 — The low from mid-April and a potential reversal zone if sellers accelerate.
- Immediate Resistance: $4.10 and $4.16 (20 and 200 SMA on hourly).
- Breakout Barrier: $4.50 — The level DOT must reclaim on the daily chart to resume a bullish trend.
Polkadot Price Prediction: Bounce or Breakdown?
The broader chart structure indicates that Polkadot price is at a decision point . If DOT price loses the $3.90 support with volume, it could swiftly drop to $3.60 or even test $3.30 — a level not seen since Q1 2023. However, if bulls manage to reclaim $4.10 and sustain above the 50 and 100 daily SMA, a short-term rally to $4.50 or even $5.00 becomes plausible, especially if the crypto market as a whole regains momentum.
Momentum indicators on lower timeframes hint at a possible oversold bounce, but without volume confirmation, any relief may be short-lived.
Polkadot Price May Outlook
May could be make-or-break for DOT price . The current technical landscape suggests caution, as Polkadot price is at risk of losing its footing. However, these conditions also often precede strong reversal rallies — if bulls show up. A decisive reclaim of $4.10 would flip the script in favor of buyers, while sustained weakness below $3.90 could open the floodgates for deeper losses.
Polkadot (DOT) has seen better days. Once hailed as a core layer-0 infrastructure token, its recent price action has left many traders on edge. As May 2025 unfolds, DOT is sitting at a critical support level after a multi-week consolidation and a sharp recent dip. With trading volume fluctuating and moving averages pointing downward, investors are asking : is DOT price preparing for a rebound , or will the support finally give way?
Polkadot Price Prediction: Current Price Action and Market Structure
DOT/USD 1 Hr Chart- TradingView
As of the latest candle close, DOT is trading around $3.98 , with hourly charts revealing sustained selling pressure. The price has decisively broken below the short-term support range around $4.10, and has lost grip of all key short-term moving averages (20, 50, and 100 SMA). The hourly 200 SMA, which often acts as the final defense for bullish momentum, is well above the price at $4.16 — now serving as stiff resistance.
DOT/USD 1 Day Chart- TradingView
On the daily chart, DOT price rejection from the 100 SMA (currently at $4.48) capped the recent rally. The 50 SMA is currently positioned at $4.06, and the price is now sitting just below it. This confluence suggests a weakening bullish structure with an increasing risk of further decline if DOT closes a few more candles below $4.00.
Volume and ADL Analysis: Bearish Divergence
Looking at the Accumulation/Distribution Line (ADL), DOT shows a concerning pattern. Despite slight upticks in price during late April, the ADL failed to make a corresponding higher high. This divergence signals that smart money may be exiting positions during price relief rallies. On the hourly chart, the ADL continues its slow descent, confirming that bearish sentiment is currently stronger than what surface-level price action suggests.
Volume has also dried up, meaning there's little conviction from buyers to defend the $4 mark. Unless a catalyst emerges to spike demand, this stagnation may lead to a stronger downside move in the coming sessions.
Key Support and Resistance Levels
- Immediate Support: $3.90 — A psychological and technical level where price previously bounced.
- Next Major Support: $3.60 — The low from mid-April and a potential reversal zone if sellers accelerate.
- Immediate Resistance: $4.10 and $4.16 (20 and 200 SMA on hourly).
- Breakout Barrier: $4.50 — The level DOT must reclaim on the daily chart to resume a bullish trend.
Polkadot Price Prediction: Bounce or Breakdown?
The broader chart structure indicates that Polkadot price is at a decision point . If DOT price loses the $3.90 support with volume, it could swiftly drop to $3.60 or even test $3.30 — a level not seen since Q1 2023. However, if bulls manage to reclaim $4.10 and sustain above the 50 and 100 daily SMA, a short-term rally to $4.50 or even $5.00 becomes plausible, especially if the crypto market as a whole regains momentum.
Momentum indicators on lower timeframes hint at a possible oversold bounce, but without volume confirmation, any relief may be short-lived.
Polkadot Price May Outlook
May could be make-or-break for DOT price . The current technical landscape suggests caution, as Polkadot price is at risk of losing its footing. However, these conditions also often precede strong reversal rallies — if bulls show up. A decisive reclaim of $4.10 would flip the script in favor of buyers, while sustained weakness below $3.90 could open the floodgates for deeper losses.
Disclaimer: The content of this article solely reflects the author's opinion and does not represent the platform in any capacity. This article is not intended to serve as a reference for making investment decisions.
You may also like
Median survival prolonged by 5.7 months! Roche (RHHBY.US) lung cancer new drug wins in head-to-head trial, major catalyst for oncology business
Roche's investigational lung cancer drug divarasib extended patient survival by nearly six months compared to competing therapies in a late-stage clinical trial, promising to further strengthen the Swiss pharmaceutical company's oncology portfolio.
Global Aging Reshapes Equity and Bond Investment Logic? Pension "Longevity Bill" Accelerates Accumulation, Equities, Bonds, and Private Equity Welcome Massive Long-term Capital
As people live longer and birth rates decline, pension funds are required to allocate their assets for retirement periods that can last decades. Meanwhile, the number of workers contributing to these systems is decreasing.
Japanese Yen holds near one-month top vs weak USD as traders await Fed, BoJ meetings

Dimon Sounds the "Fivefold Alarm"! Facing Massive Fiscal Deficits and High Interest Rates, Are Coca-Cola-Like "Cash Cows" Evergreen?
The core of Dimon's warning is that while the US economy continues to expand, the cost investors must pay to maintain growth and take on risk is increasing.

Crypto prices
More


