Bitget App
Trade smarter
Buy cryptoMarketsTradeFuturesStocksEarnInstitutionAI & More
Is Bonk (BONK) Poised for More Gains? This Emerging Pattern Hints at an Upside Move

Is Bonk (BONK) Poised for More Gains? This Emerging Pattern Hints at an Upside Move

CoinsProbeCoinsProbe2025/05/07 03:11
By:Nilesh Hembade

Date: Tue, May 06, 2025 | 07:50 AM GMT

The cryptocurrency market has seen a much-needed relief rally over the past couple of weeks following a rocky start to 2025. Ethereum (ETH), for instance, plummeted nearly 45% in Q1 but has since bounced back with a strong 30% recovery from its April 9 low. This optimism is now rippling across the market — and Bonk (BONK), the Solana-based memecoin, is catching traders’ attention.

BONK has surged by an impressive 5+% over the last 30 days, and current technicals suggest the rally may not be over just yet.

Is Bonk (BONK) Poised for More Gains? This Emerging Pattern Hints at an Upside Move image 0 Source: Coinmarketcap

Power of 3 in Play?

Zooming into BONK’s 4-hour chart, a classic “Power of 3” setup appears to be unfolding — a pattern known for cycling through accumulation, manipulation, and expansion phases.
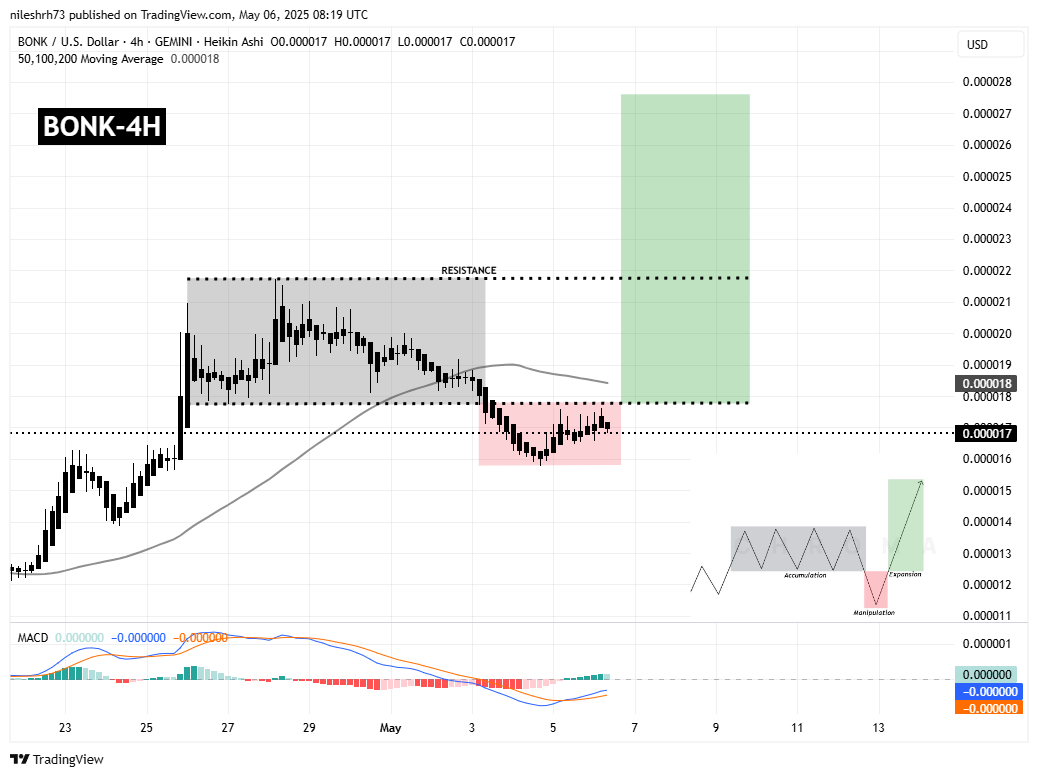
Is Bonk (BONK) Poised for More Gains? This Emerging Pattern Hints at an Upside Move image 1 BONK 4H Chart/Coinsprobe (Source: Tradingview)
  • Accumulation Phase: From April 26 to May 3, BONK moved sideways within a tight range, showing typical signs of accumulation as traders built positions.
  • Manipulation Phase: Since May 4, the price dipped below support, likely triggering stop-losses and shaking out retail traders — a hallmark of the manipulation phase. This “fake-out” is often a precursor to a bigger move.

Currently, BONK is challenging the key resistance level at $0.000018, which marks the low of the previous accumulation zone. A successful breakout above this level would confirm a transition into the expansion phase.

The next target would be $0.000022 — the high of the previous accumulation range. If BONK manages to close above that, the chart hints at a strong upward move toward $0.000028, representing a potential 27% upside from the breakout point.

The MACD on the 4H chart is starting to flip bullish, with the MACD line looking to cross above the signal line — often a reliable indicator of building buying momentum. BONK is also testing the 50-period moving average, which could act as a launchpad if broken with volume.

Final Thoughts

BONK’s technical setup is aligning with a potential breakout scenario, especially if the Power of 3 pattern fully plays out. Combined with a recovering market backdrop, the memecoin might be ready to post fresh gains.

Still, as with any crypto play — especially memecoins — volatility can cut both ways. The expansion phase remains unconfirmed until BONK decisively clears resistance.

Disclaimer: This article is for informational purposes only and does not constitute financial advice. Always do your own research before investing in cryptocurrencies.


0
0

Disclaimer: The content of this article solely reflects the author's opinion and does not represent the platform in any capacity. This article is not intended to serve as a reference for making investment decisions.

Understand the market, then trade.
Bitget offers one-stop trading for cryptocurrencies, stocks, and gold.
Trade now!

You may also like

Nebius (NBIS.US) CEO admits new cloud company financing is becoming difficult; Musk warns “major reshuffling,” intensifying market concerns

Volorozh admitted that it is becoming increasingly difficult for Neocloud to obtain debt financing.

智通财经•2026/10/26 08:16
Nebius (NBIS.US) CEO admits new cloud company financing is becoming difficult; Musk warns “major reshuffling,” intensifying market concerns

The market is "shivering"! As "capital expenditure" becomes highly sensitive, the three US cloud giants will all release their earnings reports this week.

Google, Microsoft, and Amazon are all expected to report strong quarterly results, with revenue growth likely reaching double digits. However, what investors are truly focused on is the scale of capital expenditures and the trend of free cash flow. If expectations for free cash flow are downgraded again, concerns about the sustainability of AI spending will intensify and spread to the cloud computing sector. If there is a positive revision, the market will consider the most challenging phase of the spending cycle to be over.

华尔街见闻•2026/10/26 08:12
The market is "shivering"! As "capital expenditure" becomes highly sensitive, the three US cloud giants will all release their earnings reports this week.

PE only 3x, valuation has dropped to financial crisis levels! With Samsung and SK Hynix earnings reports approaching, can they reverse the downward trend in stock prices?

Samsung Electronics and SK Hynix are facing an extreme divergence of "record-breaking profits and rock-bottom valuations," with their price-earnings ratios dropping to around 3x and foreign ownership at historic lows. Institutions believe the market is overly pessimistic, as significant profit growth for both companies over the next two years is largely secured. With this week's earnings reports, the market is focusing on management's statements regarding long-term supply outlooks and shareholder returns, in hopes that these will serve as catalysts for a revaluation of their stock prices.

华尔街见闻•2026/10/26 07:31
PE only 3x, valuation has dropped to financial crisis levels! With Samsung and SK Hynix earnings reports approaching, can they reverse the downward trend in stock prices?