Date: Tue, May 13, 2025 | 09:10 AM GMT
The cryptocurrency market continues to build on its recent strength, with Ethereum (ETH) leading the charge. ETH has climbed more than 51% over the past month and is now trading near the $2,450 mark — its highest level in months. This resurgence is also helping to lift sentiment across major altcoins , including Hyperliquid (HYPE).
HYPE, the native token of Hyperliquid’s decentralized exchange, has posted an impressive 54% monthly gain — and now a technical pattern is hinting that another leg up might be just around the corner.
 Source: Coinmarketcap
Elliott Wave Impulse Pattern Signals More Upside
On the 4-hour timeframe, HYPE is showing a classic 5-wave Elliott impulse structure in progress and has already rallied by 46%. The current wave count suggests that after pulling back from the Wave C high of $26.56, Wave D has likely completed near the $23.32 level — and now Wave E could be gearing up for another strong move to the upside.
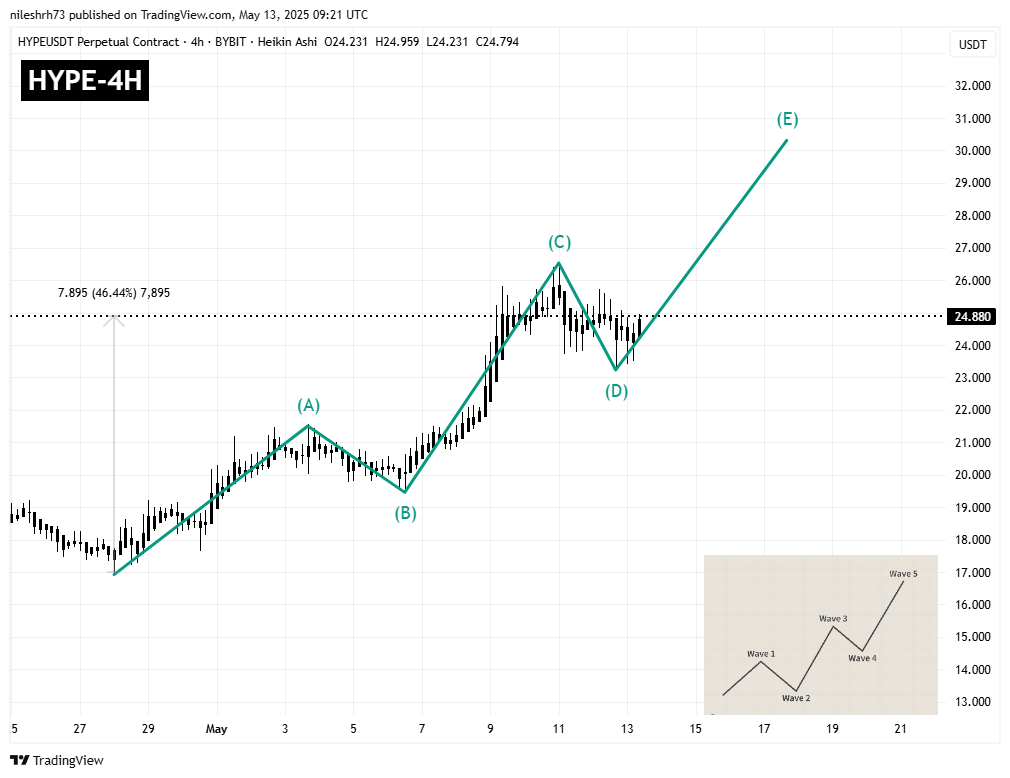 Hyperliquid (HYPE) 4H Chart/Coinsprobe (Source: Tradingview)
This pullback appears healthy and sets the stage for Wave E — the potential final push in this upward cycle. If the current wave count holds, Wave E could launch HYPE toward the $30–$31 region, representing another 21% gain from current price levels near $24.88.
This projection also aligns with a 1.0 Fibonacci extension level taken from the B-C-D wave sequence — a common extension target for Wave E in Elliott Wave theory.
The pattern, combined with the strong market sentiment and bullish structure, suggests HYPE may still have room to run — especially if it breaks above the $26.56 resistance area with strong volume.
As shown in the chart, the final wave (E) could complete the 5-wave cycle, which often leads to either a larger correction or a consolidation phase. Until then, traders may want to keep an eye on the $30.31 level as a potential near-term target.
Disclaimer: This article is for informational purposes only and not financial advice. Always conduct your own research before investing in cryptocurrencies.