
Solana (SOL) Momentum Slows – Is $200 Still in Sight?

Solana dominates DEX activity and app revenue, but technical indicators point to slowing momentum and a possible consolidation period.
Solana (SOL) is up 28.4% over the past month, but its momentum has slowed. After briefly touching $184, it has gained just 0.78% in the last seven days. Despite this, Solana continues to dominate DEX metrics, leading all chains with $27.9 billion in weekly volume.
The broader ecosystem remains active, with multiple Solana-based apps among the top fee generators. However, technical indicators such as RSI, Ichimoku Cloud, and EMA lines suggest the rally may be losing steam, signaling a potential period of consolidation or correction ahead.
Solana Leads DEX Market With $27.9 Billion Weekly Volume and Surging App Activity
Solana continues to assert its dominance in the decentralized exchange (DEX) ecosystem, leading all chains in trading volume for the fourth consecutive week.
Over the past seven days alone, Solana recorded $27.9 billion in DEX volume—surpassing BNB Chain, Ethereum, Base, and Arbitrum.
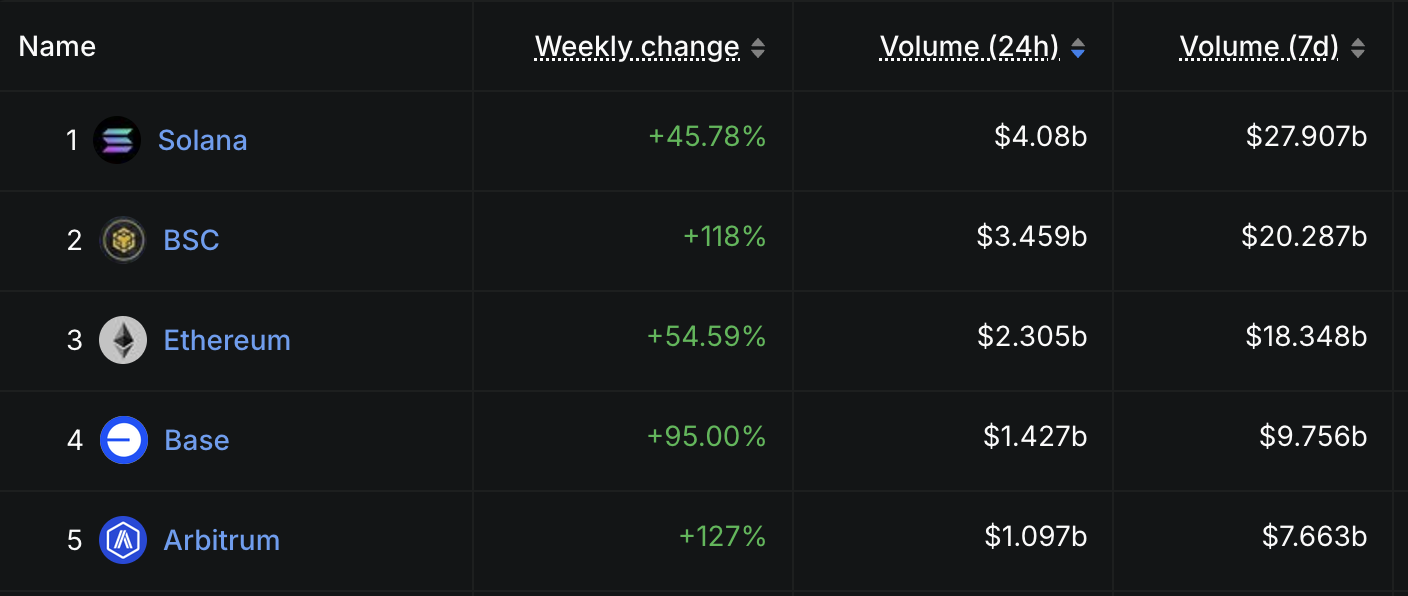 Top Chains by DEX Volume. Source:
DeFiLlama.
The weekly DEX volume for Solana surged by 45.78%, signaling a strong resurgence in on-chain activity after decreasing activity between March and April.
This rise is a spike and part of a broader trend, with volumes consistently staying above the $20 billion mark over the past month.
 Top Apps and Chains by Fees and Revenue. Source:
DeFiLlama.
Adding to its momentum, Solana is home to four of the past week’s ten highest fee-generating apps and chains. This includes familiar platforms and newcomers, showing a healthy diversity in the ecosystem.
Believe App, a newly launched Solana-based launchpad, stands out in the recent surge. In the last 24 hours alone, it generated $3.68 million in fees—surpassing well-established platforms like PancakeSwap, Uniswap, and Tron.
Momentum Cools for SOL as Indicators Turn Neutral
Solana’s Relative Strength Index (RSI) has dropped to 51.99, down from 66.5 just three days ago, signaling a clear loss of bullish momentum.
Over the past few days, the RSI has hovered between 44 and 50, reflecting a more neutral market sentiment after previously nearing overbought conditions.
This shift suggests that traders are more cautious, and recent gains may be cooling off.
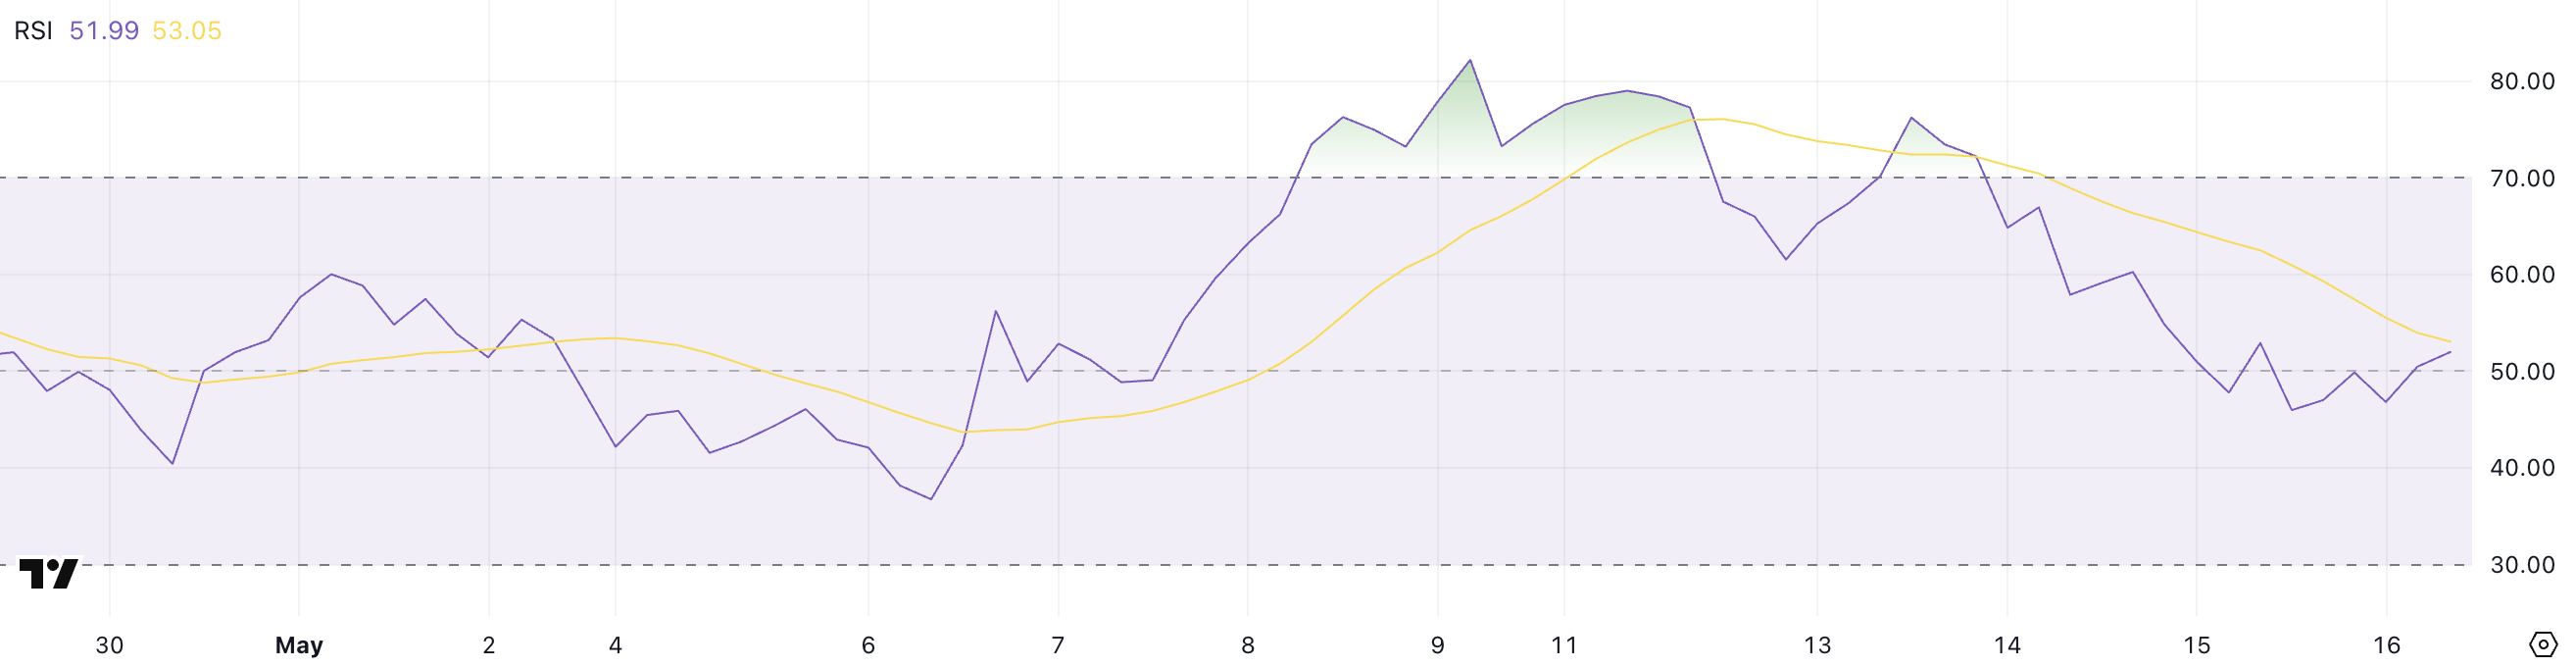 SOL RSI. Source:
TradingView.
The RSI is a momentum indicator that ranges from 0 to 100, with values above 70 indicating overbought conditions and below 30 signaling oversold territory. At 51.99, Solana sits in the neutral zone, which typically suggests a period of consolidation or indecision.
If the RSI rises above 60 again, it could point to renewed bullish strength; if it dips below 45, further downside pressure may follow.
Solana’s Ichimoku Cloud chart shows a period of consolidation following a strong uptrend, with key signals now suggesting indecision.
The price is hovering near the Kijun-sen (red line) and Tenkan-sen (blue line), both of which have started to flatten—indicating a slowdown in momentum.
The Chikou Span (green lagging line) remains above the candles, suggesting that the broader trend still has a bullish bias. However, the lack of distance between it and the current price action reflects weakening strength.
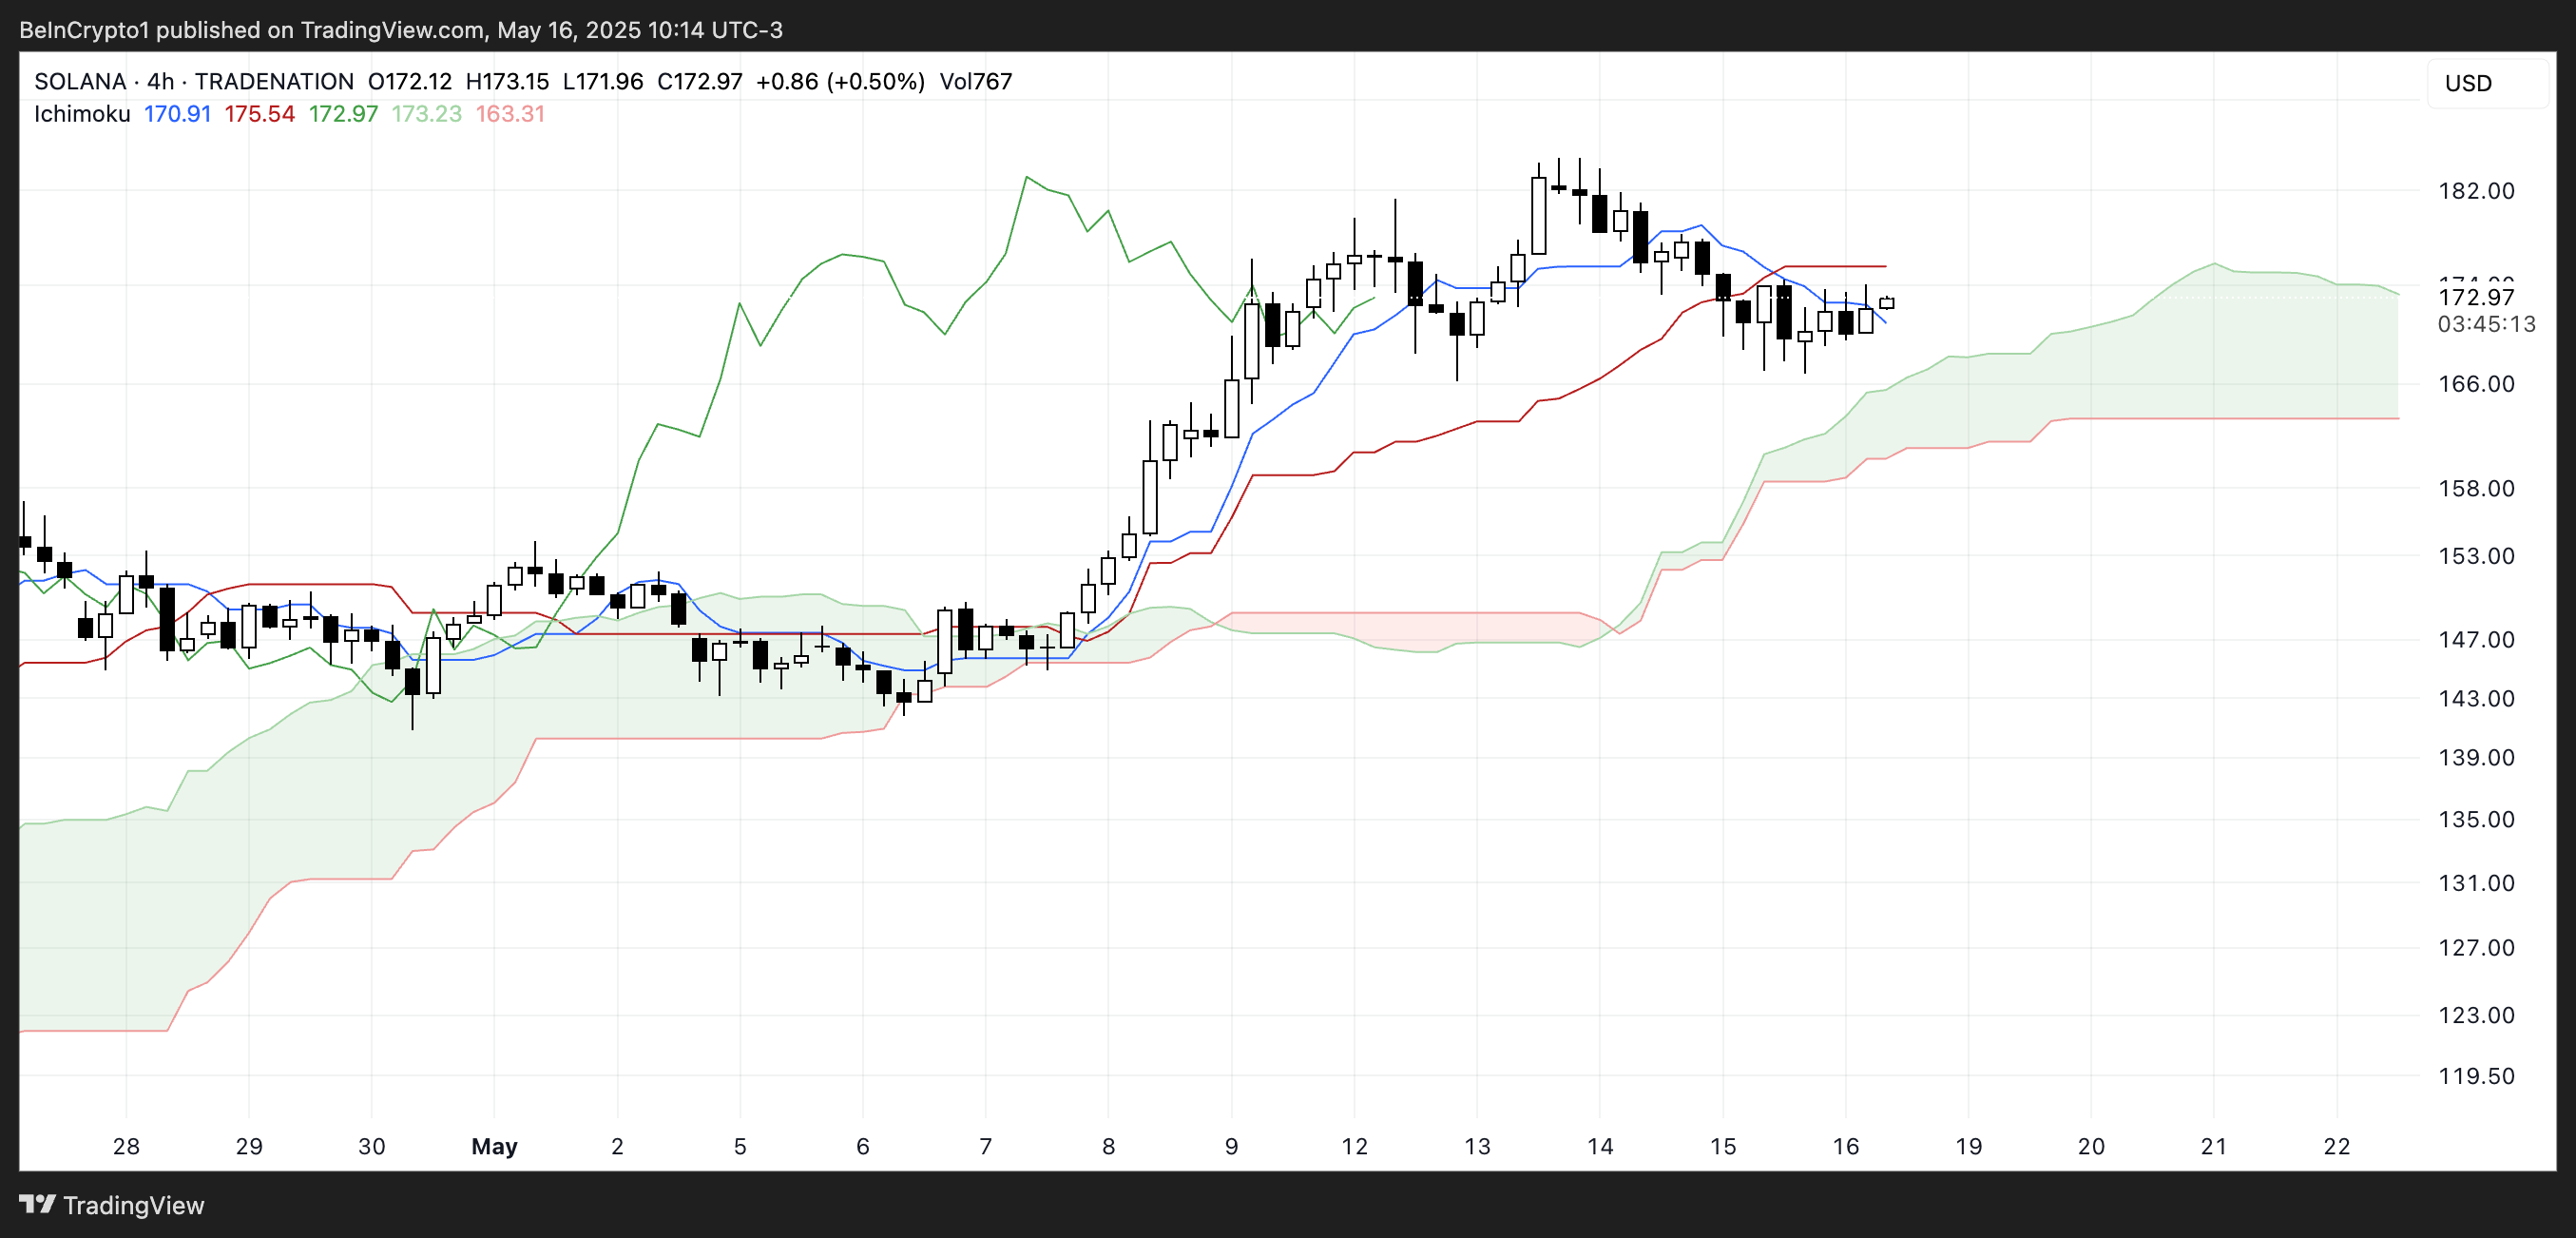 SOL Ichimoku Cloud. Source:
TradingView.
The Kumo Cloud (green and red shaded area) ahead is still bullish, with the leading span lines spread apart, providing support beneath the current price.
However, with candles now closely interacting with the Kijun-sen and failing to strongly break above the Tenkan-sen, the short-term sentiment appears cautious.
If the price can push decisively above the blue line, momentum may return, but any drift into the cloud could signal the start of a more prolonged consolidation phase or potential trend reversal.
Solana’s Bullish EMA Structure Faces Momentum Slowdown
Solana’s EMA lines remain bullish, with the short-term moving averages positioned above the longer-term ones. However, the gap between these lines is narrowing, suggesting that upward momentum is weakening.
Solana price recently failed to break past a key resistance level, and although a retest could open the path toward reclaiming the $200 zone, the lack of strong follow-through raises questions about the trend’s strength.
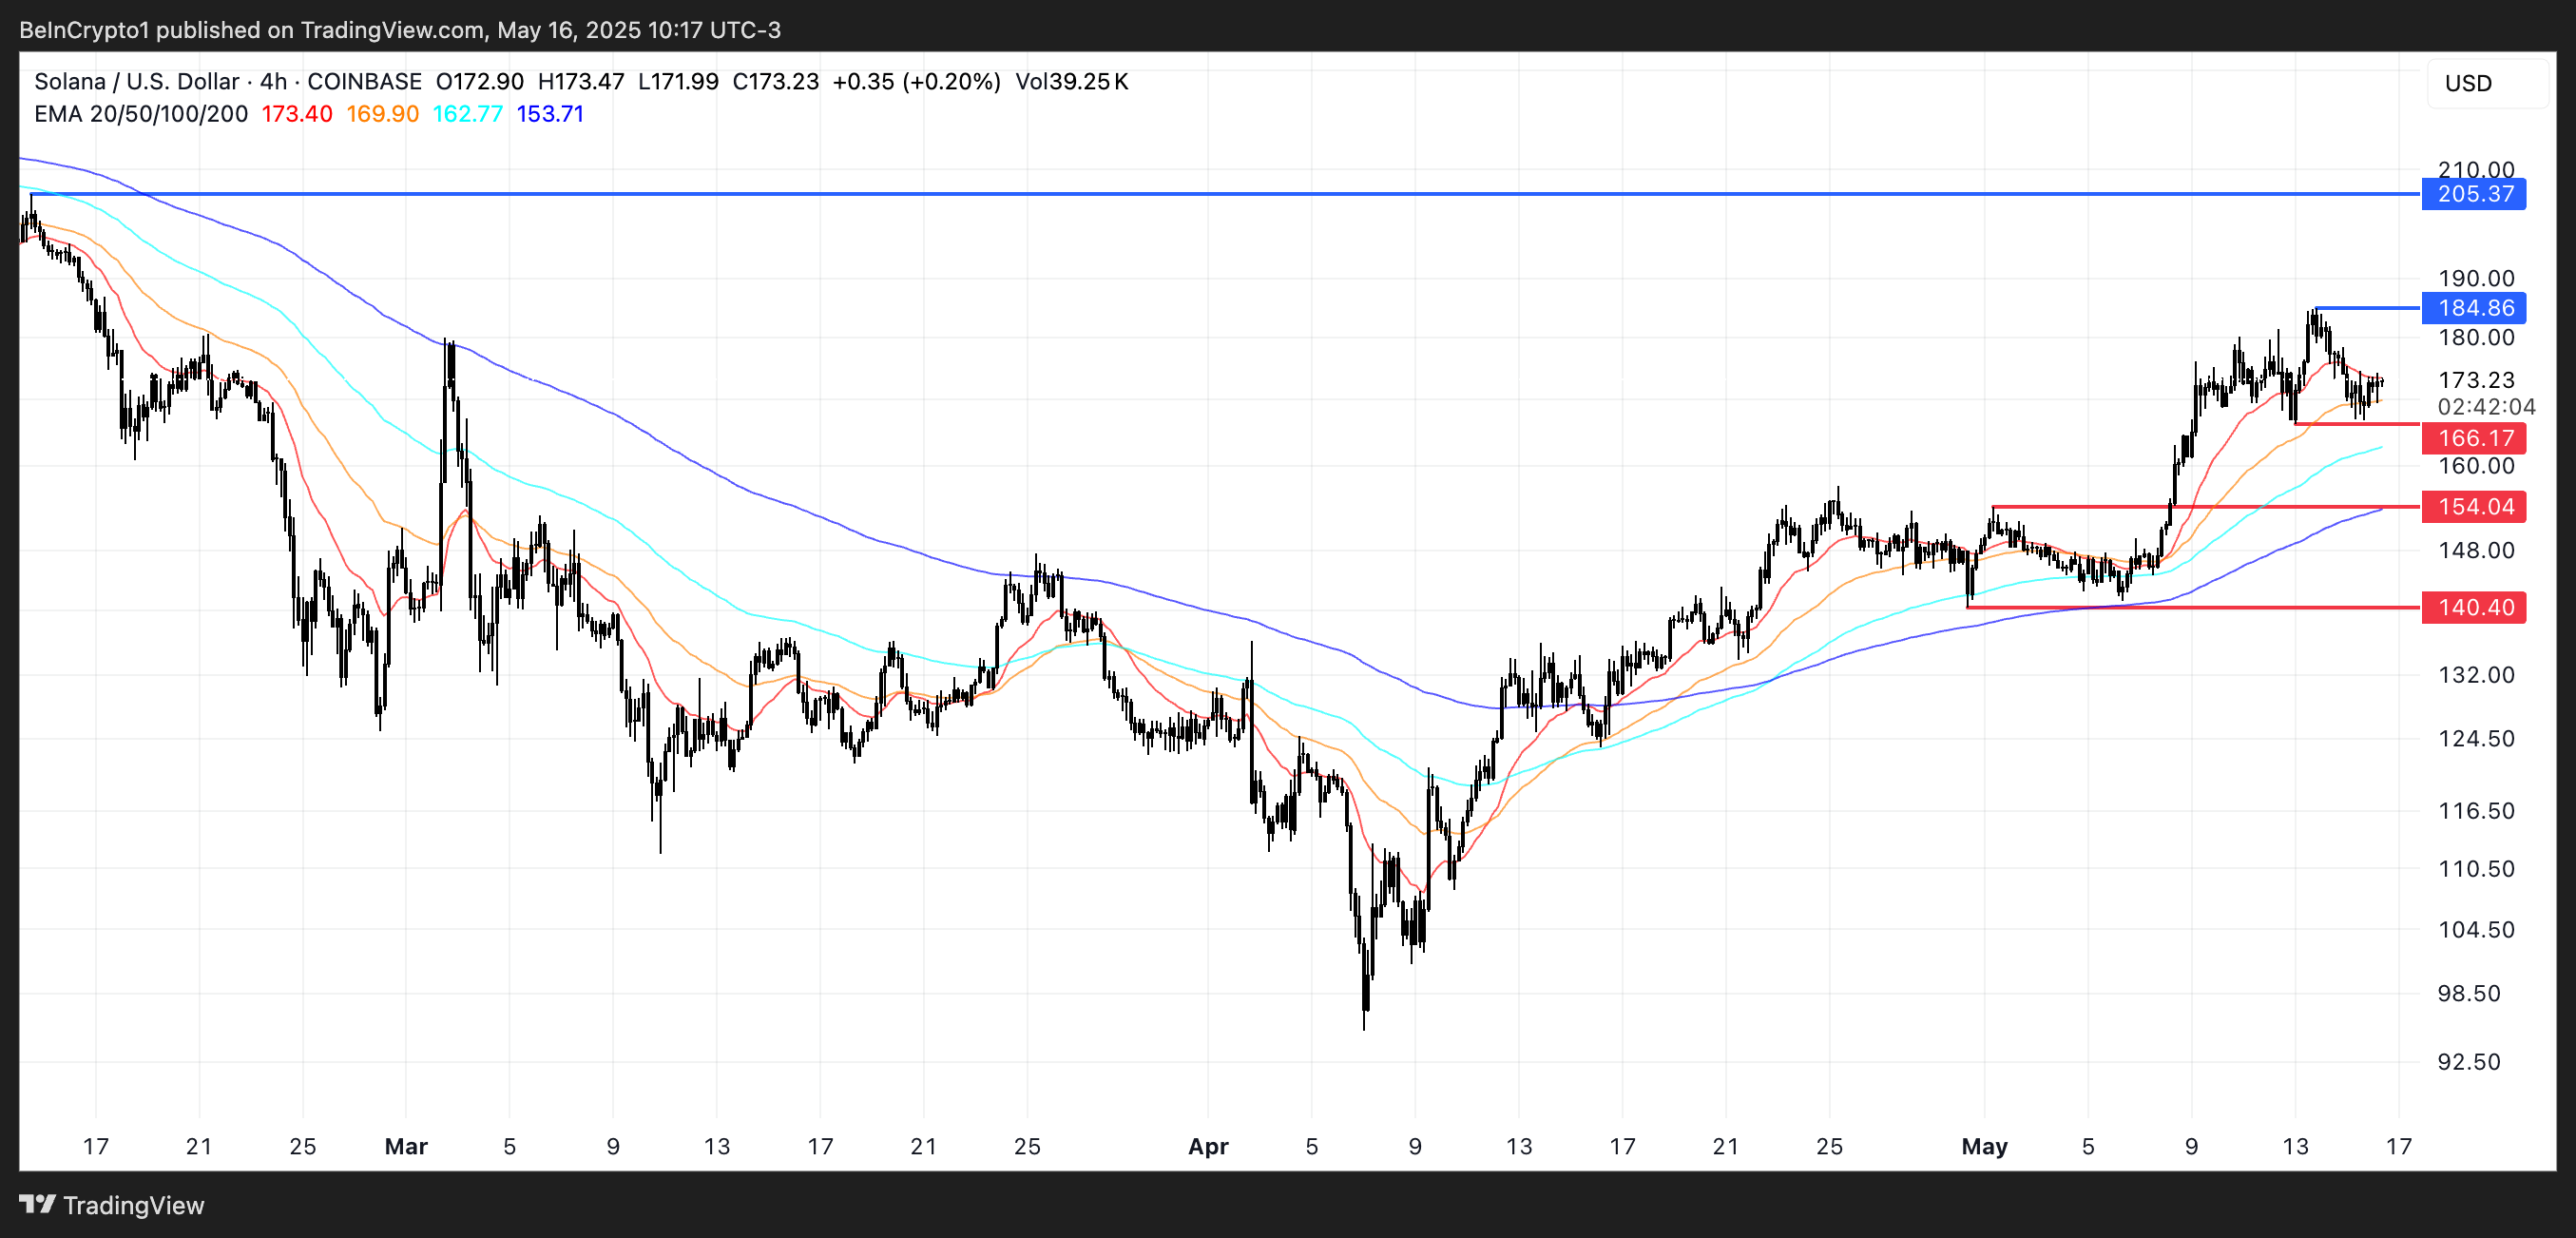 SOL Price Analysis. Source:
TradingView.
Complementing this cautious outlook, the Ichimoku Cloud and RSI indicators point to a potential cooldown. Solana recently held above an important support level but remains vulnerable—if that support breaks, further downside could follow.
The broader structure still leans bullish, but the market appears to be at a crossroads. The next move likely depends on whether buyers can reclaim initiative or sellers push through key lower levels.
Disclaimer: The content of this article solely reflects the author's opinion and does not represent the platform in any capacity. This article is not intended to serve as a reference for making investment decisions.
You may also like
Nebius (NBIS.US) CEO admits new cloud company financing is becoming difficult; Musk warns “major reshuffling,” intensifying market concerns
Volorozh admitted that it is becoming increasingly difficult for Neocloud to obtain debt financing.

The market is "shivering"! As "capital expenditure" becomes highly sensitive, the three US cloud giants will all release their earnings reports this week.
Google, Microsoft, and Amazon are all expected to report strong quarterly results, with revenue growth likely reaching double digits. However, what investors are truly focused on is the scale of capital expenditures and the trend of free cash flow. If expectations for free cash flow are downgraded again, concerns about the sustainability of AI spending will intensify and spread to the cloud computing sector. If there is a positive revision, the market will consider the most challenging phase of the spending cycle to be over.

PE only 3x, valuation has dropped to financial crisis levels! With Samsung and SK Hynix earnings reports approaching, can they reverse the downward trend in stock prices?
Samsung Electronics and SK Hynix are facing an extreme divergence of "record-breaking profits and rock-bottom valuations," with their price-earnings ratios dropping to around 3x and foreign ownership at historic lows. Institutions believe the market is overly pessimistic, as significant profit growth for both companies over the next two years is largely secured. With this week's earnings reports, the market is focusing on management's statements regarding long-term supply outlooks and shareholder returns, in hopes that these will serve as catalysts for a revaluation of their stock prices.

A Perfect Storm for Bitcoin? Fed, PCE, GDP and Big Tech Earnings Ahead

Crypto prices
More


