
PI Plummets 50% in a Week; Why Traders Should Brace for More Downside

PI has sharply declined, facing strong selling pressure and resistance near the 20-day EMA. Indicators hint at continued weakness or a possible short-term bounce.
PI has shed half its value over the past seven days, signaling deepening bearish sentiment among its holders. At the time of writing, the altcoin trades at $0.72, marking a steep decline from last week’s price high of $1.67.
Technical indicators suggest that the downtrend may not be over as selling pressure remains significant.
PI Faces Heavy Selling Pressure
PI’s BBTrend remains in the red on the daily chart, confirming that bearish forces are firmly in control. Observed on a one-day chart, the indicator is currently at -19.36.
 PI BBTrend. Source:
TradingView
The BBTrend measures the strength and direction of a trend based on the expansion and contraction of Bollinger Bands. When BBTrend values are positive, it signals a strong uptrend, while negative values indicate increasing bearish momentum.
PI’s negative BBTrend suggests that its price consistently closes near the lower Bollinger Band, reflecting sustained selling pressure and hinting at the potential for further downside.
Furthermore, the token’s Elder-Ray Index supports this bearish outlook. At press time, the indicator returns a negative value of -0.12.
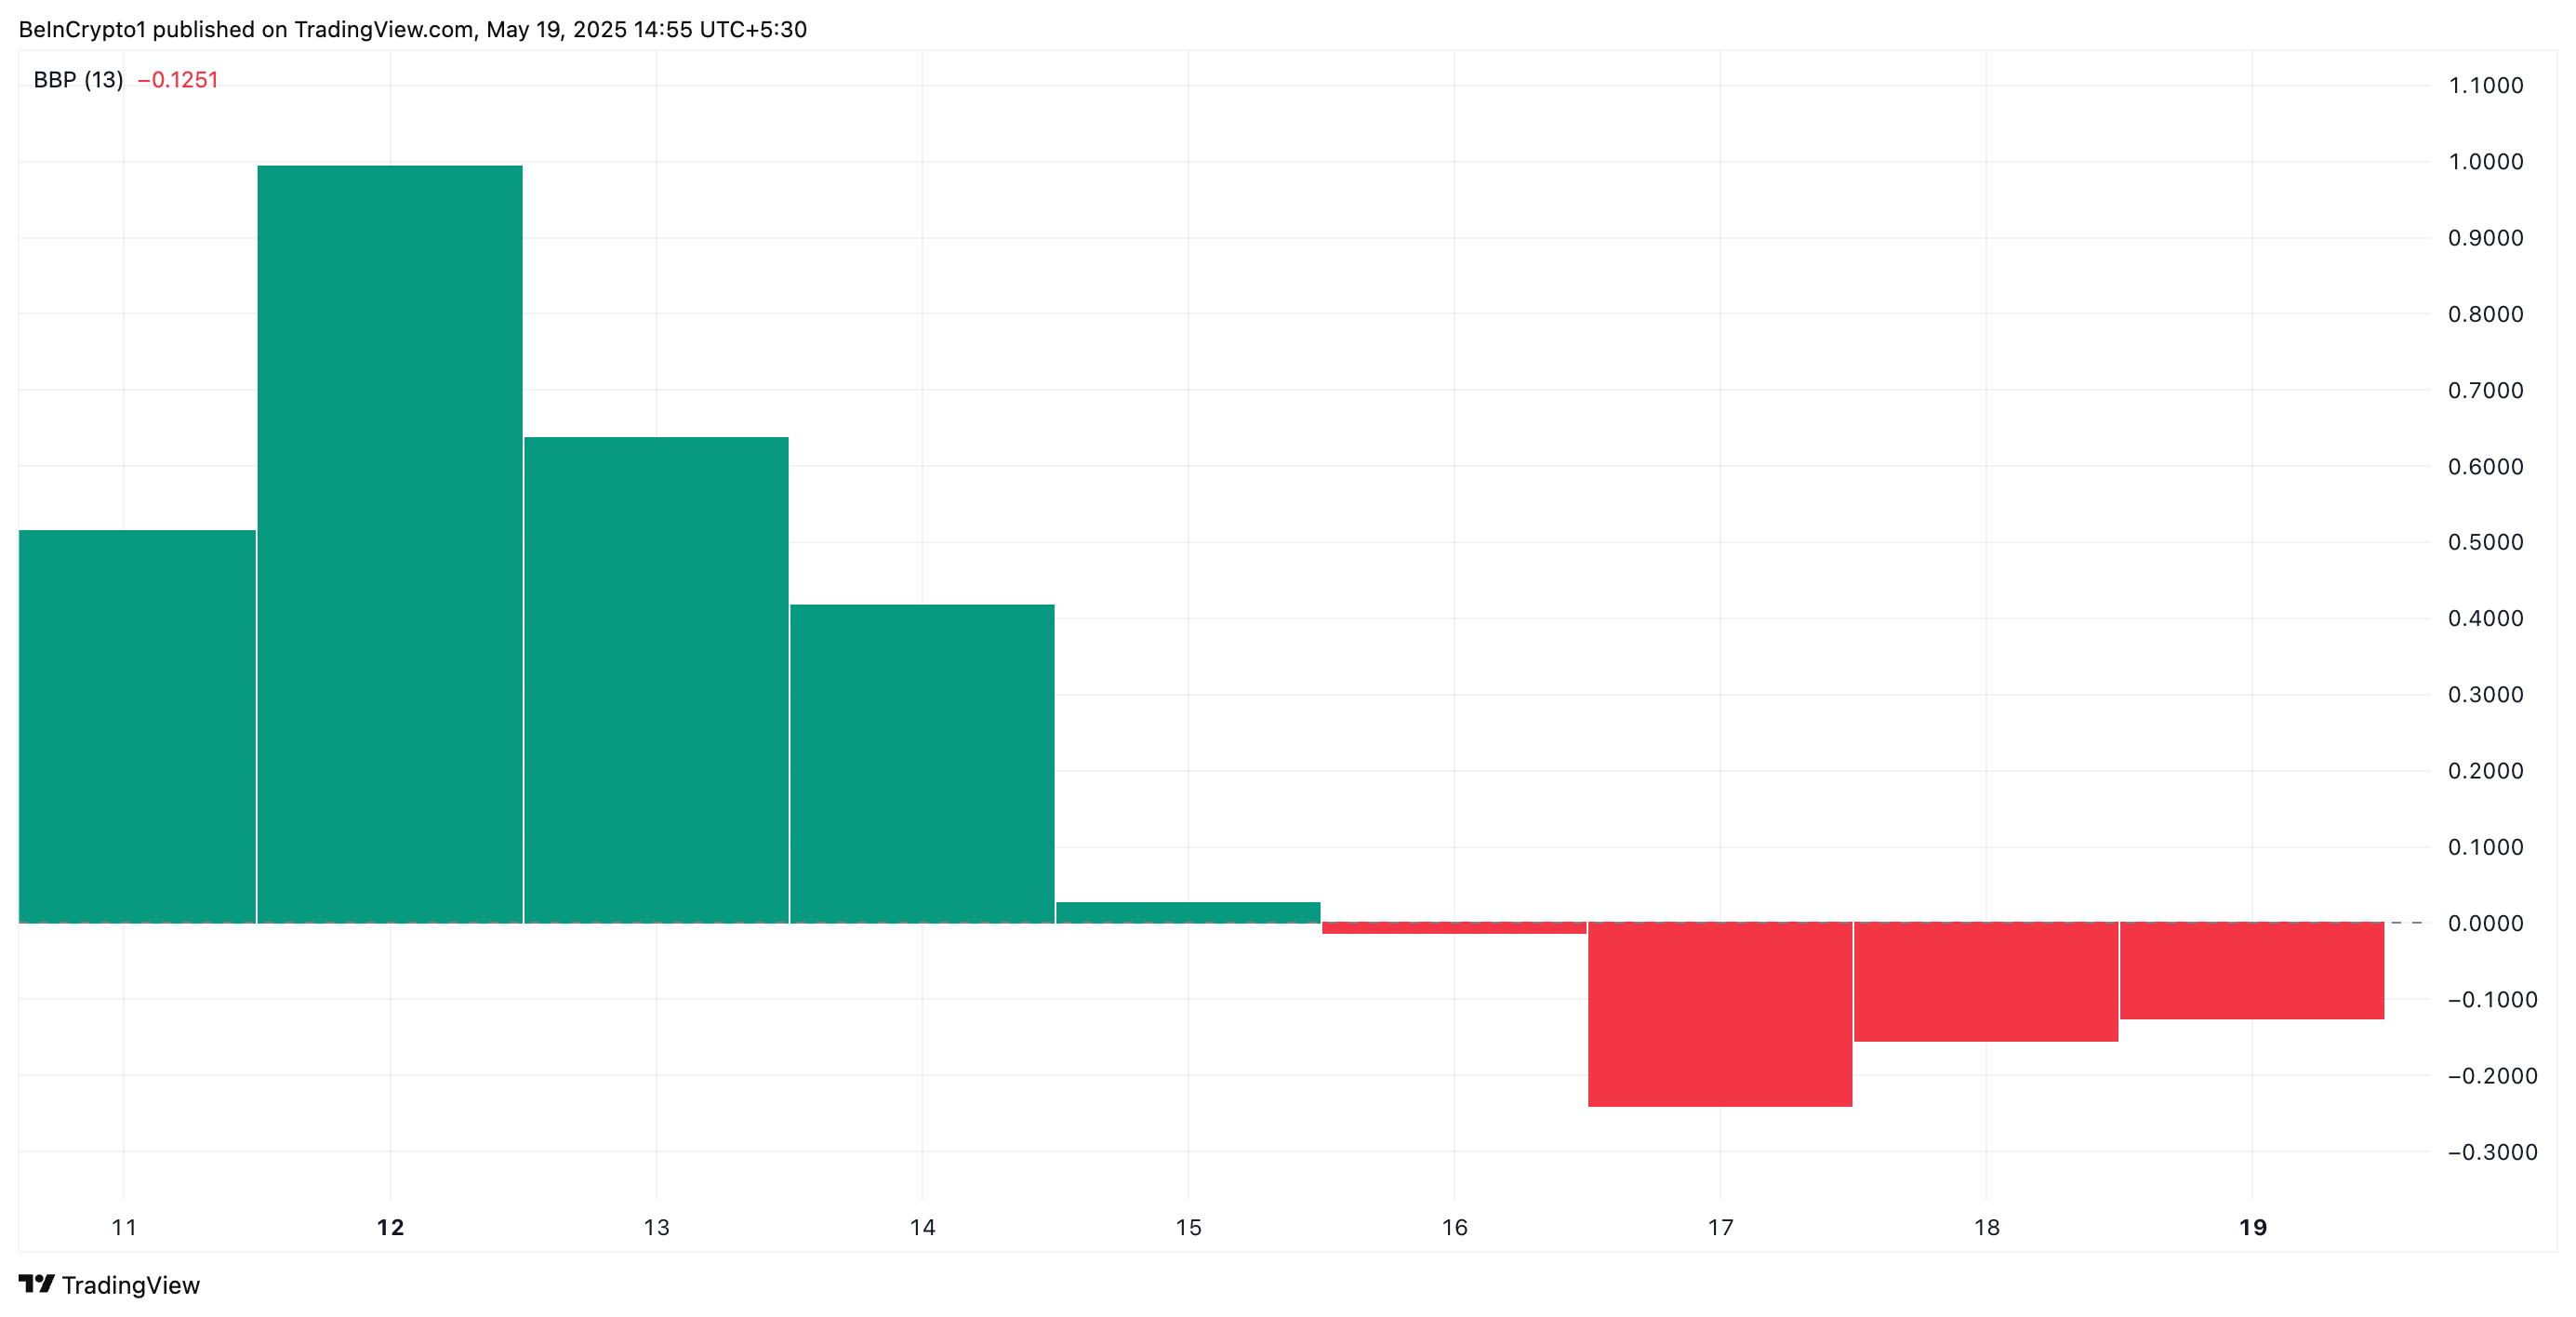 PI Elder-Ray Index. Source:
TradingView
The Elder Ray Index measures the strength of buying and selling pressure in the market, using two key components: Bull Power and Bear Power.
When the index is negative, sellers dominate the market. This signals a bearish trend and hints at a continued downward momentum for PI.
Resistance at 20-Day EMA Caps Recovery Hopes
The PI token trades below its 20-day exponential moving average (EMA), which forms dynamic resistance above it. The 20-day EMA measures an asset’s average price over the past 20 trading days, giving more weight to recent prices.
When an asset trades below its 20-day EMA, recent price action is weaker than the short-term trend. This is a bearish signal indicating a lack of buying momentum.
If the trend continues, PI could fall to $0.55.
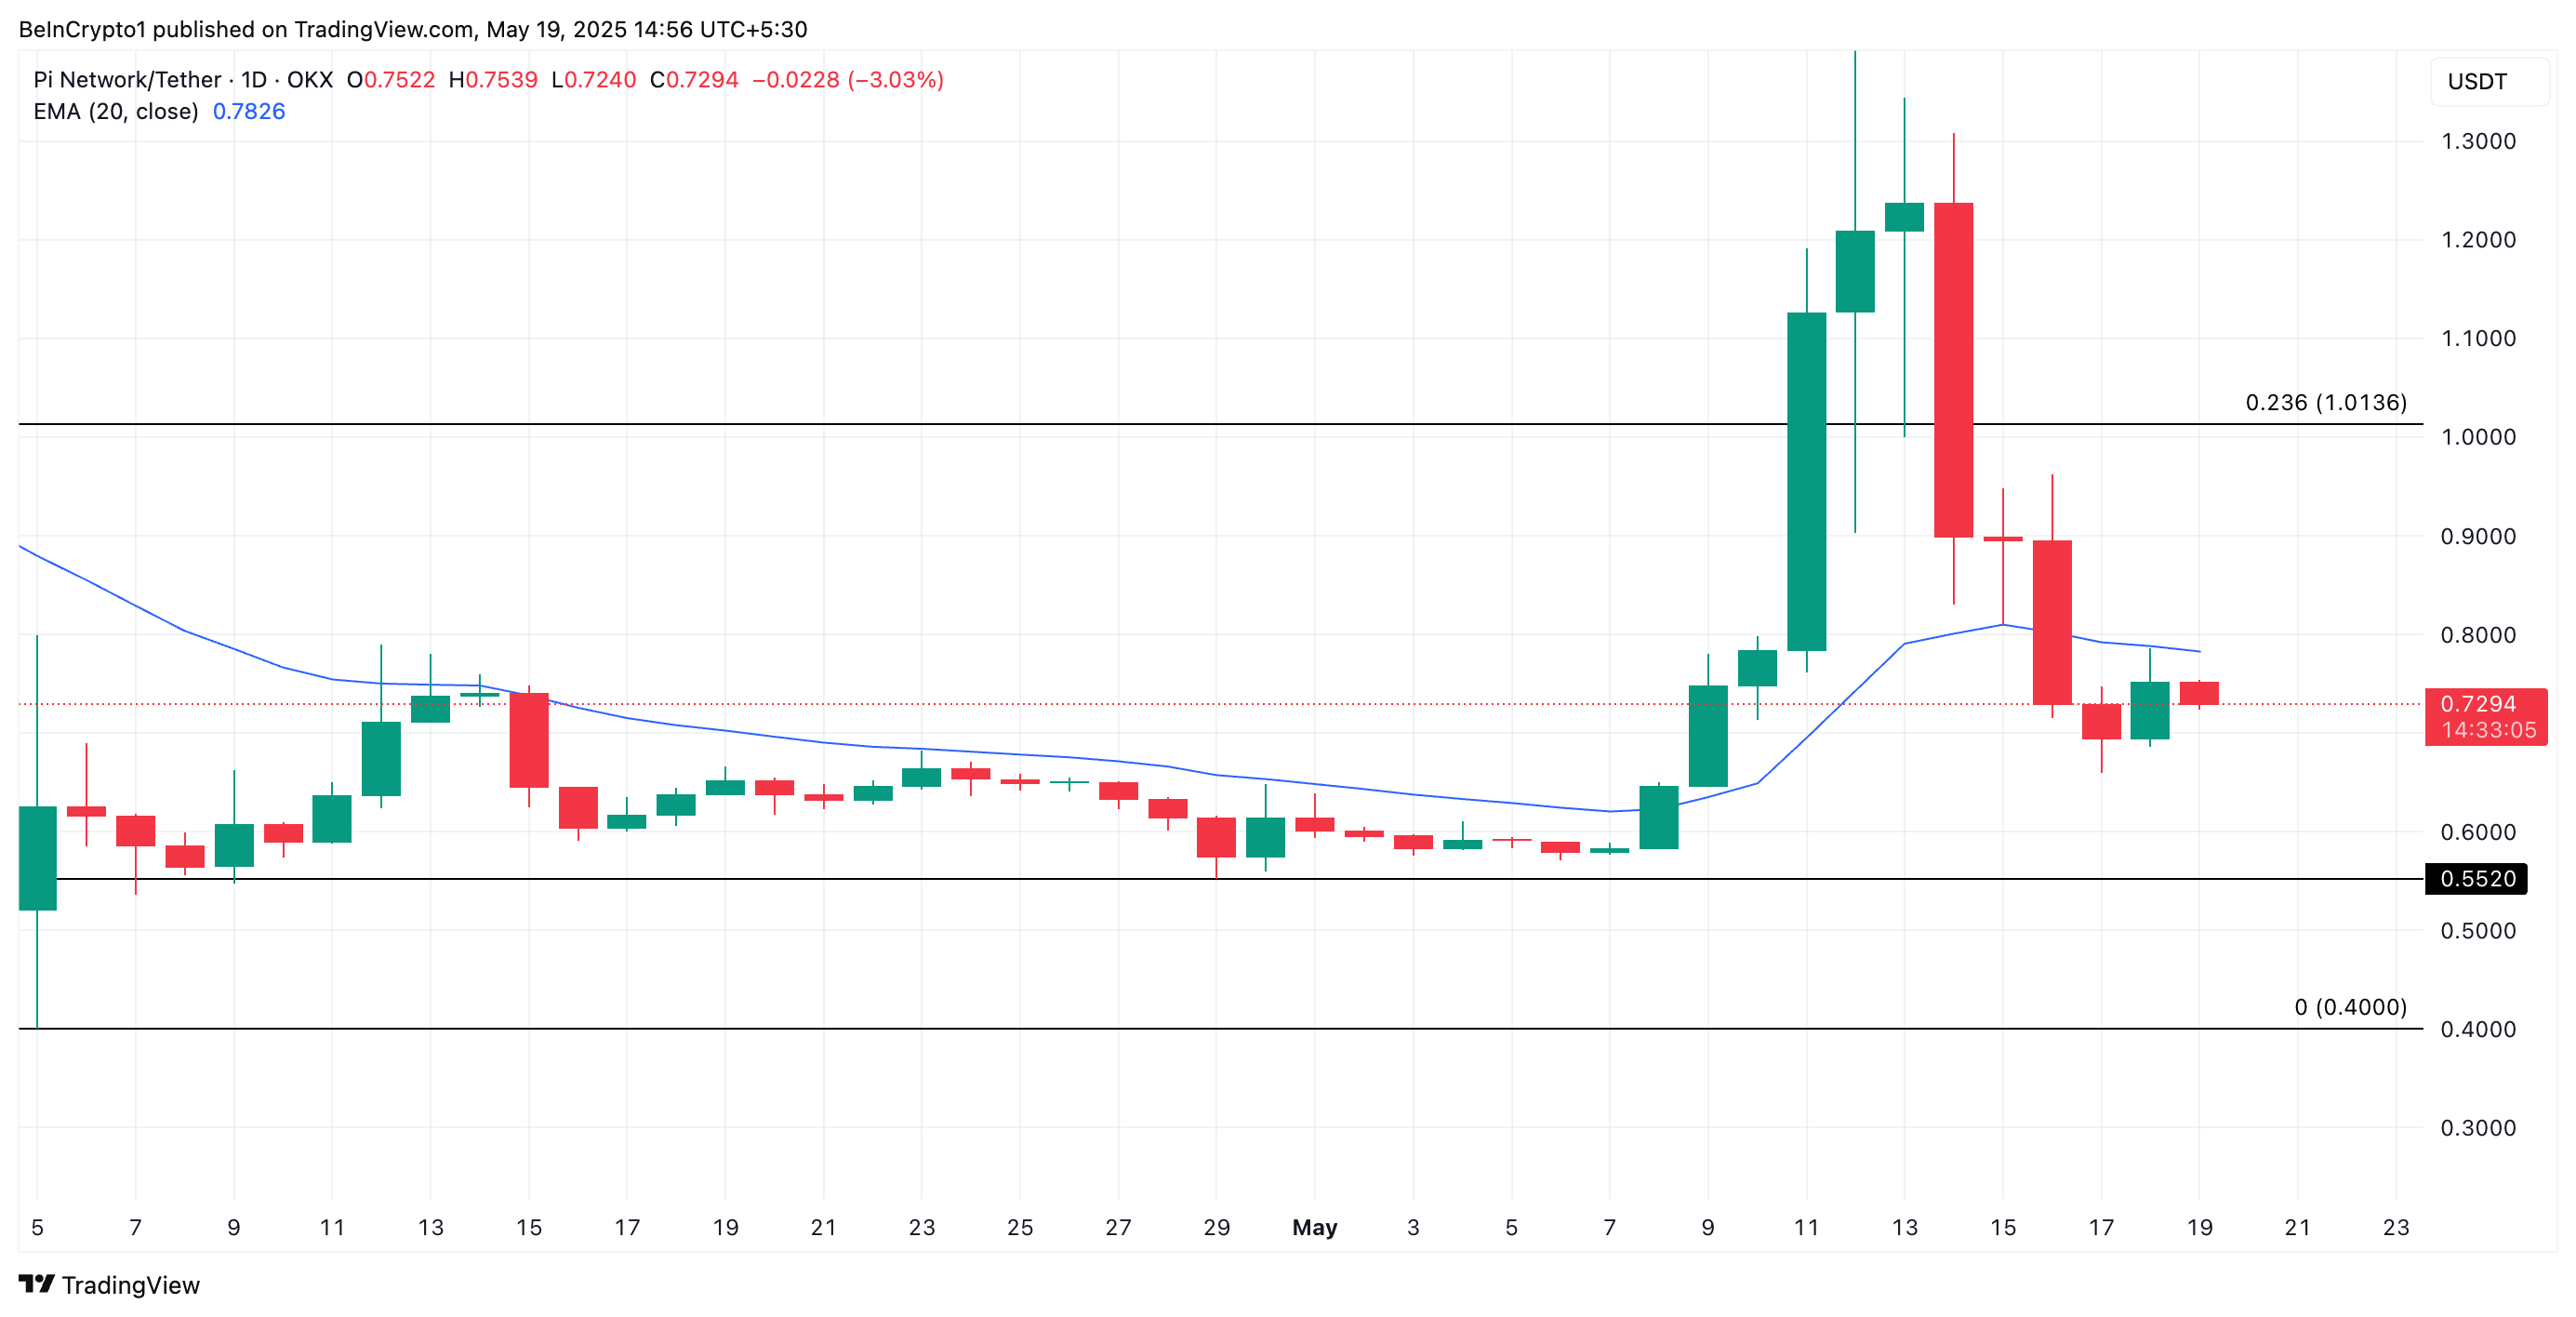 PI Price Analysis. Source:
TradingView
On the other hand, if buying pressure spikes, the PI token could rebound and climb to $1.01.
Disclaimer: The content of this article solely reflects the author's opinion and does not represent the platform in any capacity. This article is not intended to serve as a reference for making investment decisions.
You may also like
PE only 3x, valuation has dropped to financial crisis levels! With Samsung and SK Hynix earnings reports approaching, can they reverse the downward trend in stock prices?
Samsung Electronics and SK Hynix are facing an extreme divergence of "record-breaking profits and rock-bottom valuations," with their price-earnings ratios dropping to around 3x and foreign ownership at historic lows. Institutions believe the market is overly pessimistic, as significant profit growth for both companies over the next two years is largely secured. With this week's earnings reports, the market is focusing on management's statements regarding long-term supply outlooks and shareholder returns, in hopes that these will serve as catalysts for a revaluation of their stock prices.

A Perfect Storm for Bitcoin? Fed, PCE, GDP and Big Tech Earnings Ahead

Forex Today: Mood improves slightly to begin critical central bank week
Bitcoin Channel Breakdown — $82K Resistance, $72.5K Buy Zone: Analyst

Crypto prices
More


