Bitget App
Trade smarter
Buy cryptoMarketsTradeFuturesStocksEarnInstitutionAI & More
Stellar (XLM) To Rise Higher? Key Harmonic Pattern Signals Potential Upside Move

Stellar (XLM) To Rise Higher? Key Harmonic Pattern Signals Potential Upside Move

CoinsProbeCoinsProbe2025/06/10 01:41
By:Nilesh Hembade

Date: Sun, June 08, 2025 | 09:10 AM GMT

The cryptocurrency market is bouncing back strongly after Thursday’s sharp sell-off, which briefly dragged Bitcoin (BTC) to a low of $100,430 and Ethereum (ETH) to $2,387. However, the tide has turned—BTC has reclaimed levels above $105,500, while ETH has recovered to around $2,515. This broader rebound is now lifting sentiment across altcoins , including Stellar (XLM).

XLM is back on the green track and a closer analysis of the chart reveals that the asset may be preparing for a stronger continuation to the upside.

Stellar (XLM) To Rise Higher? Key Harmonic Pattern Signals Potential Upside Move image 0 Source: Coinmarketcap

Technical Patterns Hint at Upside Momentum

The 4-hour chart for XLM shows a breakout from a falling wedge formation—a bullish pattern that often precedes trend reversals. Adding further weight to the bullish case is the formation of a Bearish Cypher harmonic pattern, a setup that typically signals a short-term rally before entering a potential reversal zone.

The structure began with a top at $0.3123 (point X), followed by a decline to $0.2589 (point A). XLM then retraced to $0.2762 (point B), before dipping again to $0.2525 (point C). This recent recovery from point C marks the beginning of the final leg toward point D.
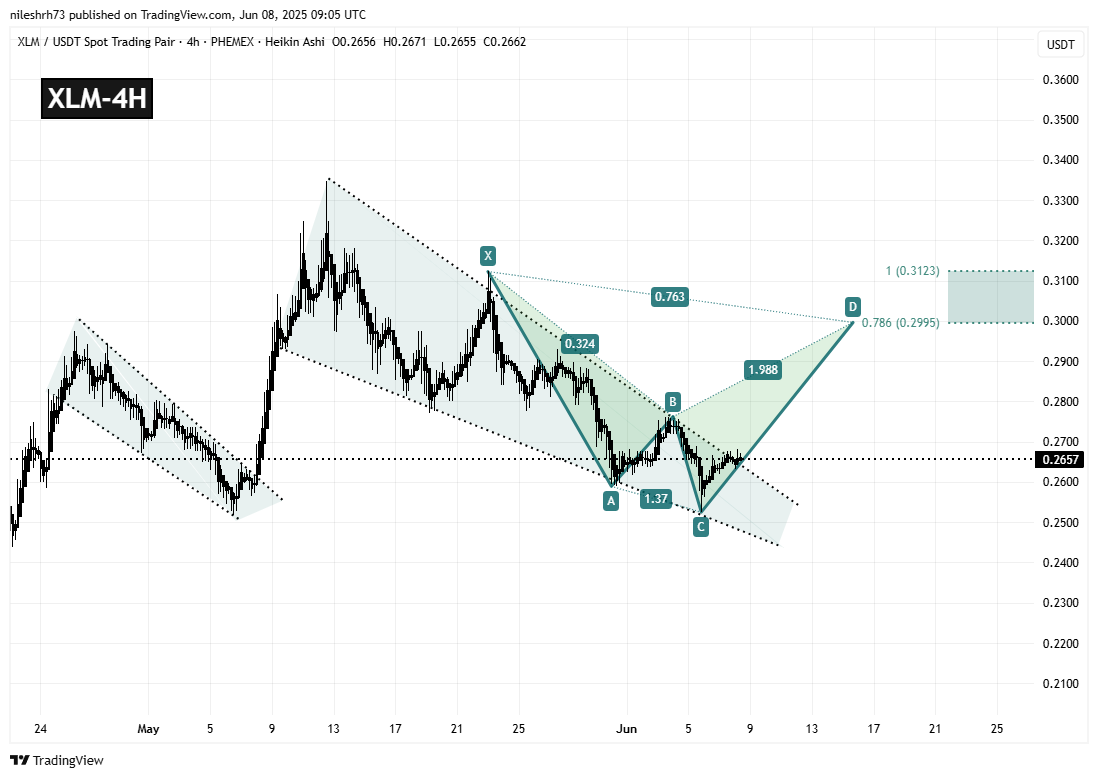
Stellar (XLM) To Rise Higher? Key Harmonic Pattern Signals Potential Upside Move image 1 Stellar (XLM) 4H Chart/Coinsprobe (Source: Tradingview)

The projected D leg lies between $0.2995 and $0.3123, aligning with the 78.6% Fibonacci retracement of the XC leg and the 100% Fibonacci extension. These levels serve as potential resistance and completion zones for the harmonic pattern. From its current price near $0.2657, a move to the D-zone implies a potential upside of 12% to 17%.

What’s Next for XLM?

A confirmed breakout from the falling wedge, combined with a well-respected harmonic structure, points to the possibility of XLM continuing its recovery run. If buyers manage to lift prices into the $0.2995 to $0.3123 range, it would validate the harmonic setup. However, traders should be aware that this zone could also invite profit-taking and short-term selling pressure, as is often seen near harmonic completion levels.

Disclaimer: This article is for informational purposes only and not financial advice. Always conduct your own research before investing in cryptocurrencies.


0
0

Disclaimer: The content of this article solely reflects the author's opinion and does not represent the platform in any capacity. This article is not intended to serve as a reference for making investment decisions.

Understand the market, then trade.
Bitget offers one-stop trading for cryptocurrencies, stocks, and gold.
Trade now!

You may also like

Counter-terrorism forces take to the streets, Louvre closes! France erupts in a new wave of protests over the weekend, with turmoil threatening to spread across Europe

France is engulfed in a new wave of violent protests, with 70,000 security personnel deployed urgently and curfews imposed in multiple cities. Macron admits to mishandling the response. Financial markets have sounded the alarm early — the spread between French and German government bonds has surged to its highest level since the European debt crisis, PMI has fallen below the threshold for expansion, luxury shops have boarded up windows, the Louvre Museum has closed, and Paris City Hall estimates losses of tens of millions of euros. The turmoil also threatens to spread across Europe.

华尔街见闻•2026/10/24 11:56
Counter-terrorism forces take to the streets, Louvre closes! France erupts in a new wave of protests over the weekend, with turmoil threatening to spread across Europe

Once frenzied buying, now the "ammunition warehouse" shrinks by 51 trillion KRW! Korean retail investors can no longer afford to buy

In four months, Korean retail investors' "ammunition stockpile" has dropped by 36.5%, returning to levels seen at the beginning of the year. Although retail investors have collectively made net purchases exceeding 75 trillion won, they are still absorbing the sell-off, but the influx of new funds has dried up, and the replenishment rate lags far behind the consumption rate. Combined with the KOSPI plunging nearly 20% this month, continued net selling by foreign investors, and concerns over AI-related credit risks, the Korean stock market may find it difficult to see a sustained rebound in the short term without support from private investors' funds.

华尔街见闻•2026/10/24 08:46