- Arbitrum moved above $0.45 and now targets $0.5479 as price approaches the upper trendline zone.
- Fibonacci levels show $0.5479 and $0.6645 as the next key zones if $ARB breaks the current setup.
- The move from $0.30 to $0.48 has created higher lows which show strong pressure building to the upside.
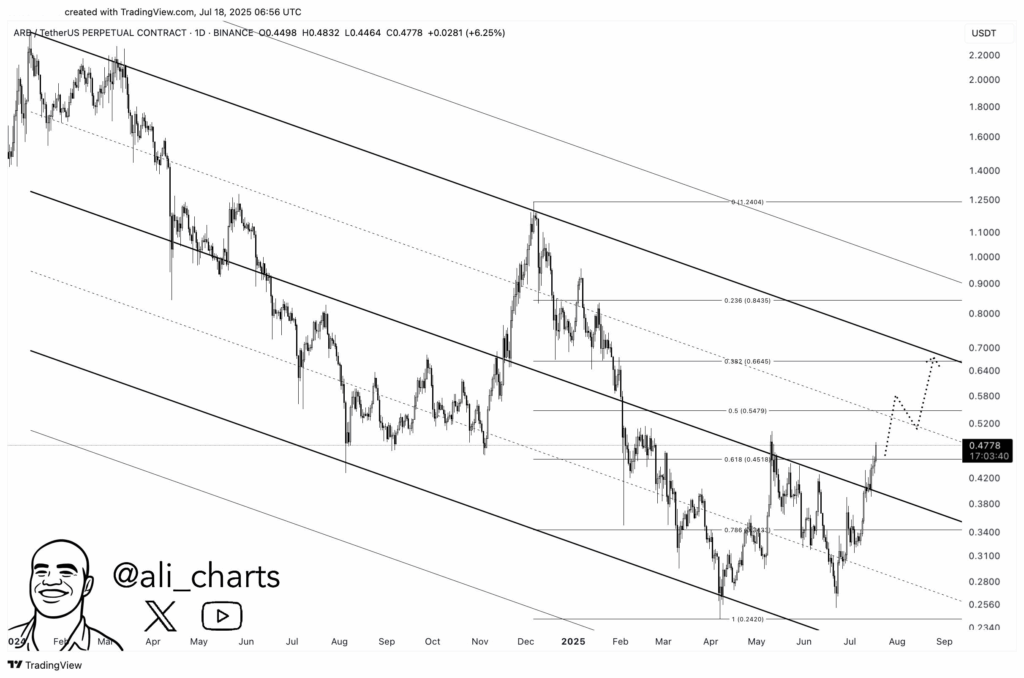
Arbitrum ($ARB) is trading at $0.4778 after a +6.25% rise, climbing toward the upper boundary of its descending price channel. Shared on July 19, 2025, by analyst @ali_charts, the technical setup shows $ARB steadily tracking through layered Fibonacci zones. The asset recently broke above $0.45 and is now targeting higher channel resistance above $0.56.
 Source:
X
According to the chart, $ARB has rallied from a local low near $0.30 and continues following a projected path outlined in dotted form. The steady climb places $ARB within reach of key Fibonacci retracement levels, including 0.5 at $0.5479 and 0.382 at $0.6645.
With volume support and trend strength building, investors are now asking a critical question: Can Arbitrum sustain this momentum and exit the long-term downtrend?
Arbitrum Tracks Key Fibonacci Levels
The chart shows a multi-month descending channel structure containing $ARB price since early 2023. The Fibonacci retracement levels are mapped from the $2.24 peak to the $0.24 bottom.
Price is now moving toward the 0.5 level at $0.5479 after recently crossing above the 0.618 zone at $0.4810. Fibonacci levels on the chart also align with the midpoints of the larger descending channel, giving additional structure to the upward path.
Dotted arrows on the chart show the projected route for $ARB, suggesting a continued rise toward the upper trendline near $0.66. Traders often monitor these levels for key decision zones, and the current structure suggests growing pressure to challenge the channel’s ceiling.
The 0.382 level at $0.6645 could act as a magnet for short-term bulls. A breakout above that point would place the next resistance near the $0.80 range. As of now, $ARB remains within the central zone of the larger channel, with price action favoring a bullish breakout attempt.
Momentum Builds Following $0.30 Rebound
Price began its recovery in early June 2025 after reaching a long-term bottom near $0.30. Since then, $ARB has formed a series of higher lows, pushing the price action above descending resistance. The most recent breakout above the $0.45 level confirmed short-term strength. It also marked a clean breach above the channel midpoint, giving traders additional technical confidence. The move has been supported by a sharp +6.25% daily gain, noted during the July 19 trading session.
Analysts are watching closely as $ARB nears the upper band of the channel. This area has historically acted as strong resistance. If the price closes above $0.56, it could invalidate the downtrend structure and shift long-term momentum.
Community feedback to the chart was active, with users praising its clarity. Comments like “Clean charts says it all” and “The break is already happening” reflected broad market attention.
Will $ARB Break the Downward Channel and Reclaim Higher Ground?
The technical roadmap now hinges on a key question: Can Arbitrum successfully break its multi-month descending channel?
With price nearing $0.55 and momentum continuing from the $0.30 low, the bullish scenario appears increasingly viable. Traders now eye the 0.5 and 0.382 Fibonacci levels for validation of breakout strength.
Arbitrum’s ability to maintain higher lows and penetrate resistance zones may define its next multi-week direction. Confirmation above $0.66 could signal the start of a trend reversal.