
Ethereum Price Skyrockets: What’s Coming Next?

Ethereum price is making headlines again, climbing aggressively as it approaches the key psychological barrier of $4,000. After weeks of consolidation, ETH has erupted with a powerful breakout, leaving behind major resistance zones and signaling renewed bullish momentum. On the daily chart, ETH price has been printing strong Heikin Ashi candles backed by rising volume and an overheated RSI—indicating that the bulls are in full control, at least for now.
But is this breakout sustainable, or are we witnessing the final leg of an overextended rally? In this article, we’ll analyze Ethereum’s price structure, momentum indicators, Fibonacci targets, and likely next moves to determine whether ETH price can truly break the $4K mark —or if a correction is looming.
Ethereum Price Prediction: Why Is Ethereum Price Surging Right Now?
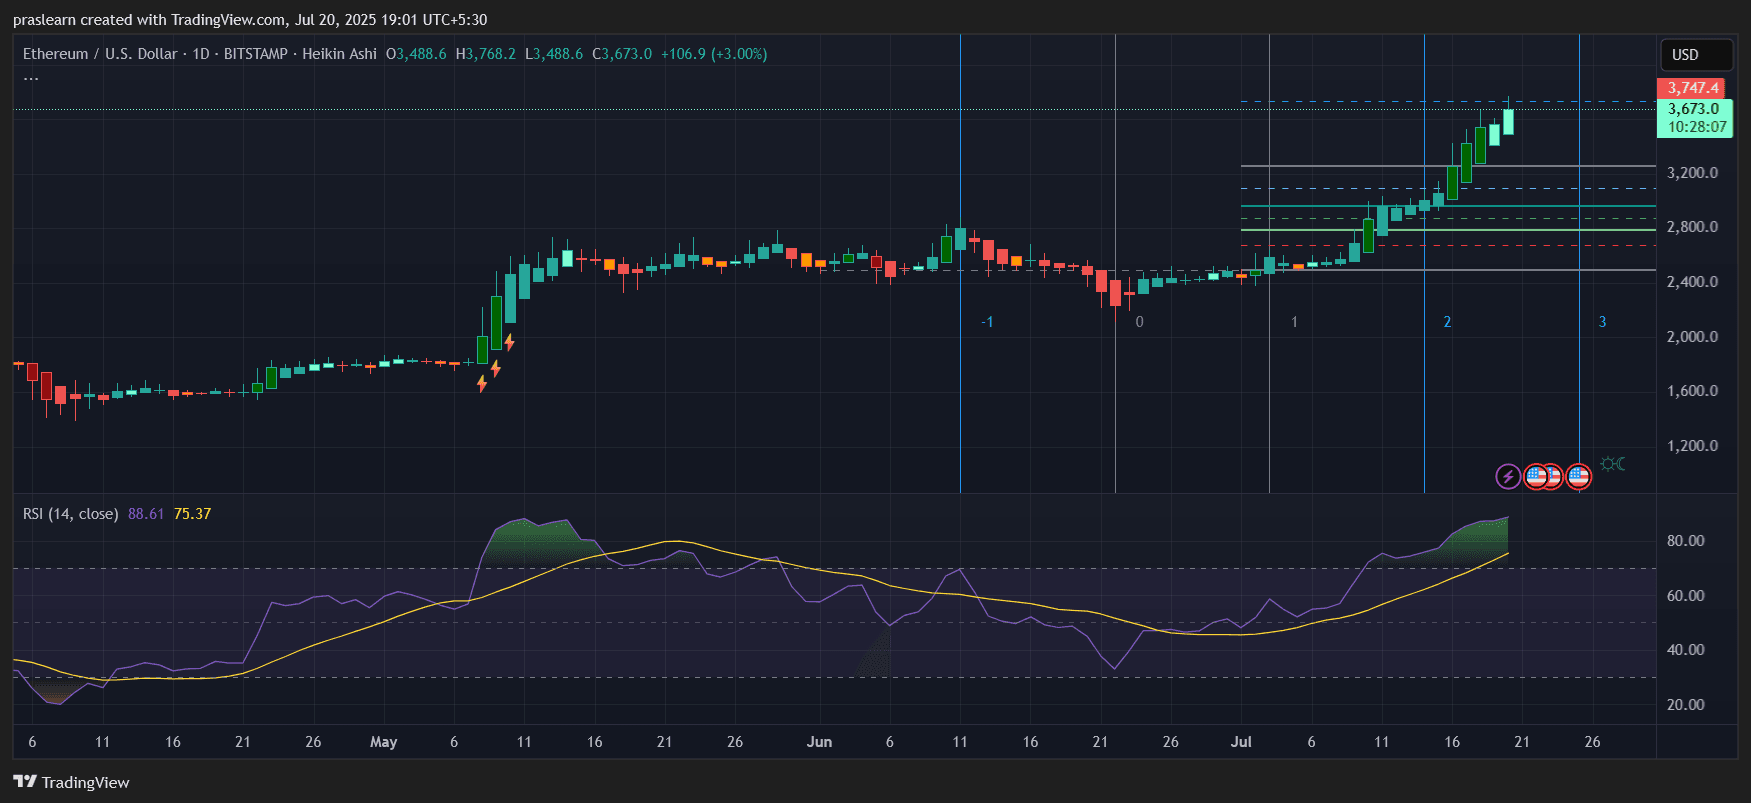 ETH/USD Daily Chart- TradingView
Ethereum (ETH) price is currently on fire , with its price climbing to $3,673—up 3.00% in the last daily candle. The daily chart (Heikin Ashi) shows a strong and consistent bullish trend, with multiple consecutive green candles and minimal wicks to the downside. Momentum has clearly shifted, and Ethereum is challenging key resistance levels near $3,747.4.
The major catalyst seems to be the broader market optimism following renewed ETF speculation and a surge in DeFi activity. However, the chart shows this isn’t just hype—it’s a technically strong move with confirmation from indicators.
What Does the RSI Say About Ethereum’s Strength?
The Relative Strength Index (RSI) is currently at 88.61, well above the traditional overbought threshold of 70. This extreme reading is rare and signals tremendous momentum—but also a potential short-term cooling.
Historically, when Ethereum’s RSI reaches these levels, a pullback or consolidation follows within 5–7 days. However, overbought conditions during strong breakouts often lead to bullish continuations if volume supports the trend.
Here’s a historical context:
In May 2021, ETH's RSI reached 88, followed by a 10% rise before a 15% correction.
A similar setup now suggests Ethereum could hit $3,950–$4,000 before facing resistance.
Fibonacci Levels and Breakout Zones
Looking at the Fibonacci retracement levels drawn from the previous swing high and low, Ethereum has broken past multiple retracement zones:
- $2,800 – Previous 0.618 level broken with high volume
- $3,200 – Passed without resistance
- $3,488 – Local breakout level
- $3,747.4 – Next key target zone
If Ethereum price breaks above $3,750 , the next Fibonacci extension target sits at $4,150, which aligns with the psychological round number of $4,000.
Price Projection Calculation:
Let’s use a simple Fibonacci extension method:
If the swing low was $2,400 and swing high is $3,488, the difference is:
$3,488 - $2,400 = $1,088
Fibonacci 1.618 extension = $2,400 + (1.618 × $1,088) = $4,162
This projection points toward a possible $4,150–$4,200 target in the coming weeks.
Is This a Blow-Off Top or the Start of a New Rally?
Currently, Ethereum price is trading in Wave 3 of an Elliott Wave pattern , which typically represents the strongest bullish leg. The chart shows clear impulsive movement without significant retracement, confirming bullish control.
The lack of bearish divergence on the RSI and the strength of the current candles support the case for a continuation rally, at least until $3,950–$4,150.
However, traders should note:
- ETH is overbought
- Pullbacks to $3,200 or $2,950 are possible
- Strong support lies between $2,850–$3,200
Ethereum Price Prediction for July 2025
Given current momentum, strong Heikin Ashi structure , and RSI-backed breakout, Ethereum price is likely to continue its upward journey.
Short-Term Prediction (Next 7–10 days):
- Bullish scenario: ETH hits $3,950–$4,150
- Consolidation scenario: ETH stabilizes between $3,200–$3,600
- Bearish reversal only if: ETH drops below $2,950
Should You Buy ETH Now?
The technicals support a bullish continuation. However, with RSI so high, short-term pullbacks are natural and even healthy. If you're looking to enter, consider waiting for a dip near the $3,200 zone—or ride the wave with a tight stop loss.
Ethereum price looks strong, and the chart setup could be signaling the start of a major bullish phase. If it breaks $3,750 convincingly, $4,150 may just be the next destination.
Disclaimer: The content of this article solely reflects the author's opinion and does not represent the platform in any capacity. This article is not intended to serve as a reference for making investment decisions.
You may also like
Korean stocks fall to historically "cheap" levels with no buyers, JPMorgan warns: Leverage-driven sell-off may continue
Excluding the influence of giants like Samsung and SK Hynix, the overall KOSPI is trading at just 8.4 times forward earnings, placing it in the 11th historical percentile. With stock buybacks by Samsung and SK Hynix having recently concluded, net sales by foreign investors, and weak demand from domestic institutions, Korean stocks are losing sources of buying exactly when the market most needs support. JPMorgan pointed out that although holdings of leveraged ETFs have faced large-scale sell-offs, they still remain high, and the possibility of another round of sell-offs cannot be ruled out.

CoreWeave bond plunge rings alarm bells, Fed may need to reassess rate hike pace
CoreWeave bond yields once surged to 15%, with junk-grade and investment-grade yields reaching their highest levels since 2025 and 2023, respectively. According to a Bloomberg column, as the 2028 high-yield debt maturity peak approaches, a disorderly widening of credit spreads could trigger a wave of defaults and rising unemployment. The Federal Reserve should stay put at its October meeting, maintaining the interest rate range at 3.75% to 4%, and prudently weigh its decision for December.

MrBeast Promotes Step as Crypto Integration Plans Remain Unclear

GE Aerospace stock closes 0.81% lower despite a positive daily MACD histogram
Crypto prices
More


