
Bitcoin's Bollinger Bands Tightest Since February; XRP, SOL Establish Lower Highs

This is a daily analysis of top tokens with CME futures by CoinDesk analyst and Chartered Market Technician Omkar Godbole.
Bitcoin: Bollinger bands tighten
BTC's continued consolidation between $116,000 and $120,000 calls for renewed focus on Bollinger bands, which have now tightened to levels last seen before the late February volatility explosion that saw prices drop from $95,000 to $80,000 within days.
Tighter bands indicate that the market is coiling up and building energy for a big move in either direction. Bollinger bands are volatility bands placed two standard deviations above and below the asset's 20-day simple moving average.
This view is consistent with the VIX's bullish August seasonality that suggests heightened price turbulence for stocks and bitcoin over the coming four weeks.
A break below $116,000 would imply downside volatility explosion, exposing the former resistance-turned-support at $111,965. Conversely, a quick move to new lifetime highs appears likely if tighter Bollinger bands resolve bullishly.
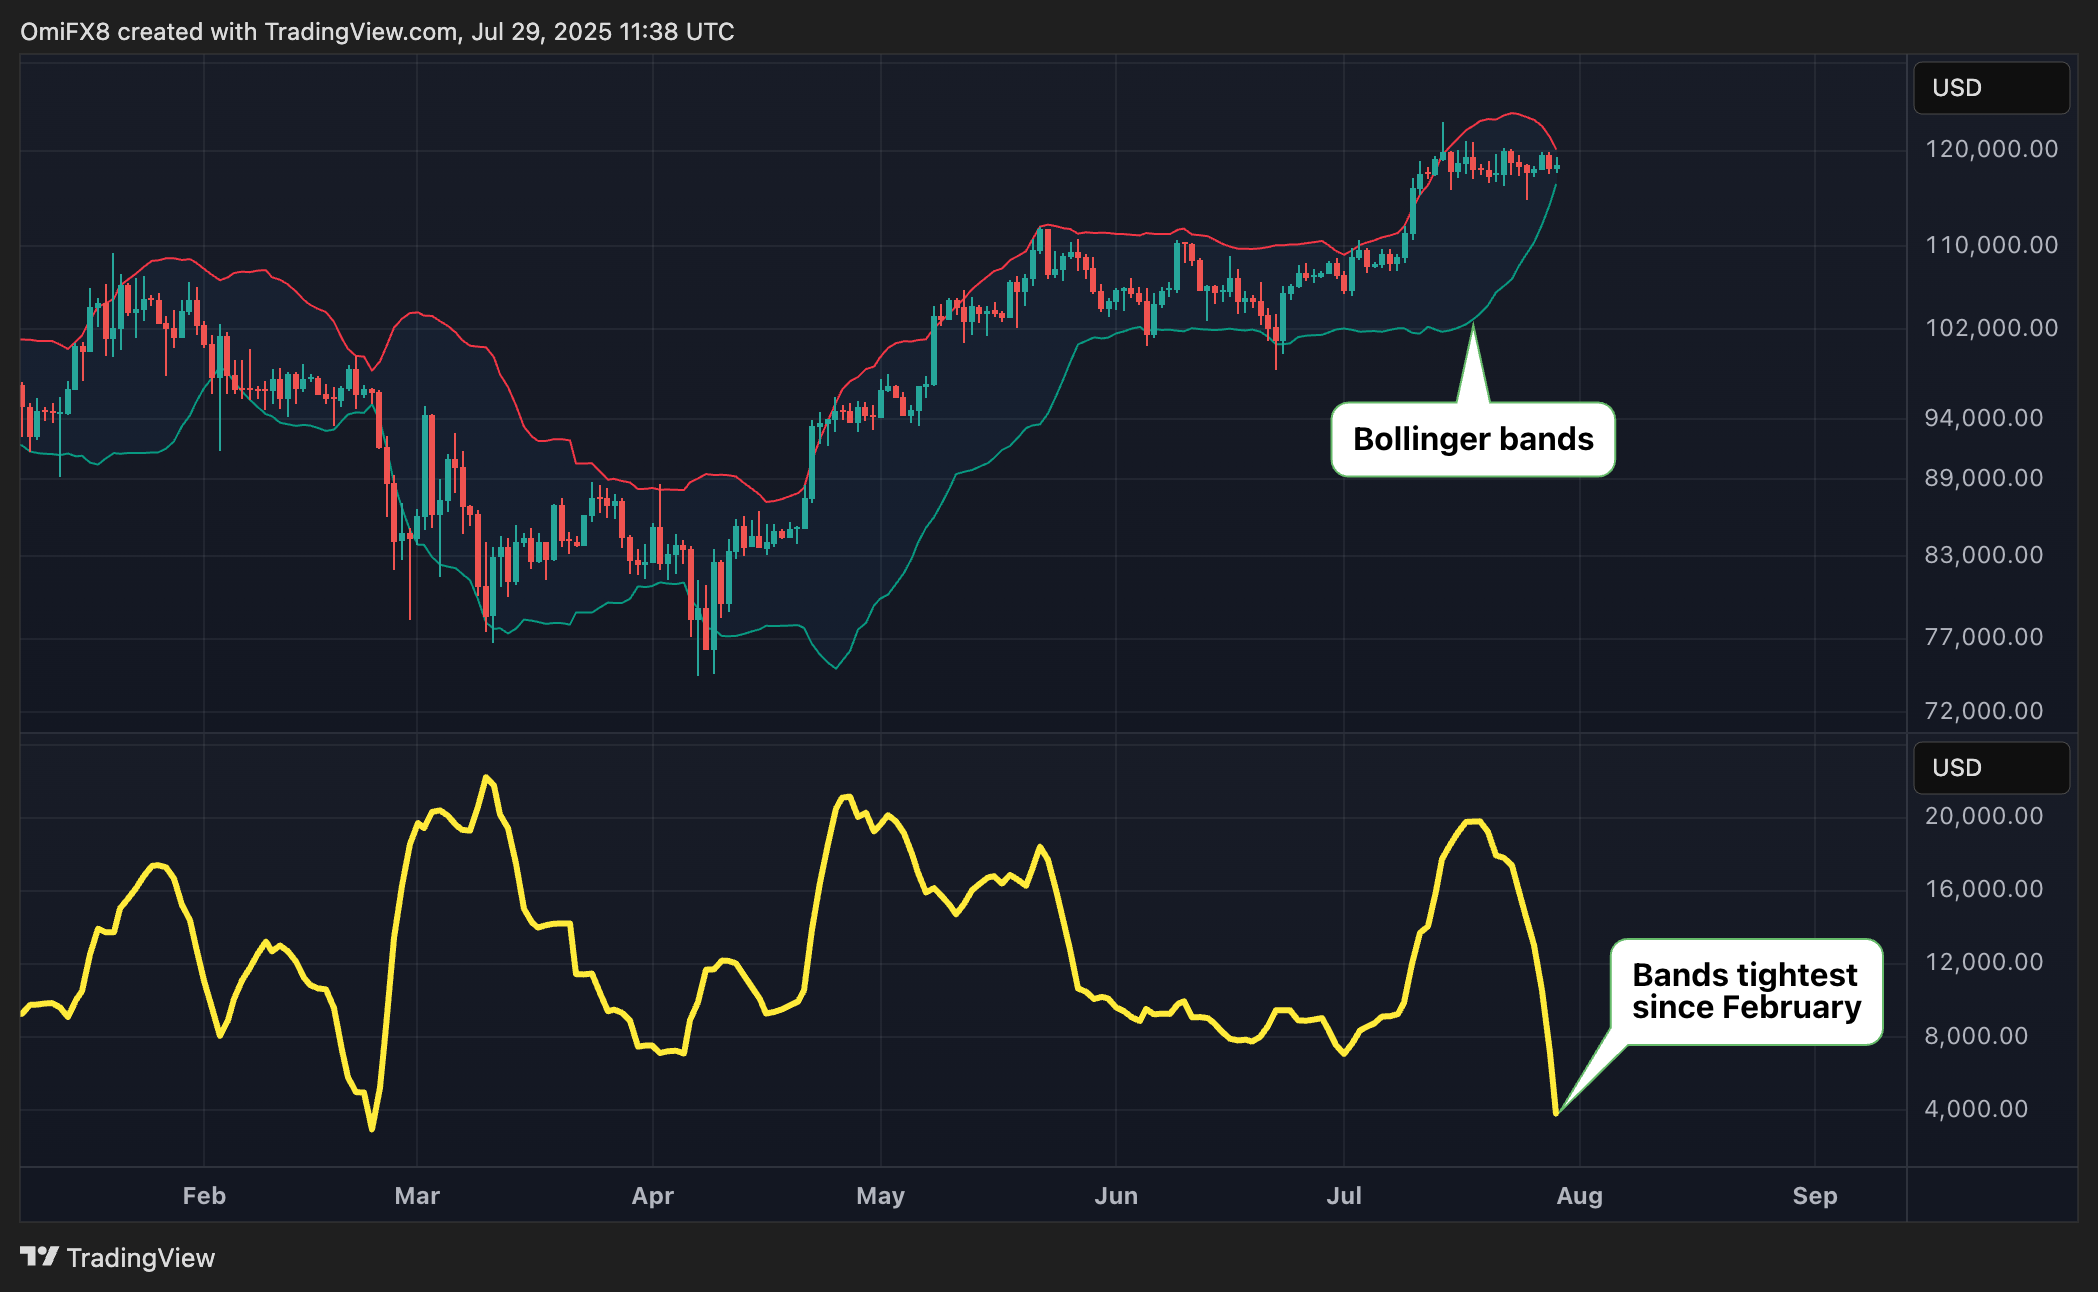
- AI's take: Thesignificant contraction of volatility, especially after a strong uptrend, often signals that the price is coiling up for a large and potentially explosive move in the near future.
- Resistance: $120,000, $123,181.
- Support: $116,000-$117,000, $114,700, $111,965.
XRP: Lower high established
XRP fell 3.59% on Monday, creating a red candle with a prominent upper wick, suggesting seller dominance. The cryptocurrency printed a lower high at $3.33, the first since peaking at $3.65 with a bearish tweezer top pattern, indicating a potential deeper pullback ahead. This suggests that it's only a matter of time before the mini-ascending channel seen on the hourly chart gives way, exposing the recent low of $2.95 and possibly the May high of $2.65. The hurdle at $3.35 must be overcome to negate the bearish bias.
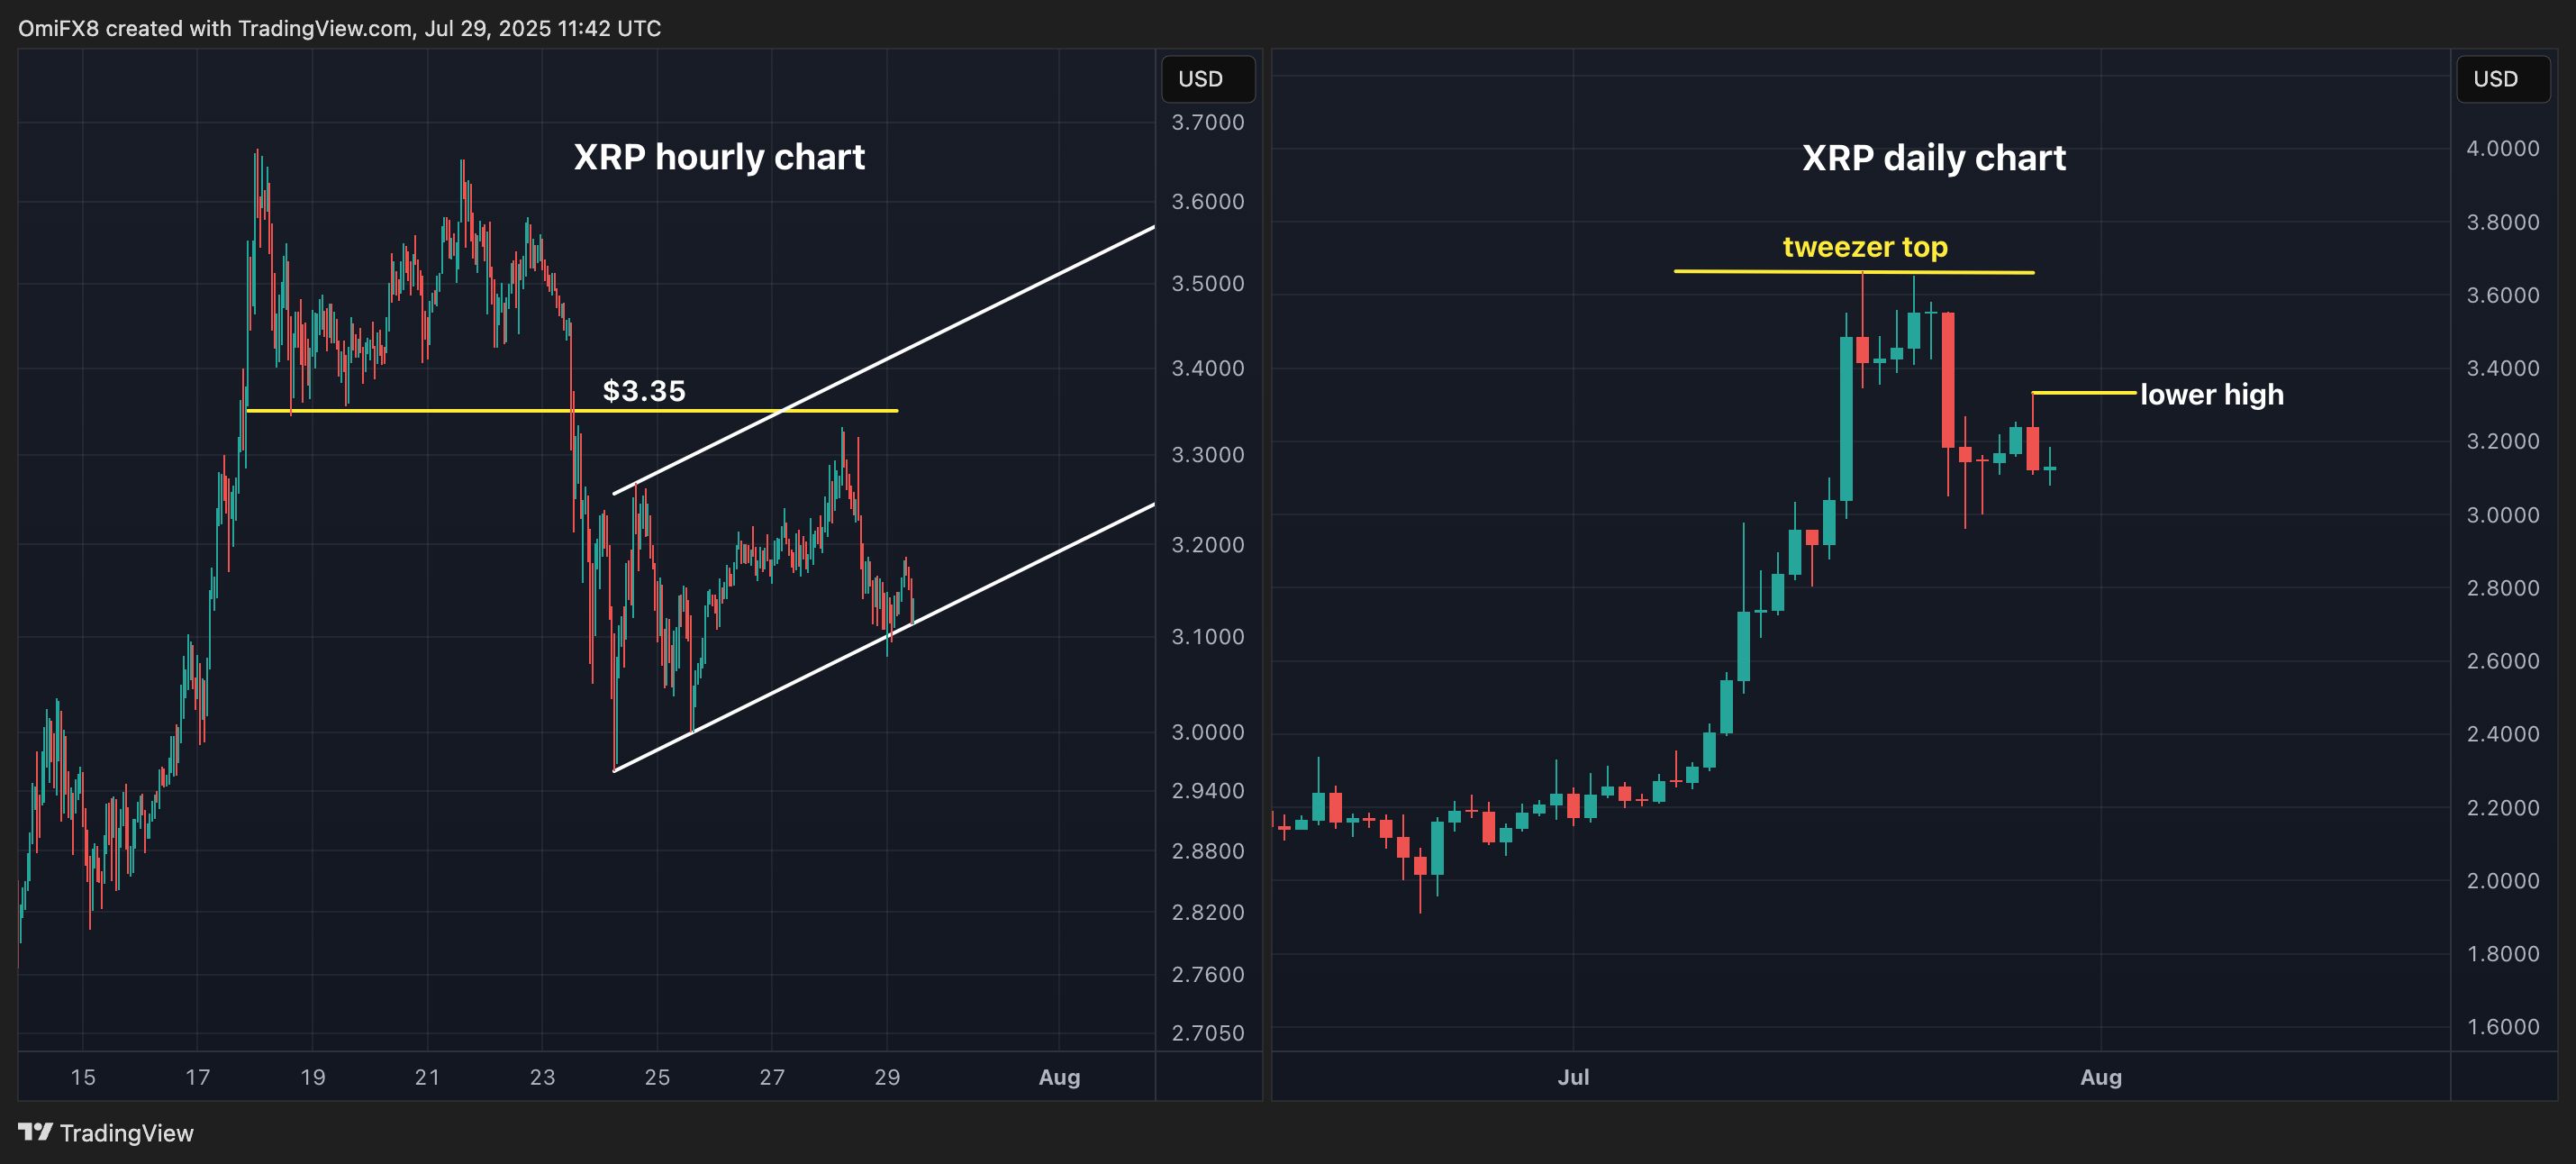
- AI's take: Traders should primarily focus on whether XRP can decisively reclaim and hold above the crucial $3.35 level, which now acts as immediate resistance. A failure to do so would reinforce the daily chart's bearish reversal signals (tweezer top, lower high), suggesting further downside,
- Resistance: $3.35, $3.65, $4.00.
- Support: $2.95, $2.65, $2.44 (the 200-day SMA).
Ether: RSI diverging bearishly
Ether's 14-day relative strength index (RSI) has diverged bearishly from the price, with the MACD histogram nearing a negative crossover confirmation. These developments suggest a potential pullback to the higher low of $3,510 registered on July 24. A violation there could extend the pullback toward $3,000.
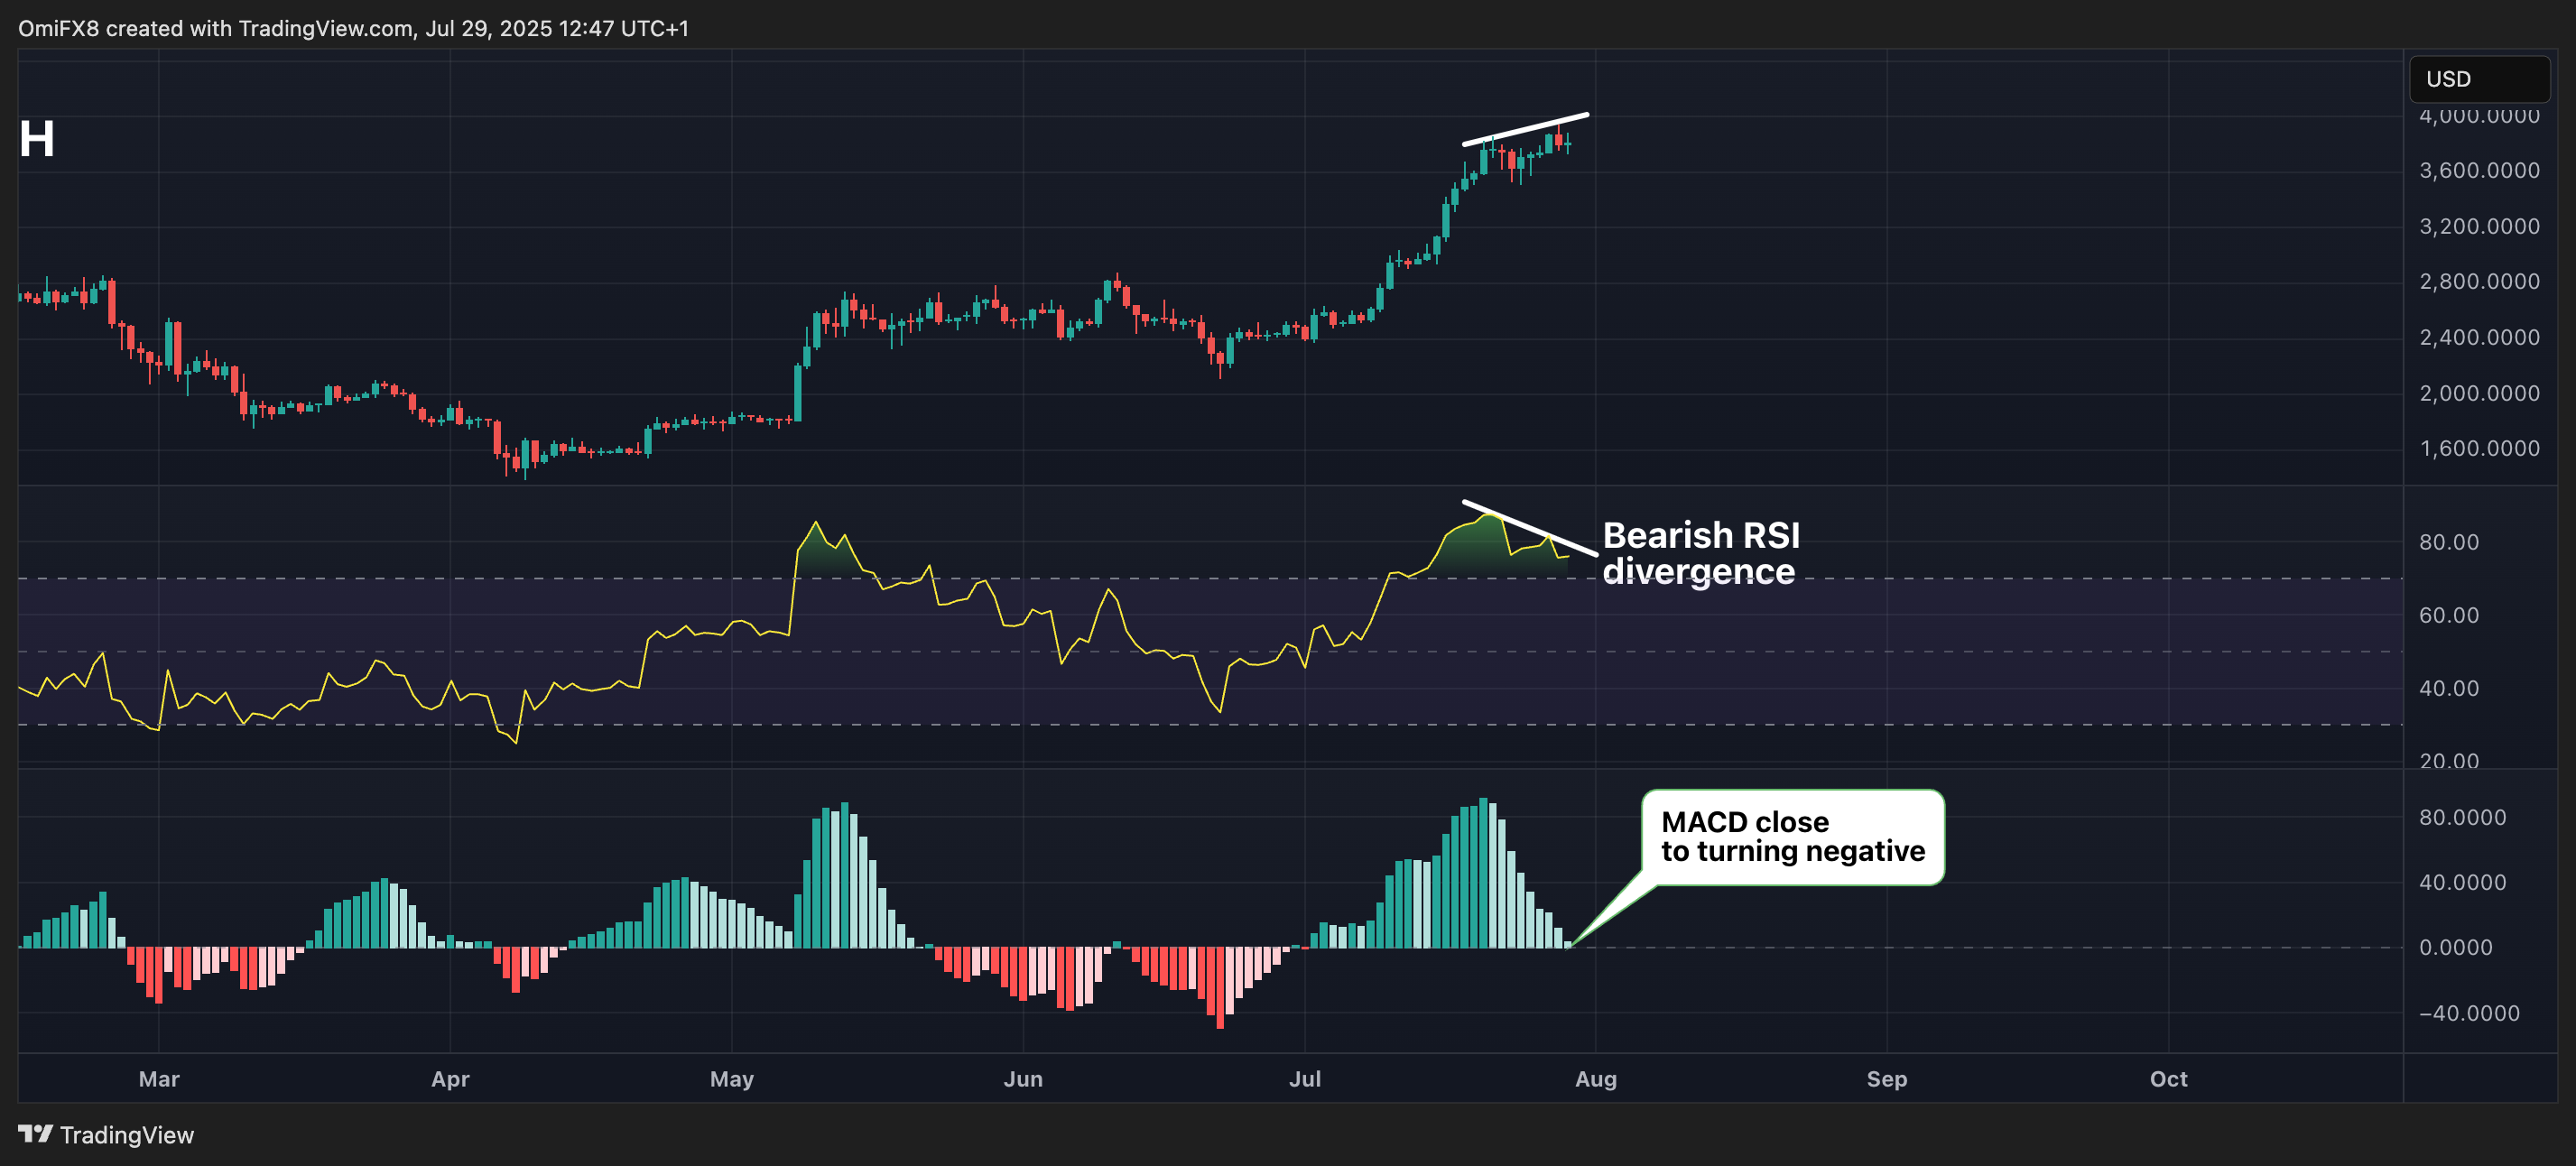
- AI's take: Traders should primarily focus on the bearish divergence displayed by the RSI, which signals weakening momentum despite Ether's recent price high.
- Resistance: $4,000, $4100, $4,382.
- Support: $3,731 (daily low), $3,510, $3,000.
Solana: XRP-like structure
SOL established a lower high at $195, reinforcing the bearish tweezer top pattern at $205-$206. Additionally, the cryptocurrency has dived out of a mini-ascending channel and the Ichimoku cloud on the hourly chart, suggesting the path of least resistance is to the downside. The resistance at $195 needs to be topped to invalidate the bearish bias.
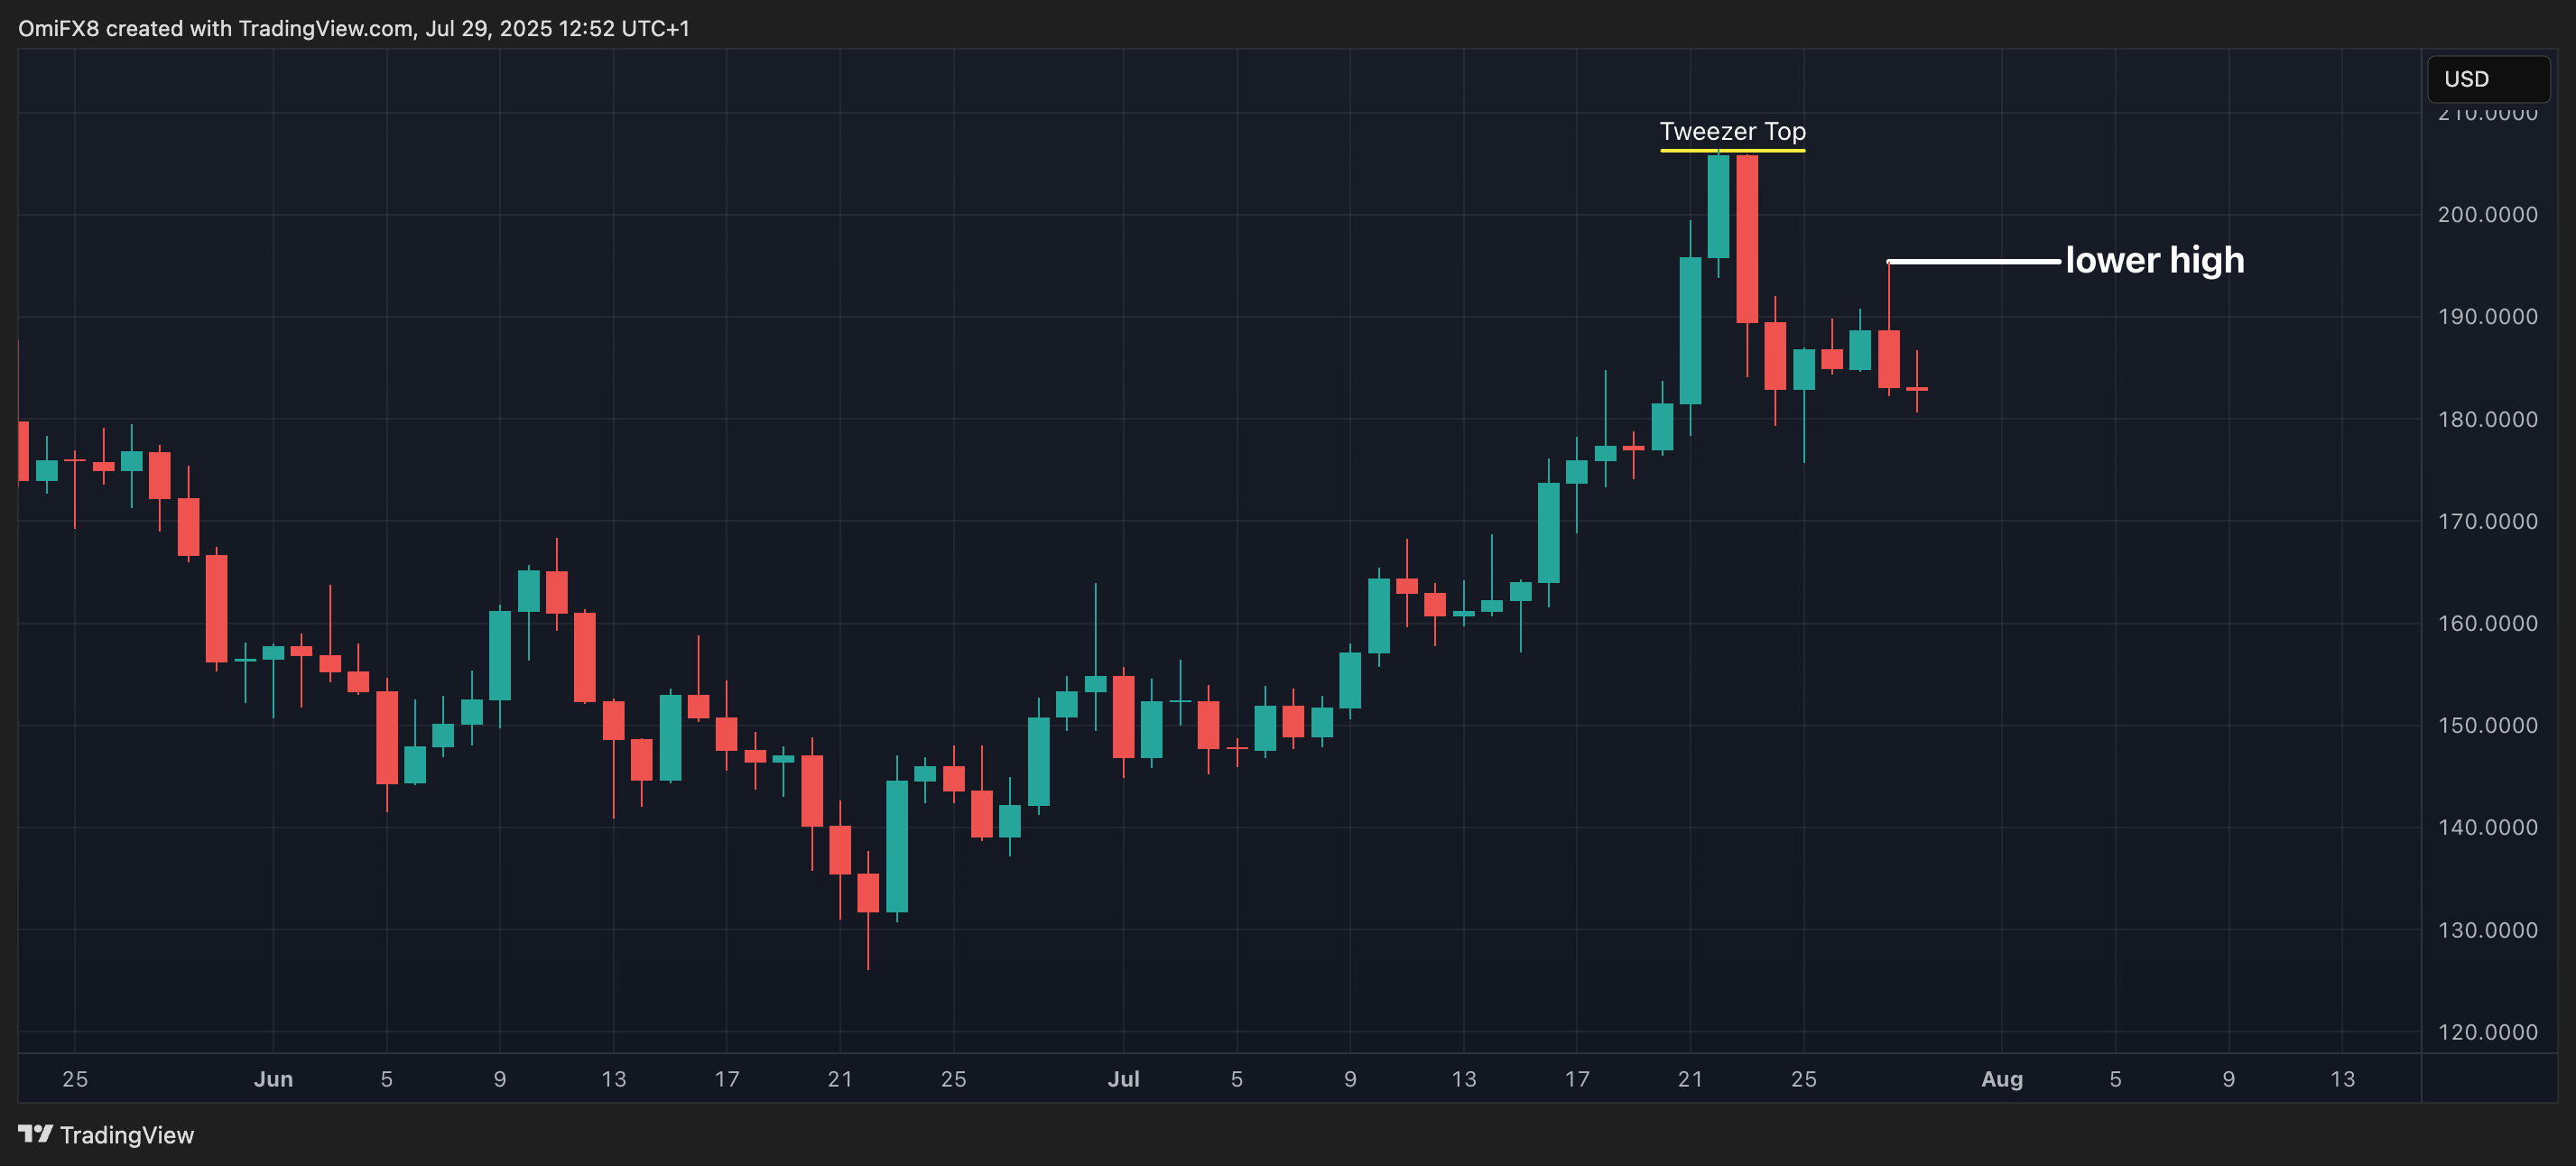
- AI's take: "Tweezer Top" candlestick pattern at the peak of the rally, immediately followed by the formation of a "lower high" is a powerful bearish reversal pattern, indicating that the strong upward momentum from July has likely ended
- Resistance: $195, $205-$206, $218.
- Support: $184, $163, $126.
Disclaimer: The content of this article solely reflects the author's opinion and does not represent the platform in any capacity. This article is not intended to serve as a reference for making investment decisions.
You may also like
JPMorgan brings JPM Coin to Ethereum

Nvidia invests billions of dollars in Germany; Jensen Huang: Once a technology powerhouse, the country has fallen behind, which pains me deeply
Nvidia signed a memorandum of cooperation with the German government at the "Invest in Germany" summit in Berlin, investing in four German startups covering robotics, healthcare, generative AI, and satellite sectors. The company also partnered with Siemens to develop AI factory solutions, potentially reducing costs by up to 20%. Jensen Huang expressed regret that Germany is lagging behind in the technology competition, noting that Europeans may be overly hesitant and consider too many factors when taking action.
The most direct signal that US stocks have peaked: South Korean chip exports?
Currently, the U.S. stock market is supported solely by strong earnings expectations. If semiconductor exports from South Korea and Taiwan decline, it may provide an early warning 3-6 months in advance of capital expenditure peaking. Once expectations reverse, high yields will instantly crush valuations.

CoreWeave Credit Crisis Resembles the 2023 SVB Panic More Than the 2008 Subprime Mortgage Crisis?
The key issue now is not whether CoreWeave will collapse, but whether compute pricing can support the financing logic of this cycle. The answer to this question will determine the eventual outcome of this panic.

Crypto prices
More


