ETH onchain data indicates a potential rally to $4,500, driven by strong market momentum, but a bearish RSI divergence warns traders of a possible short-term correction below $4,000.
-
Ether perpetual futures volume has overtaken Bitcoin, marking a significant shift in trading focus.
-
A bearish RSI divergence suggests short-term price exhaustion and possible pullback.
-
Expert analysis highlights $4,500 as a critical resistance level based on active realized price bands.
ETH onchain data forecasts a $4,500 rally with caution on short-term RSI bearish signals. Stay informed with COINOTAG’s expert crypto insights.
ETH Onchain Data Highlights $4,500 Rally Potential
Ether (ETH) has consistently traded just below the $4,000 resistance since December 2025, with traders closely watching for a breakout. The +1σ active realized price band, currently near $4,500, represents a key target for bulls. This metric tracks the average cost of ETH actively exchanged on the blockchain, serving as a vital indicator of market sentiment and potential price ceilings.
Historical data from Glassnode shows this level acted as a strong resistance during the March 2024 peak and the 2020–21 bull cycle. A sustained move above this band has previously triggered rapid price surges but also increased volatility risks.
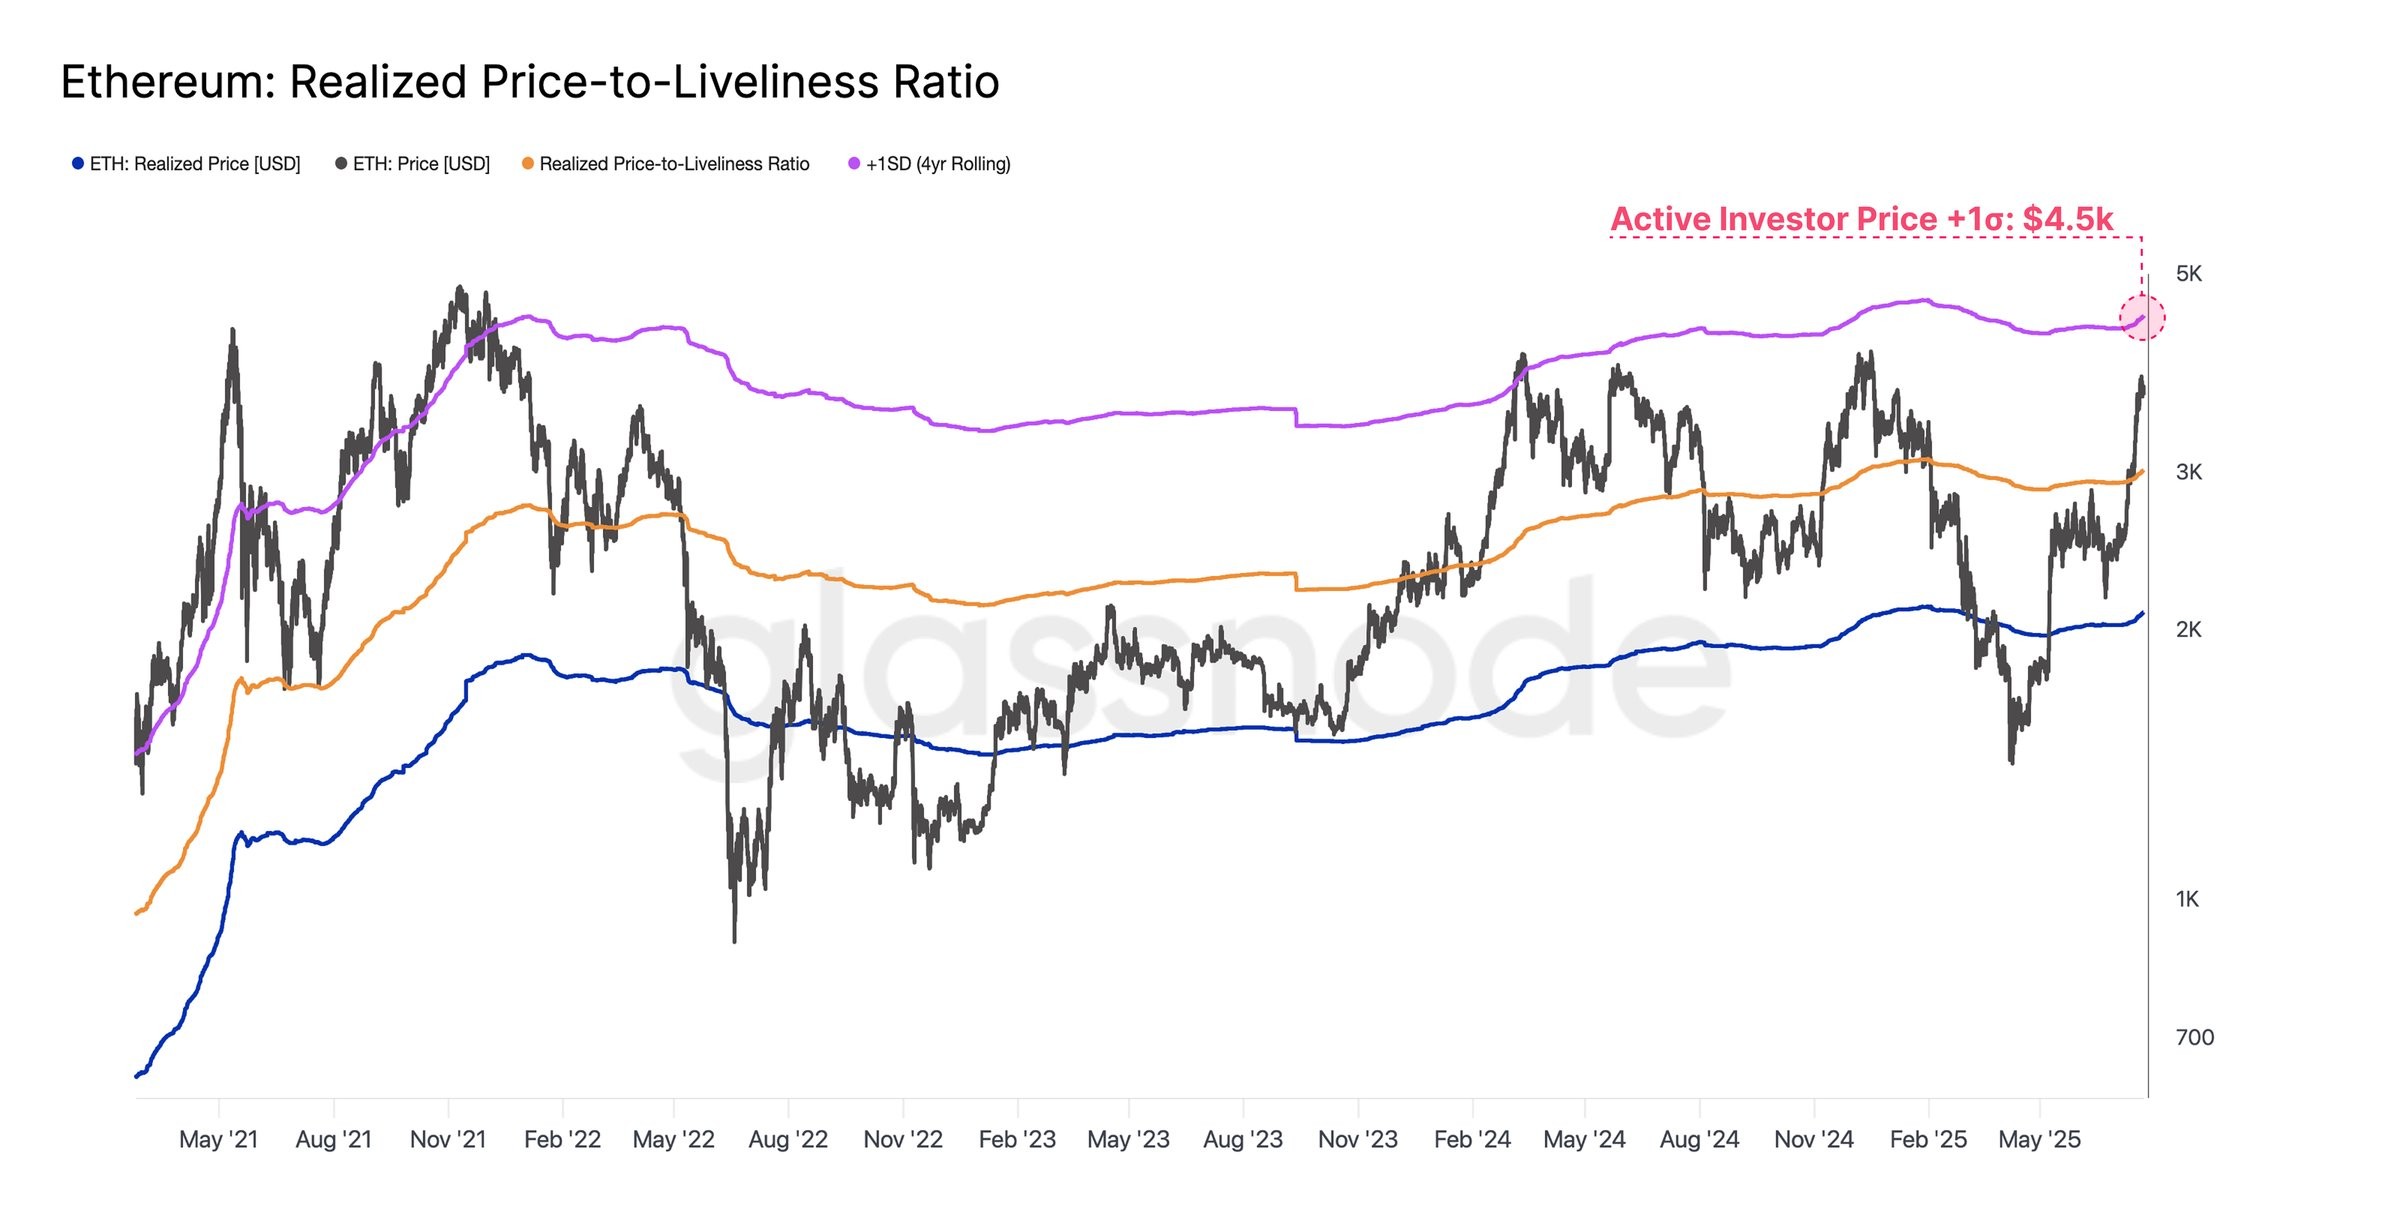 Ether realized price bands. Source: Glassnode/X
Shift in Market Interest Evident in Futures Volume
Ether perpetual futures volume has recently surpassed Bitcoin for the first time since 2022, signaling a major shift in trader focus toward ETH. This volume dominance reflects growing confidence and interest in Ethereum’s market potential. A prominent trader known as Byzantine General noted a strong bullish sentiment, stating, “ETH refuses to print any significant correction… It’s looking like a just f***ing send it moment.”
Supporting this bullish outlook, liquidation data reveals a dense cluster of short liquidations just above $4,000. A decisive move beyond this level could trigger liquidations totaling up to $930 million, potentially propelling ETH toward the $4,500 target.
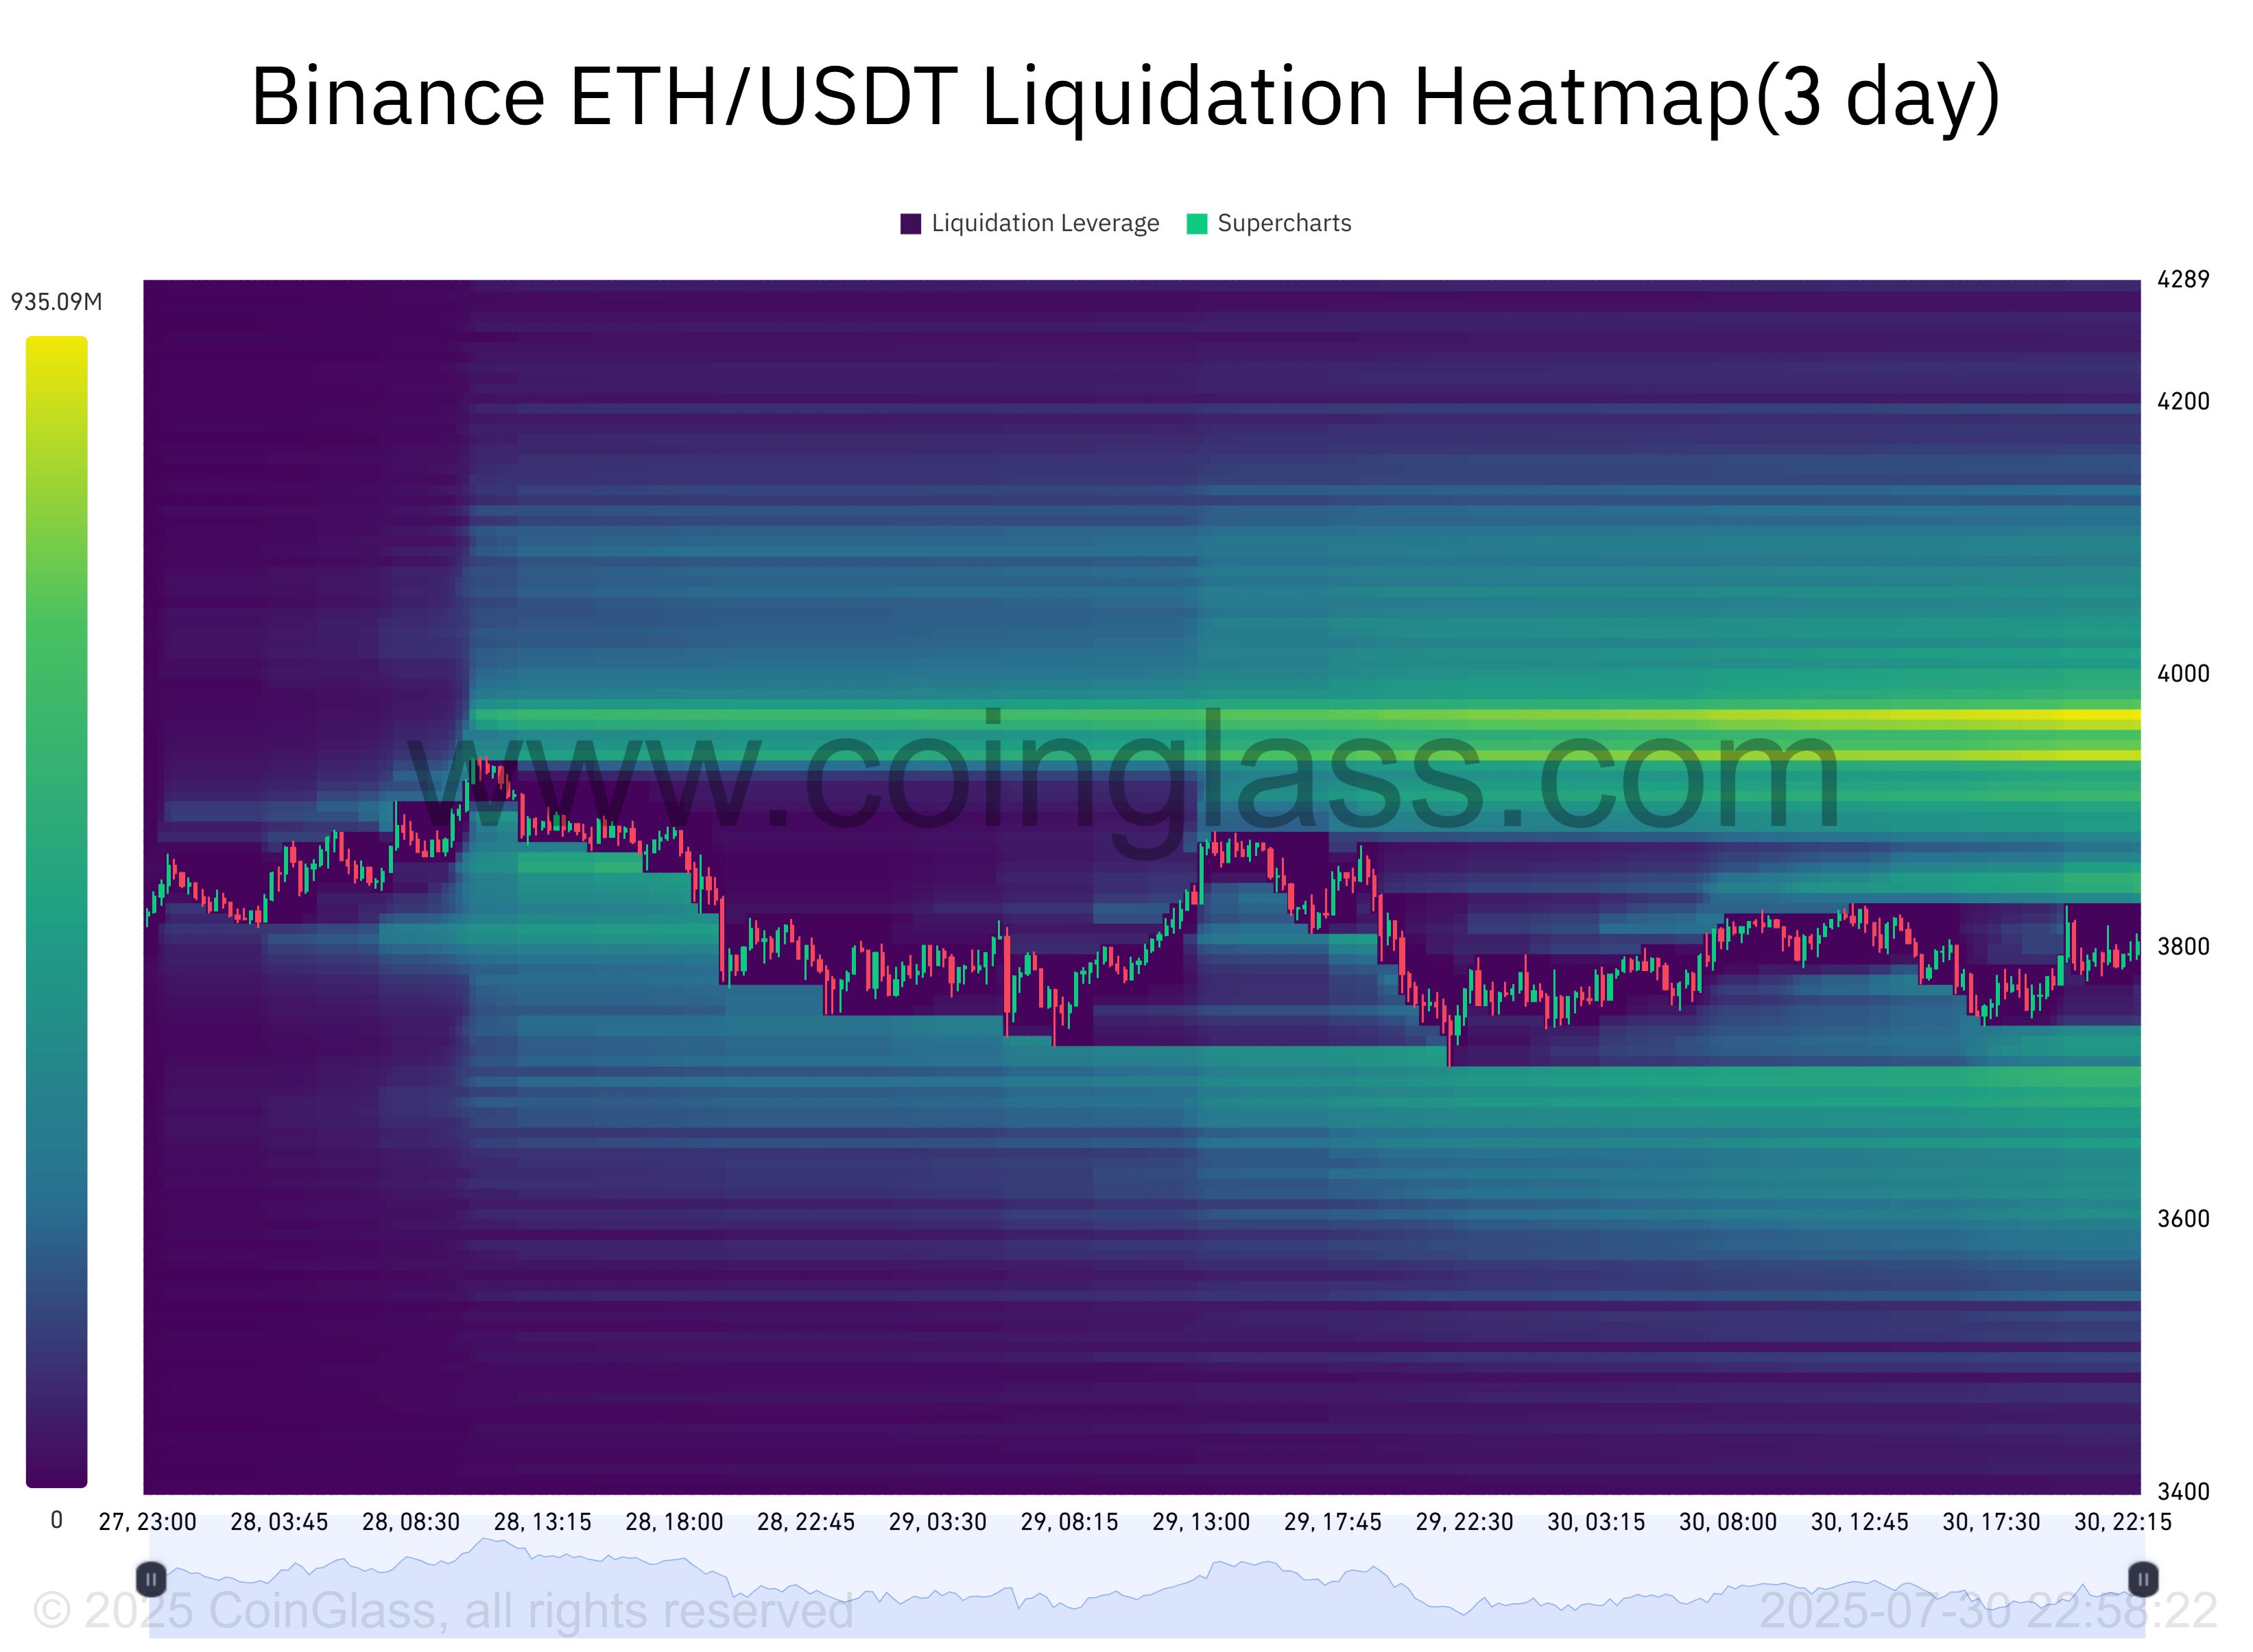 ETH/USDT Liquidation heatmap 3-day. Source: CoinGlass
What Are the Bearish RSI Divergences Signaling for ETH?
Despite bullish momentum, bearish RSI divergences on four-hour and daily charts indicate potential short-term exhaustion. While ETH price has made new local highs, the relative strength index (RSI) has not confirmed these moves, a classic sign of weakening buying pressure.
This divergence pattern resembles previous local tops and suggests a possible pullback if ETH fails to break convincingly above $4,000 with strong volume. The daily chart shows a persistent bearish divergence since ETH surpassed $3,500, highlighting ongoing caution among traders.
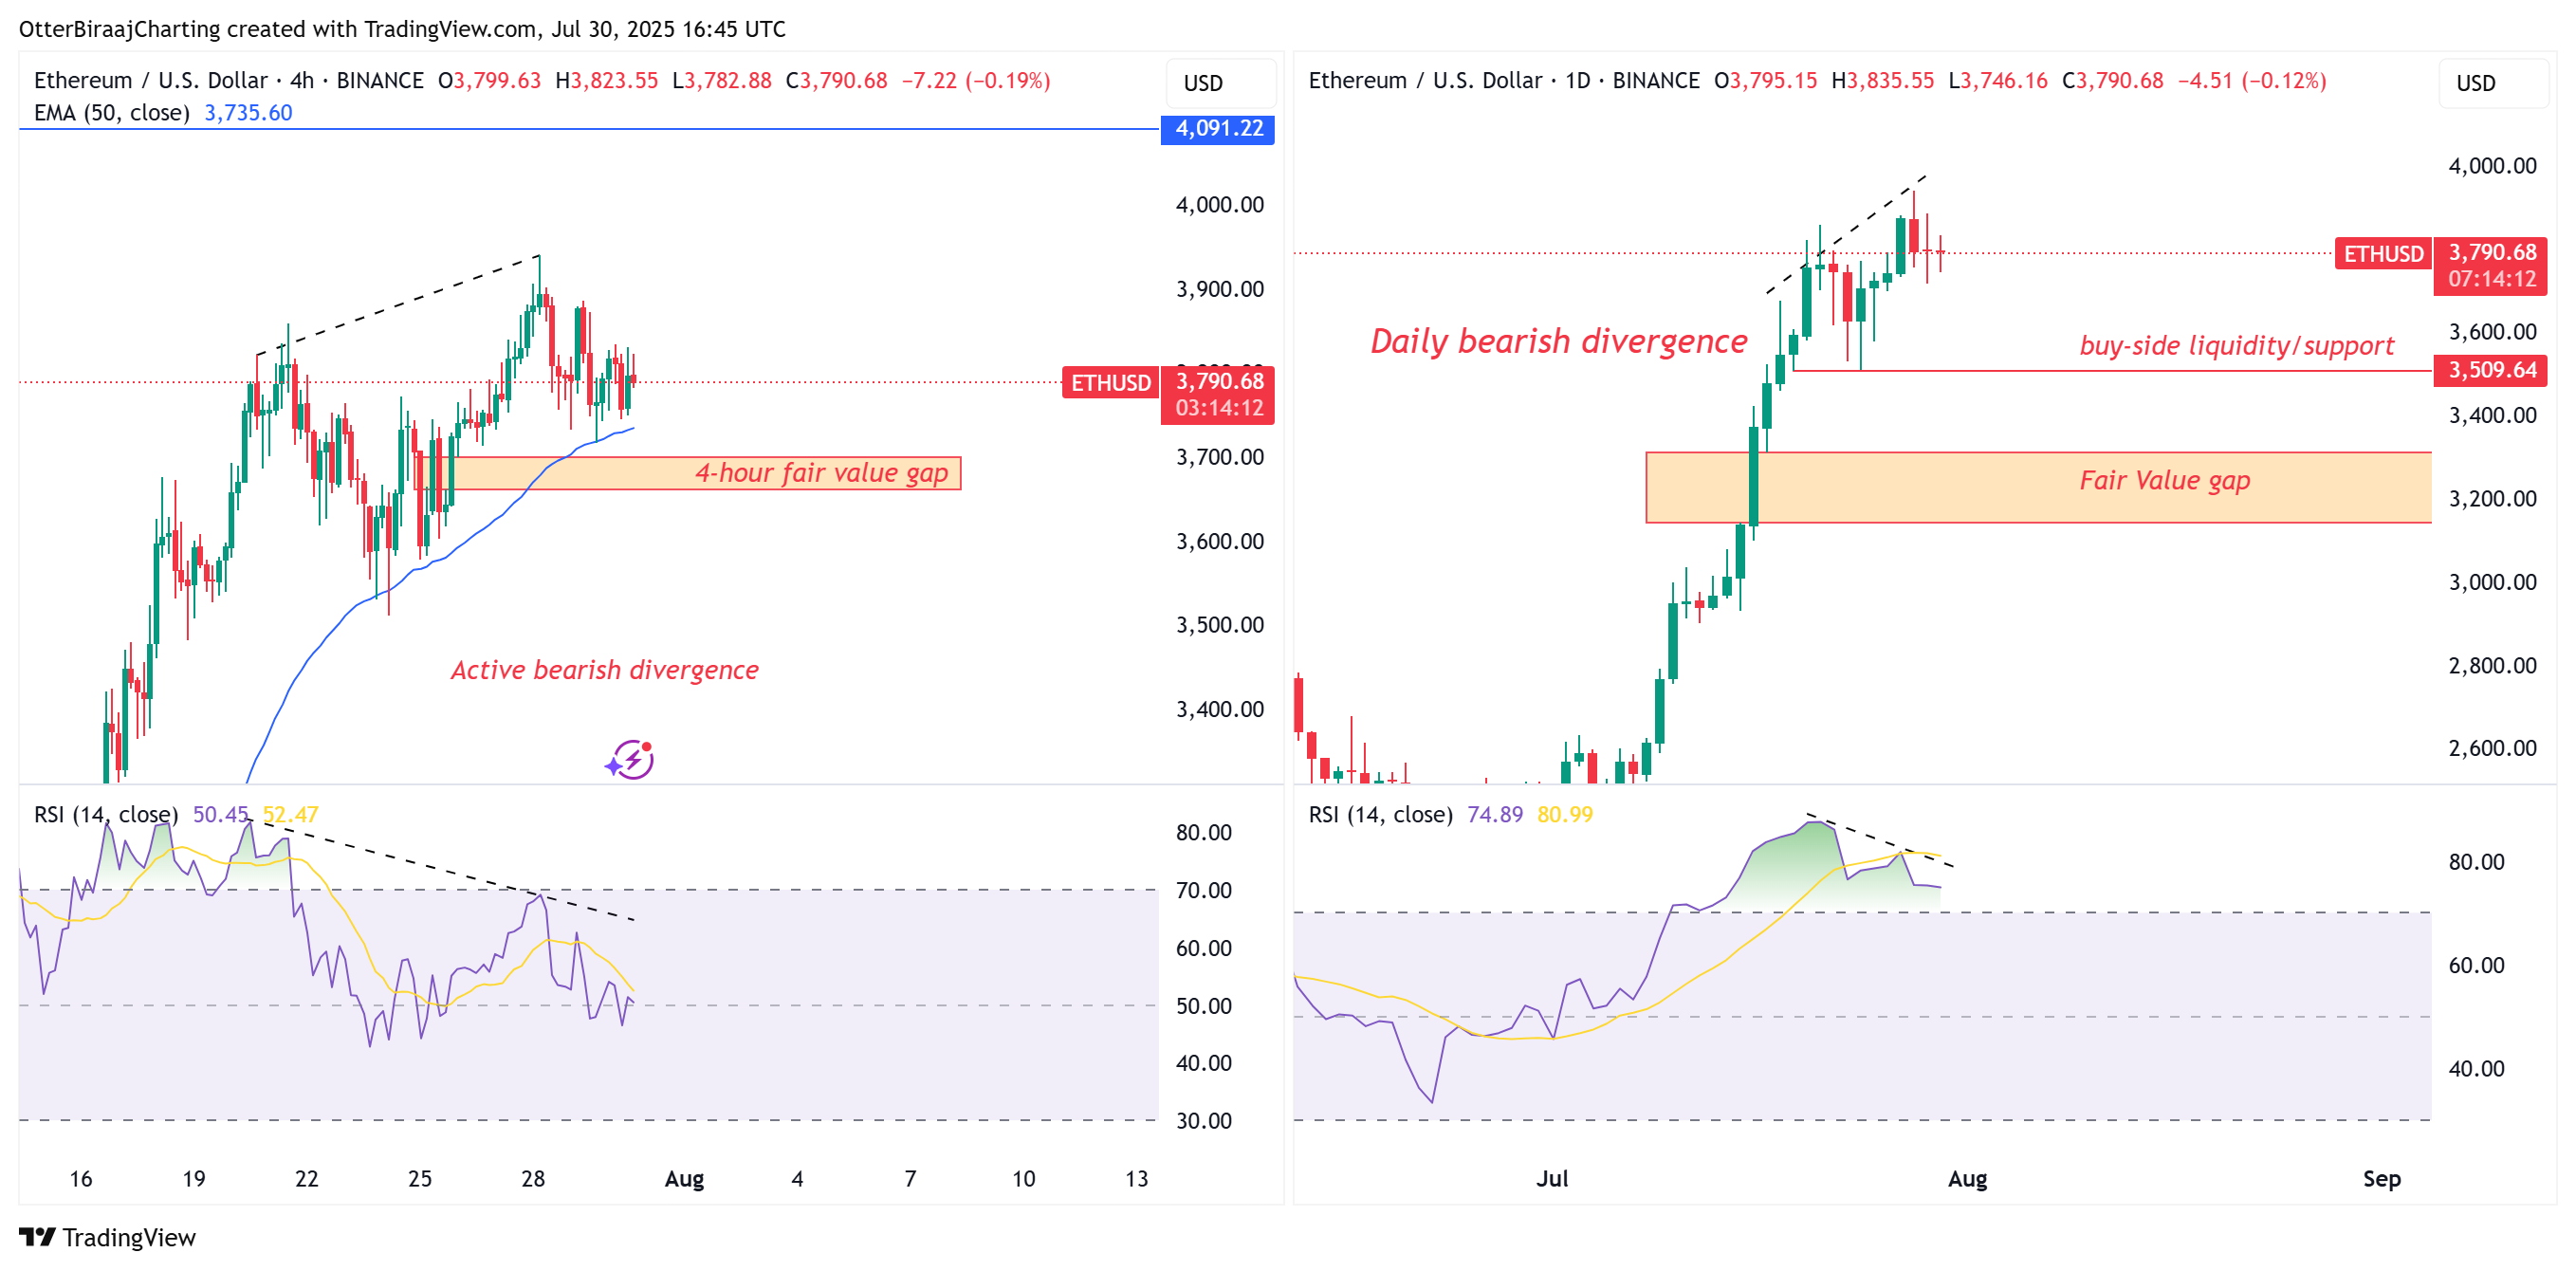 Ether four-hour, one-day chart bearish divergences. Source: Cointelegraph/TradingView
If a correction occurs, immediate support is expected just below $3,700, where a narrow fair value gap (FVG) exists. A deeper pullback could test the longer-term FVG between $3,200 and $3,300, risking a bearish structural break.
How Does This Impact Ethereum Traders?
Traders should monitor volume and RSI signals closely. A clean breakout above $4,000 could trigger significant short liquidations and a rapid price surge toward $4,500. Conversely, failure to sustain momentum may result in a short-term correction to key support zones.
Key Takeaways
- ETH’s active realized price band near $4,500 is a critical resistance level. Historical data confirms its significance as a price ceiling.
- Ether perpetual futures volume surpassing Bitcoin signals shifting market dynamics. This highlights increased trader interest in ETH.
- Bearish RSI divergences warn of possible short-term correction. Traders should watch for volume confirmation above $4,000.
Conclusion
ETH onchain data points to a strong rally potential toward $4,500, driven by shifting market interest and liquidation dynamics. However, bearish RSI divergences introduce caution for a possible short-term pullback below $4,000. Traders must balance optimism with technical signals to navigate upcoming price movements effectively.
Frequently Asked Questions
What does ETH’s $4,500 target mean for investors?
The $4,500 level represents a historically significant resistance based on active realized price data. A breakout above this could trigger strong bullish momentum but also increased volatility.
Why is there concern about a short-term ETH correction?
Bearish RSI divergences on multiple timeframes suggest that buying momentum may be weakening, increasing the likelihood of a short-term price pullback below $4,000.
-
ETH onchain data reveals a strong rally potential to $4,500, highlighting key resistance and market shifts.
-
Futures volume dominance by Ether over Bitcoin signals growing trader confidence and market interest.
-
Bearish RSI divergences caution traders about possible short-term corrections, emphasizing the need for careful analysis.
ETH onchain data forecasts a $4,500 rally with caution on short-term RSI bearish signals. Stay informed with COINOTAG’s expert crypto insights.
ETH Onchain Data Highlights $4,500 Rally Potential
Ether (ETH) has consistently traded just below the $4,000 resistance since December 2025, with traders closely watching for a breakout. The +1σ active realized price band, currently near $4,500, represents a key target for bulls. This metric tracks the average cost of ETH actively exchanged on the blockchain, serving as a vital indicator of market sentiment and potential price ceilings.
Historical data from Glassnode shows this level acted as a strong resistance during the March 2024 peak and the 2020–21 bull cycle. A sustained move above this band has previously triggered rapid price surges but also increased volatility risks.
Ether realized price bands. Source: Glassnode/X
Shift in Market Interest Evident in Futures Volume
Ether perpetual futures volume has recently surpassed Bitcoin for the first time since 2022, signaling a major shift in trader focus toward ETH. This volume dominance reflects growing confidence and interest in Ethereum’s market potential. A prominent trader known as Byzantine General noted a strong bullish sentiment, stating, “ETH refuses to print any significant correction… It’s looking like a just f***ing send it moment.”
Supporting this bullish outlook, liquidation data reveals a dense cluster of short liquidations just above $4,000. A decisive move beyond this level could trigger liquidations totaling up to $930 million, potentially propelling ETH toward the $4,500 target.
ETH/USDT Liquidation heatmap 3-day. Source: CoinGlass
What Are the Bearish RSI Divergences Signaling for ETH?
Despite bullish momentum, bearish RSI divergences on four-hour and daily charts indicate potential short-term exhaustion. While ETH price has made new local highs, the relative strength index (RSI) has not confirmed these moves, a classic sign of weakening buying pressure.
This divergence pattern resembles previous local tops and suggests a possible pullback if ETH fails to break convincingly above $4,000 with strong volume. The daily chart shows a persistent bearish divergence since ETH surpassed $3,500, highlighting ongoing caution among traders.
Ether four-hour, one-day chart bearish divergences. Source: Cointelegraph/TradingView
If a correction occurs, immediate support is expected just below $3,700, where a narrow fair value gap (FVG) exists. A deeper pullback could test the longer-term FVG between $3,200 and $3,300, risking a bearish structural break.
How Does This Impact Ethereum Traders?
Traders should monitor volume and RSI signals closely. A clean breakout above $4,000 could trigger significant short liquidations and a rapid price surge toward $4,500. Conversely, failure to sustain momentum may result in a short-term correction to key support zones.
Key Takeaways
- ETH’s active realized price band near $4,500 is a critical resistance level. Historical data confirms its significance as a price ceiling.
- Ether perpetual futures volume surpassing Bitcoin signals shifting market dynamics. This highlights increased trader interest in ETH.
- Bearish RSI divergences warn of possible short-term correction. Traders should watch for volume confirmation above $4,000.
Conclusion
ETH onchain data points to a strong rally potential toward $4,500, driven by shifting market interest and liquidation dynamics. However, bearish RSI divergences introduce caution for a possible short-term pullback below $4,000. Traders must balance optimism with technical signals to navigate upcoming price movements effectively.