
Stellar (XLM) Bull Flag Breakout Shows Cracks as Momentum Fades

XLM price remains above the bull flag breakout, but net flows are weakening, OBV and CMF are losing strength, and key support at $0.41 is at risk. Without fresh buying pressure, the breakout could fail.
Stellar (XLM) has had a strong July, rallying 77% this month. But in the last seven days, it’s given up nearly 10%, and the picture on the charts is looking less convincing.
On the two-day chart, XLM price initially broke out of a bull flag, a continuation pattern that usually signals another upward leg, yet the candles that followed have mostly turned red. Without new buying pressure, the breakout could already be faltering.
Net Flows: The Only Tailwind is Losing Strength
Exchange net flows have played a big role in XLM’s recent rally. Earlier this month, more coins were leaving exchanges than entering, reducing available supply and fueling upward momentum.
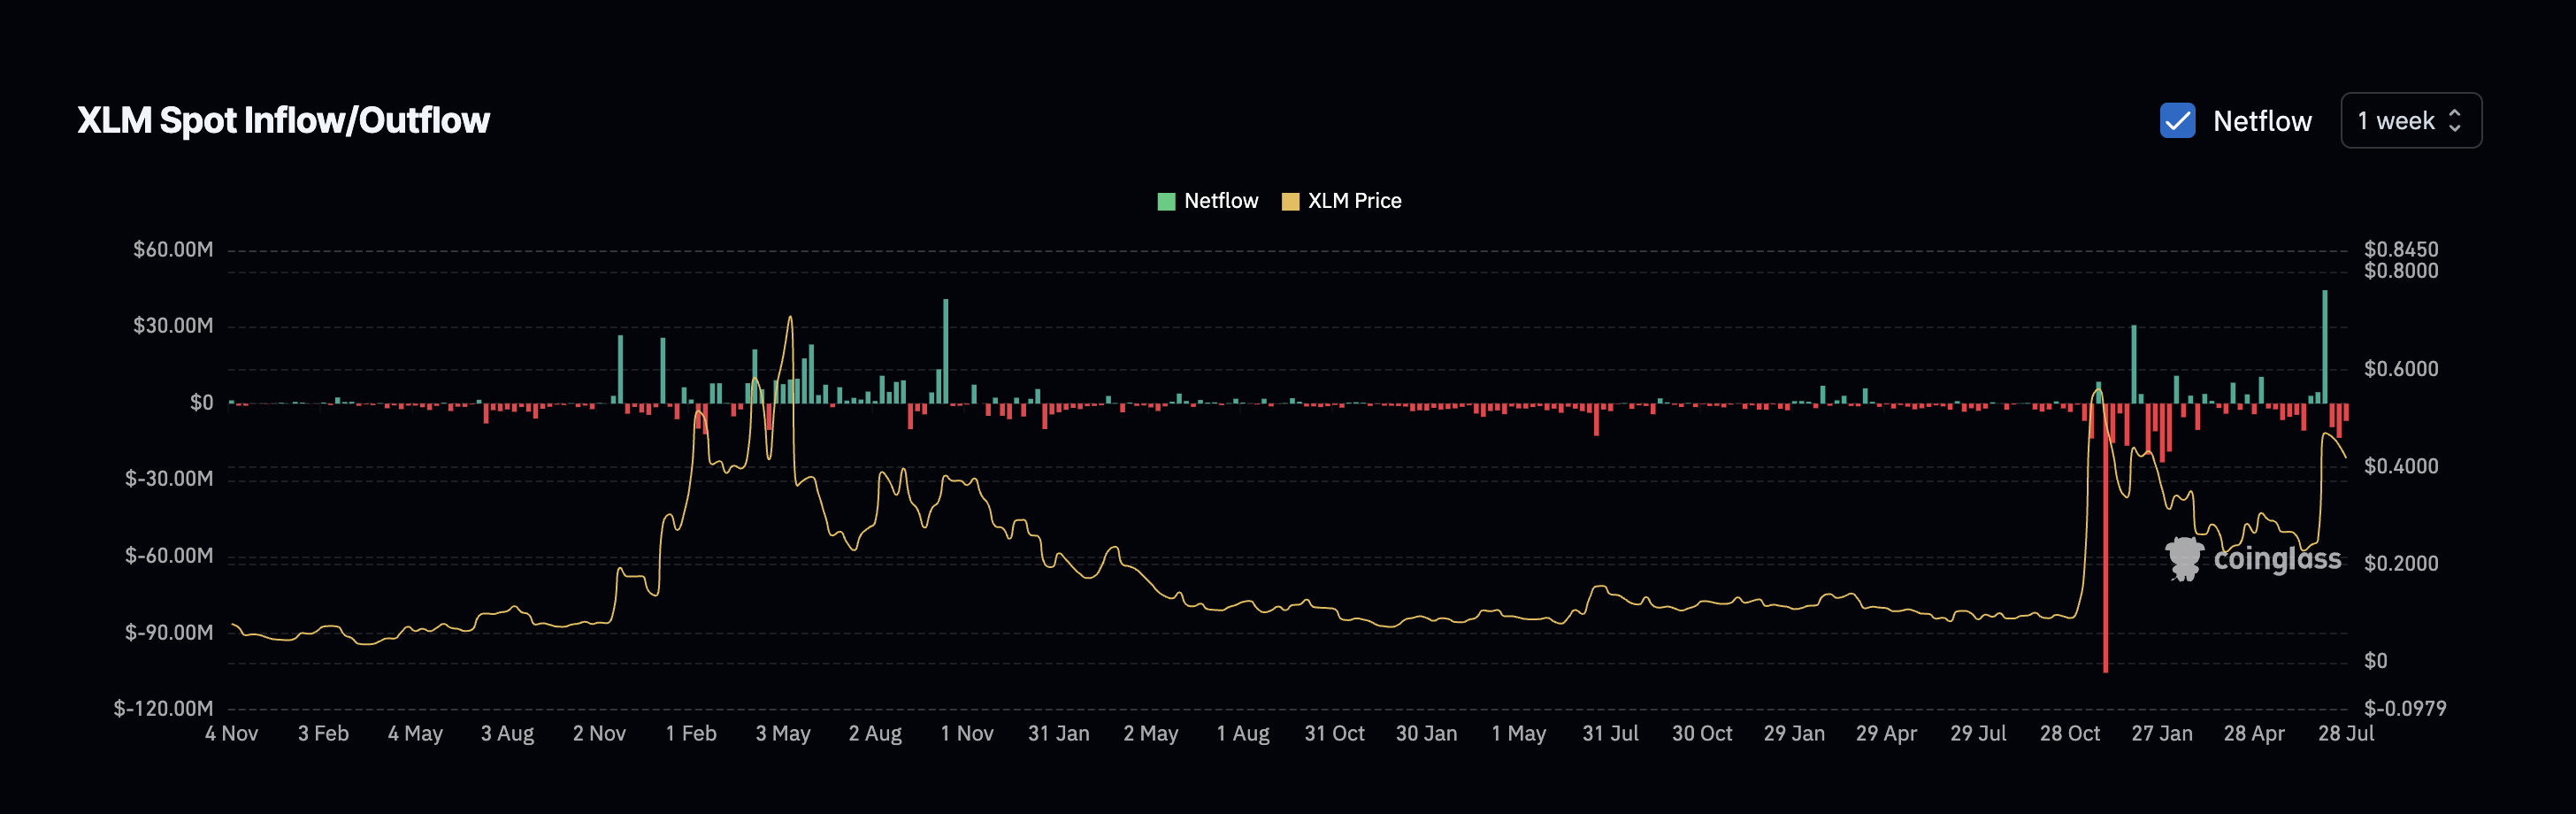 Stellar price and netflows:
Coinglass
Stellar price and netflows:
Coinglass
Over the past week, that trend has weakened noticeably, with net outflows sliding closer to neutral levels. The lack of sustained withdrawals hints that long-term holders aren’t adding fresh buying pressure anymore, leaving the breakout without much support.
For token TA and market updates: Want more token insights like this? Sign up for Editor Harsh Notariya’s Daily Crypto Newsletter
Weak Money Flow Adds to Concerns
Volume data on the two-day timeframe reinforces this fading momentum. On-Balance Volume (OBV), which tracks cumulative buying and selling pressure, has been drifting lower despite the XLM price breakout, showing that large buyers aren’t stepping in with conviction.
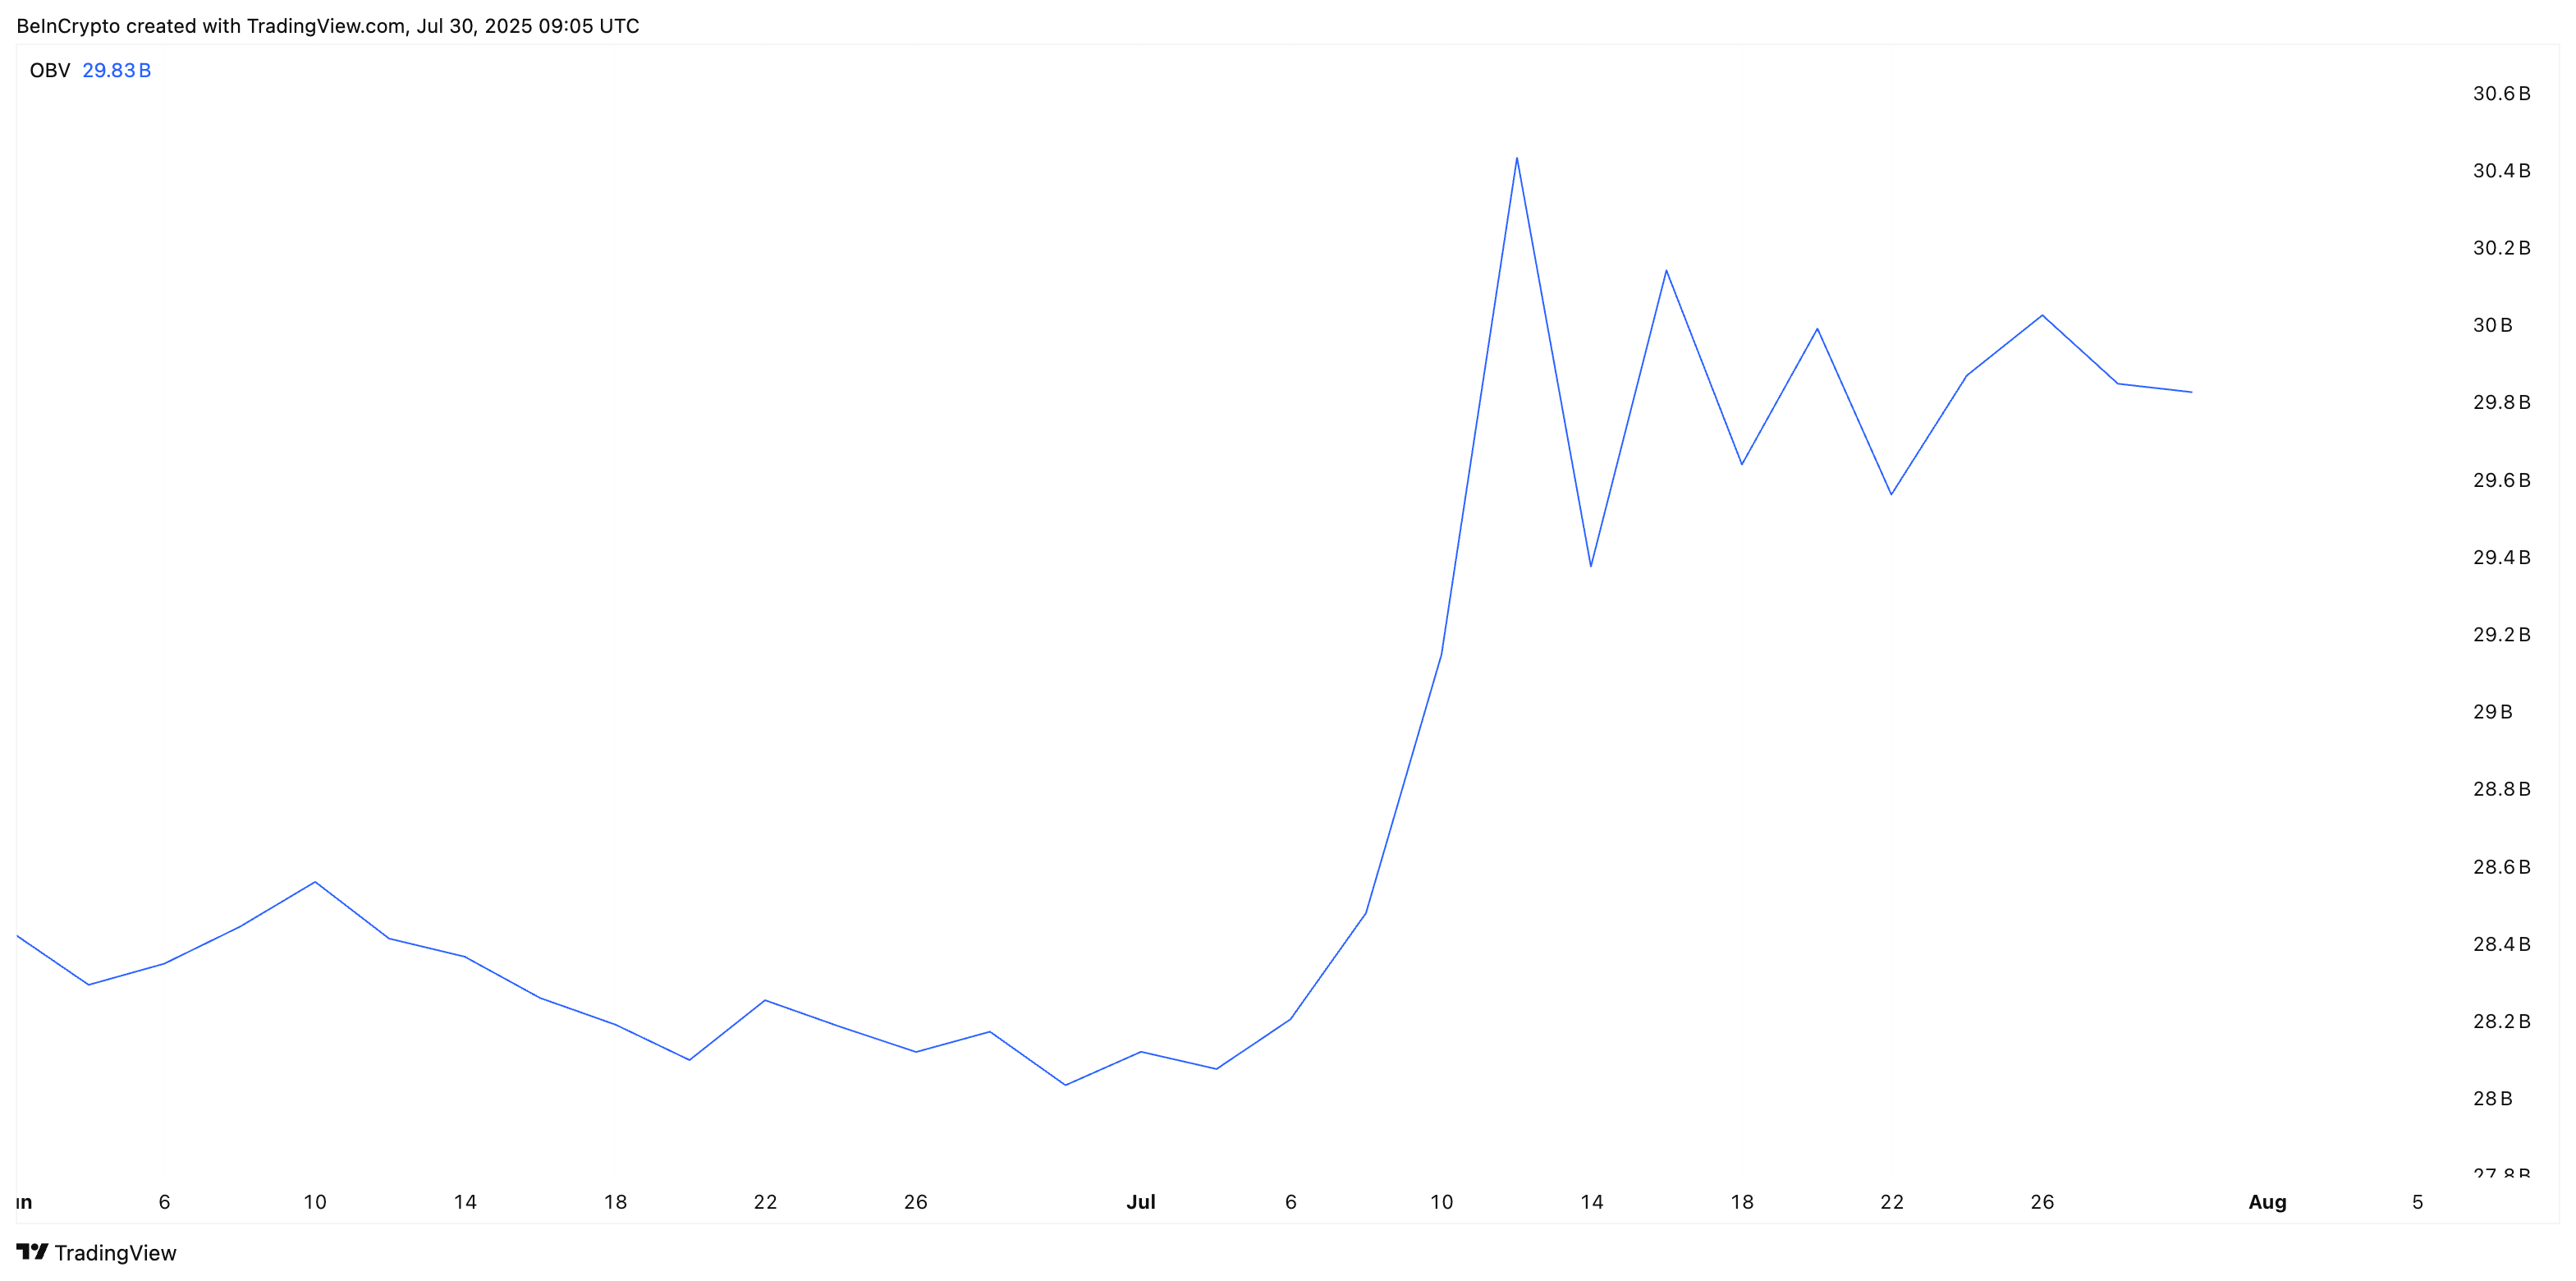 XLM and the On Balance Volume metric:
TradingView
XLM and the On Balance Volume metric:
TradingView
Similarly, the Chaikin Money Flow (CMF) has dropped sharply, falling from highs around 0.35 in early July to roughly 0.12 now. CMF gauges whether actual money is flowing in or out of an asset, and a slide like this indicates weakening demand.
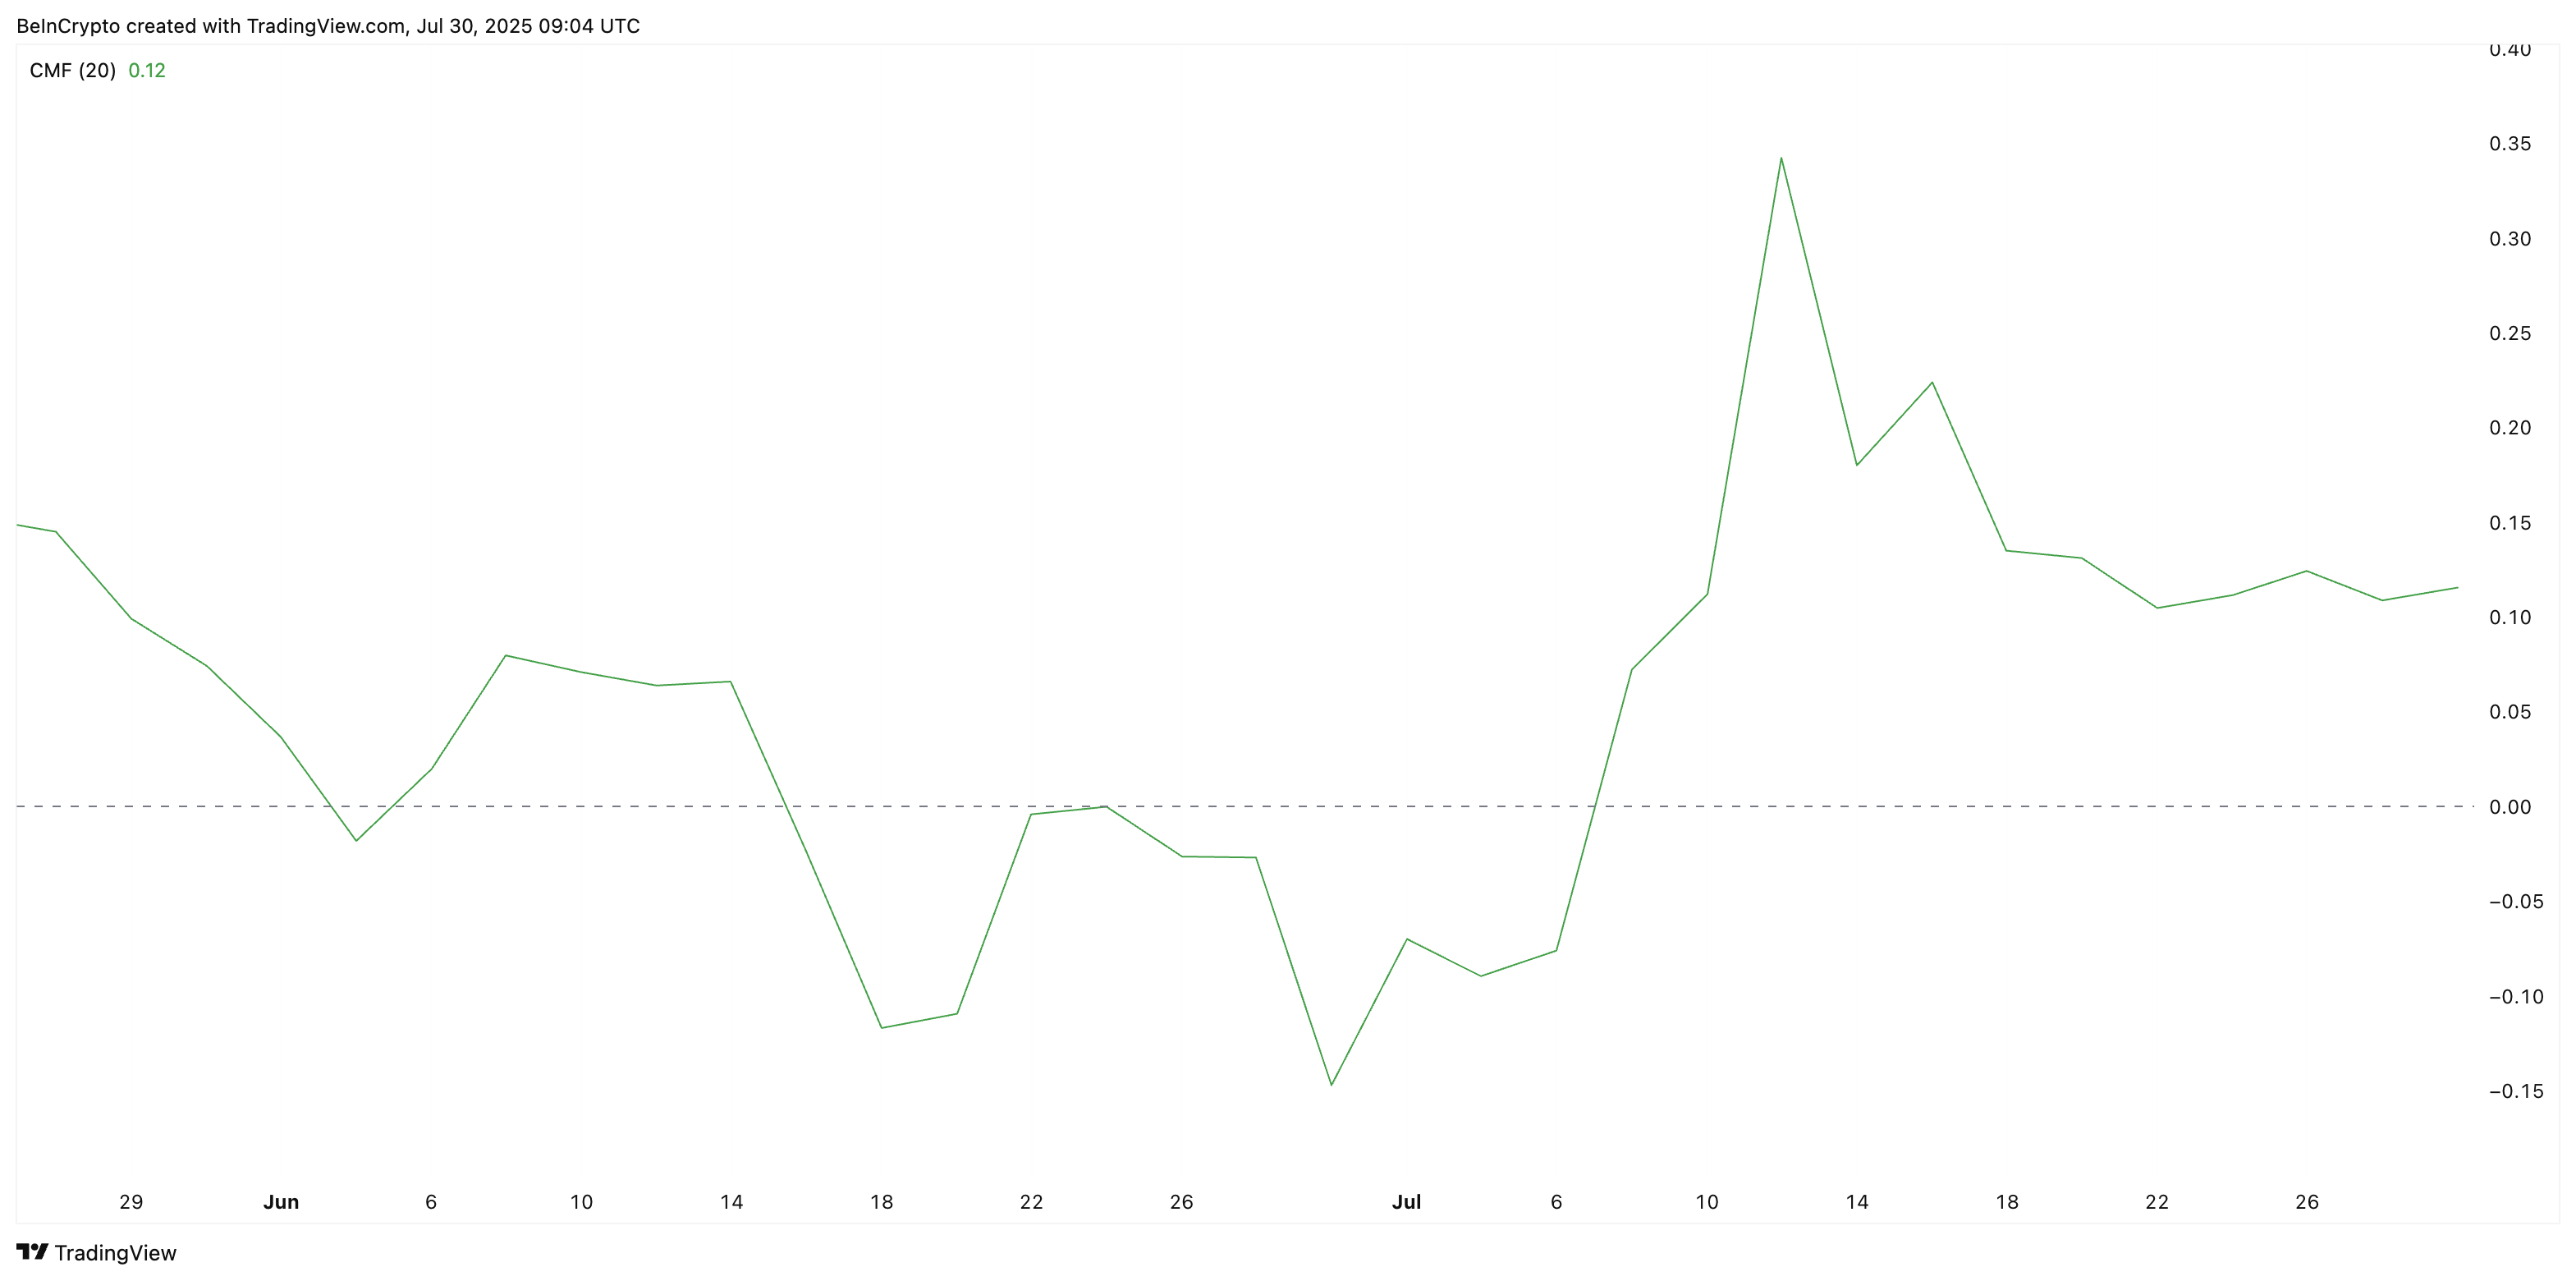 Chaikin money flow indicator showing XLM price weakness:
TradingView
Chaikin money flow indicator showing XLM price weakness:
TradingView
Both metrics suggest that the bullish breakout may lack the capital backing needed to extend higher.
Stellar (XLM) Price Still Above Flag, but Invalidation Levels Are Clear
The XLM price is currently holding above the bull flag breakout line, trading near $0.41. However, momentum is fragile. A dip below $0.41 would put the Stellar (XLM) price back inside the pattern, and a break under $0.35 would erase almost half of the 133% rally that built the flagpole, effectively invalidating the breakout structure.
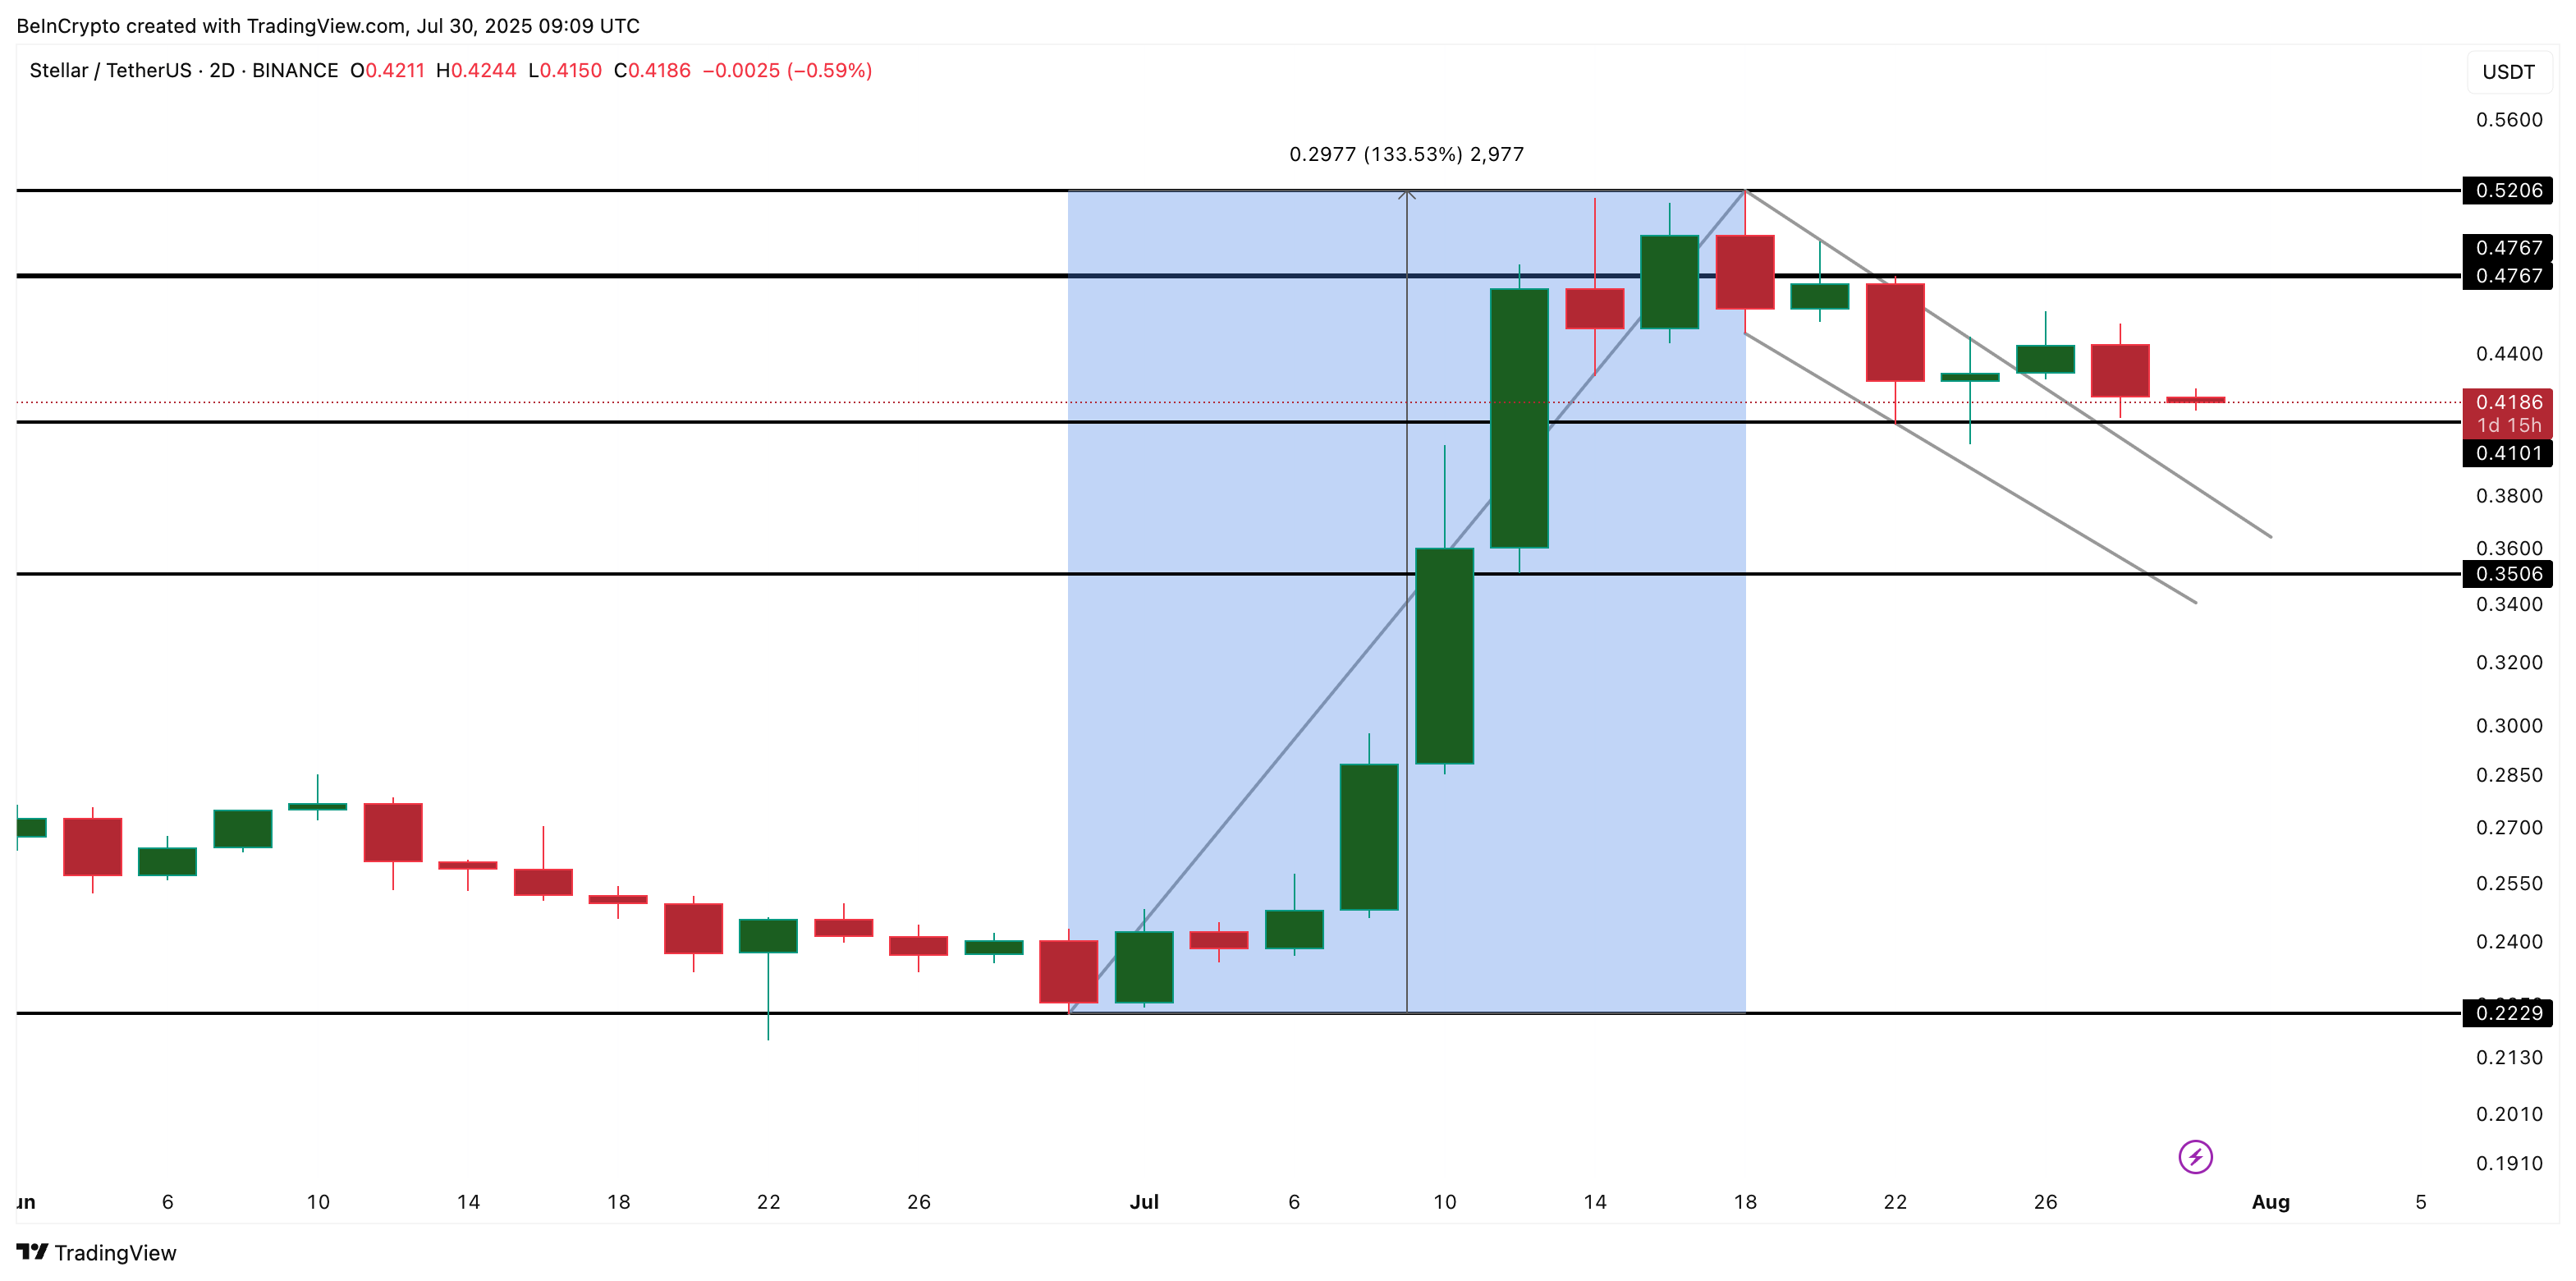 XLM price analysis:
TradingView
XLM price analysis:
TradingView
For bulls to regain control, the XLM price needs a decisive move back above $0.47, backed by stronger inflows and renewed volume. Without that, the recent breakout risks becoming just another failed attempt to push toward new highs.
Disclaimer: The content of this article solely reflects the author's opinion and does not represent the platform in any capacity. This article is not intended to serve as a reference for making investment decisions.
You may also like
Over $10 billion in market value evaporated in four trading days as CoreWeave (CRWV.US) debt risks trigger sell-off, but Deutsche Bank sees it as a buying opportunity
Deutsche Bank believes that the recent sell-off of CoreWeave lacks sufficient company fundamentals to justify it, and the sharp price correction has instead created a buying opportunity for investors.

Overnight US Stock Market | Inflation Pressure Continues to Rise, All Three Major Indexes Up, Dell (DELL.US) Down 6.8%
At the close of trading, the Dow Jones Industrial Average rose 557.51 points, or 1.08%, to 52,178.99 points; the S&P 500 Index gained 25.18 points, or 0.33%, to 7,744.12 points; and the Nasdaq Composite Index increased by 20.16 points, or 0.08%, to 26,713.03 points.
Interactive Brokers (IBKR.US) Q3 revenue increased by 16% year-on-year, announces over 70% increase in quarterly dividend
Driven by growth in net interest income and commission income, Interactive Brokers' Q3 net revenue increased by 16% year-on-year, with adjusted earnings per share rising by approximately 18% year-on-year.
CoreWeave default probability exceeds 60%! Jensen Huang "puts out the fire": Financing costs are declining, no need for NVIDIA to backstop
After Jensen Huang's speech, CoreWeave's stock price, which had fallen by as much as 9.5% in early trading, turned positive. The company's five-year CDS rose above 1,190 basis points during Thursday’s session, a historical high reflecting the cost of debt default protection, while yields on some of its corporate bonds have climbed above 15% to 16%. The five-year CDS spreads for Oracle, Amazon, Google’s parent company, and Meta are all at historically high levels. Deutsche Bank analysts believe that as the AI capital expenditure cycle is increasingly supported by debt rather than free cash flow, investors must place greater emphasis on signals from the credit market. Overall, while AI-related financing costs are not yet excessively high, worrying signs have begun to emerge.

Crypto prices
More


