
Bitcoin Price Sets Sights on a New Climb – Momentum Building Again

Bitcoin price is still above the $117,500 support zone. BTC is rising and might attempt to clear the $118,600 resistance zone to gain bullish momentum.
- Bitcoin started a decent upward move from the $116,000 zone.
- The price is trading near $118,500 and the 100 hourly Simple moving average.
- There is a bearish trend line forming with resistance at $118,620 on the hourly chart of the BTC/USD pair (data feed from Kraken).
- The pair might start another increase if it clears the $118,620 resistance zone.
Bitcoin Price Eyes Upside Break
Bitcoin price started a downside correction from the $119,796 high. BTC declined below the $119,000 and $118,500 support levels to enter a short-term bearish zone.
The bears pushed the price below the 50% Fib retracement level of the upward move from the $114,733 swing low to the $119,796 high. The decline gained pace and the price even spiked toward the $116,000 support zone where the bulls appeared.
They protected the 76.4% Fib retracement level of the upward move from the $114,733 swing low to the $119,796 high. The price is again rising above $118,000. Bitcoin is now trading near $118,500 and the 100 hourly Simple moving average.
Immediate resistance on the upside is near the $118,620 level. There is also a bearish trend line forming with resistance at $118,620 on the hourly chart of the BTC/USD pair.
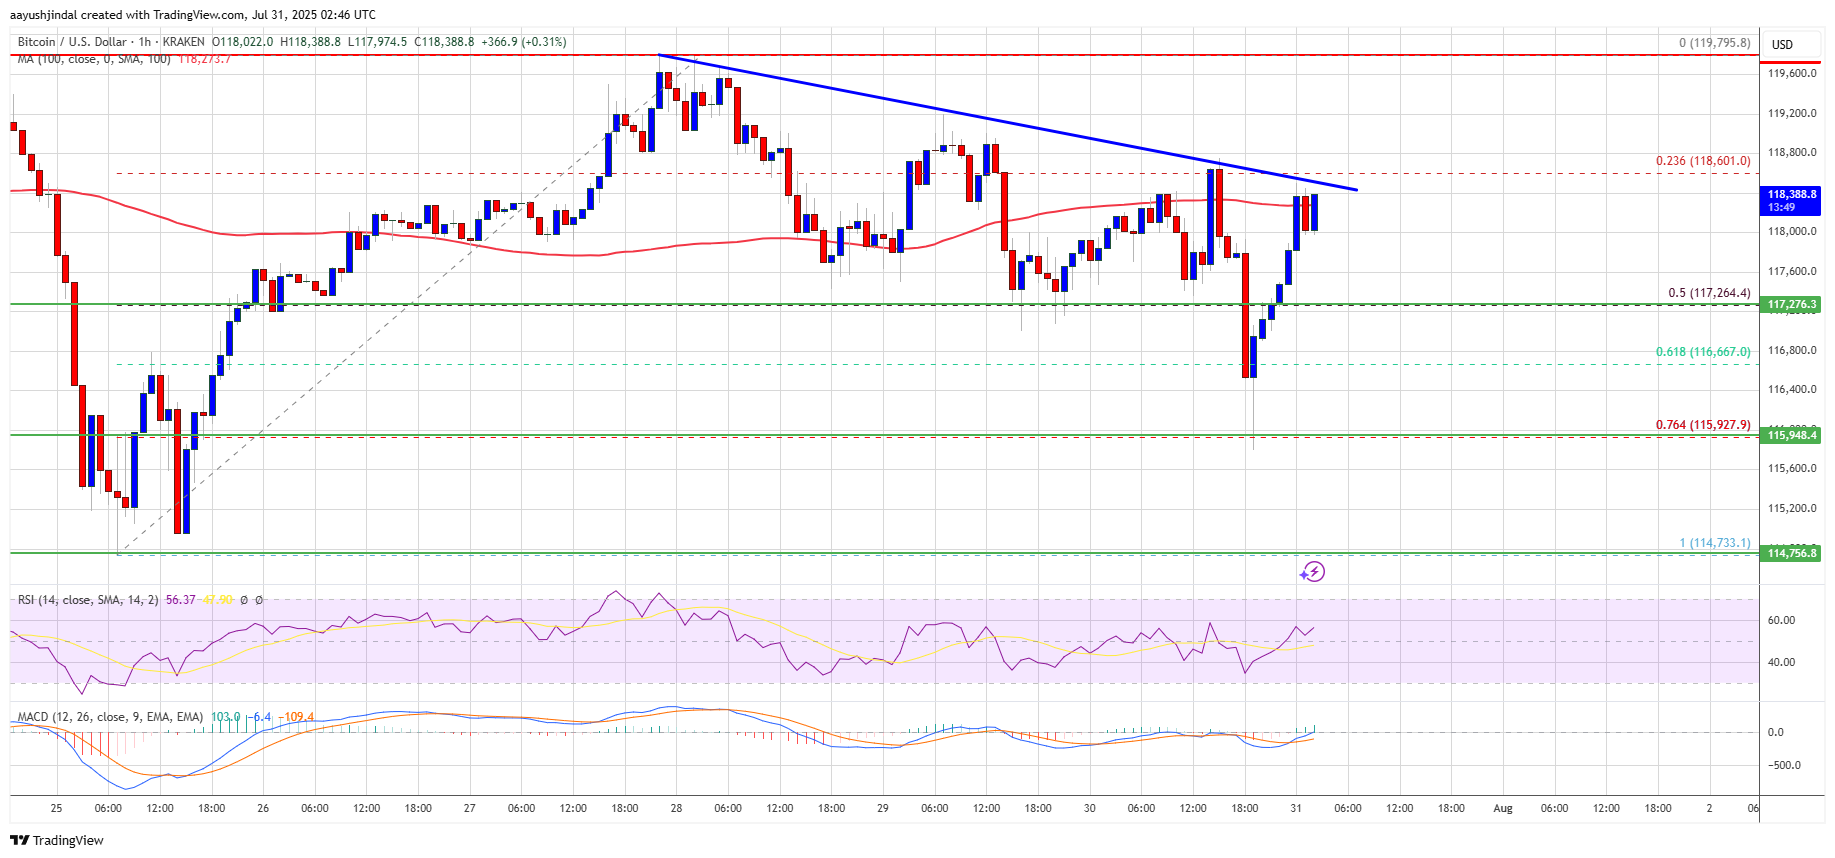
The first key resistance is near the $119,200 level. The next resistance could be $119,800. A close above the $119,800 resistance might send the price further higher. In the stated case, the price could rise and test the $120,500 resistance level. Any more gains might send the price toward the $122,500 level. The main target could be $123,200.
Another Decline In BTC?
If Bitcoin fails to rise above the $118,620 resistance zone, it could start another decline. Immediate support is near the $117,500 level. The first major support is near the $116,250 level.
The next support is now near the $116,000 zone. Any more losses might send the price toward the $114,500 support in the near term. The main support sits at $113,500, below which BTC might continue to move down.
Technical indicators:
Hourly MACD – The MACD is now gaining pace in the bullish zone.
Hourly RSI (Relative Strength Index) – The RSI for BTC/USD is now above the 50 level.
Major Support Levels – $117,500, followed by $116,250.
Major Resistance Levels – $118,620 and $119,800.
Disclaimer: The content of this article solely reflects the author's opinion and does not represent the platform in any capacity. This article is not intended to serve as a reference for making investment decisions.
You may also like
Over $10 billion in market value evaporated in four trading days as CoreWeave (CRWV.US) debt risks trigger sell-off, but Deutsche Bank sees it as a buying opportunity
Deutsche Bank believes that the recent sell-off of CoreWeave lacks sufficient company fundamentals to justify it, and the sharp price correction has instead created a buying opportunity for investors.

Overnight US Stock Market | Inflation Pressure Continues to Rise, All Three Major Indexes Up, Dell (DELL.US) Down 6.8%
At the close of trading, the Dow Jones Industrial Average rose 557.51 points, or 1.08%, to 52,178.99 points; the S&P 500 Index gained 25.18 points, or 0.33%, to 7,744.12 points; and the Nasdaq Composite Index increased by 20.16 points, or 0.08%, to 26,713.03 points.
Interactive Brokers (IBKR.US) Q3 revenue increased by 16% year-on-year, announces over 70% increase in quarterly dividend
Driven by growth in net interest income and commission income, Interactive Brokers' Q3 net revenue increased by 16% year-on-year, with adjusted earnings per share rising by approximately 18% year-on-year.
CoreWeave default probability exceeds 60%! Jensen Huang "puts out the fire": Financing costs are declining, no need for NVIDIA to backstop
After Jensen Huang's speech, CoreWeave's stock price, which had fallen by as much as 9.5% in early trading, turned positive. The company's five-year CDS rose above 1,190 basis points during Thursday’s session, a historical high reflecting the cost of debt default protection, while yields on some of its corporate bonds have climbed above 15% to 16%. The five-year CDS spreads for Oracle, Amazon, Google’s parent company, and Meta are all at historically high levels. Deutsche Bank analysts believe that as the AI capital expenditure cycle is increasingly supported by debt rather than free cash flow, investors must place greater emphasis on signals from the credit market. Overall, while AI-related financing costs are not yet excessively high, worrying signs have begun to emerge.

Crypto prices
More


