
Shiba Inu Shows More Bark Than Bite as Bullish Breakout Stalls

Shiba Inu price action shows sellers regaining control despite a bullish wedge structure still holding up. With reserves climbing and buying momentum fading, SHIB risks losing its breakout chance unless key levels flip soon.
Shiba Inu’s price has been stuck in limbo, unable to make a decisive move higher even after a 15% monthly gain. Over the past week, SHIB barely moved 2%, in line with the broader market pullback.
Despite a bullish wedge pattern suggesting an eventual breakout, fresh data shows big holders and weak buyer activity are holding the token back.
Big Holders Send Tokens To Exchanges; Add To The Selling Pressure
One key sign that explains SHIB’s struggle is the spike in exchange reserves. On July 28, exchange wallets hit a monthly high of 84.9 trillion SHIB. This means big holders have been sending more of their tokens to exchanges, likely preparing to sell.
Even though the reserves have dropped marginally at the time of writing, there are still a lot of tokens on exchanges to cascade a deeper correction.
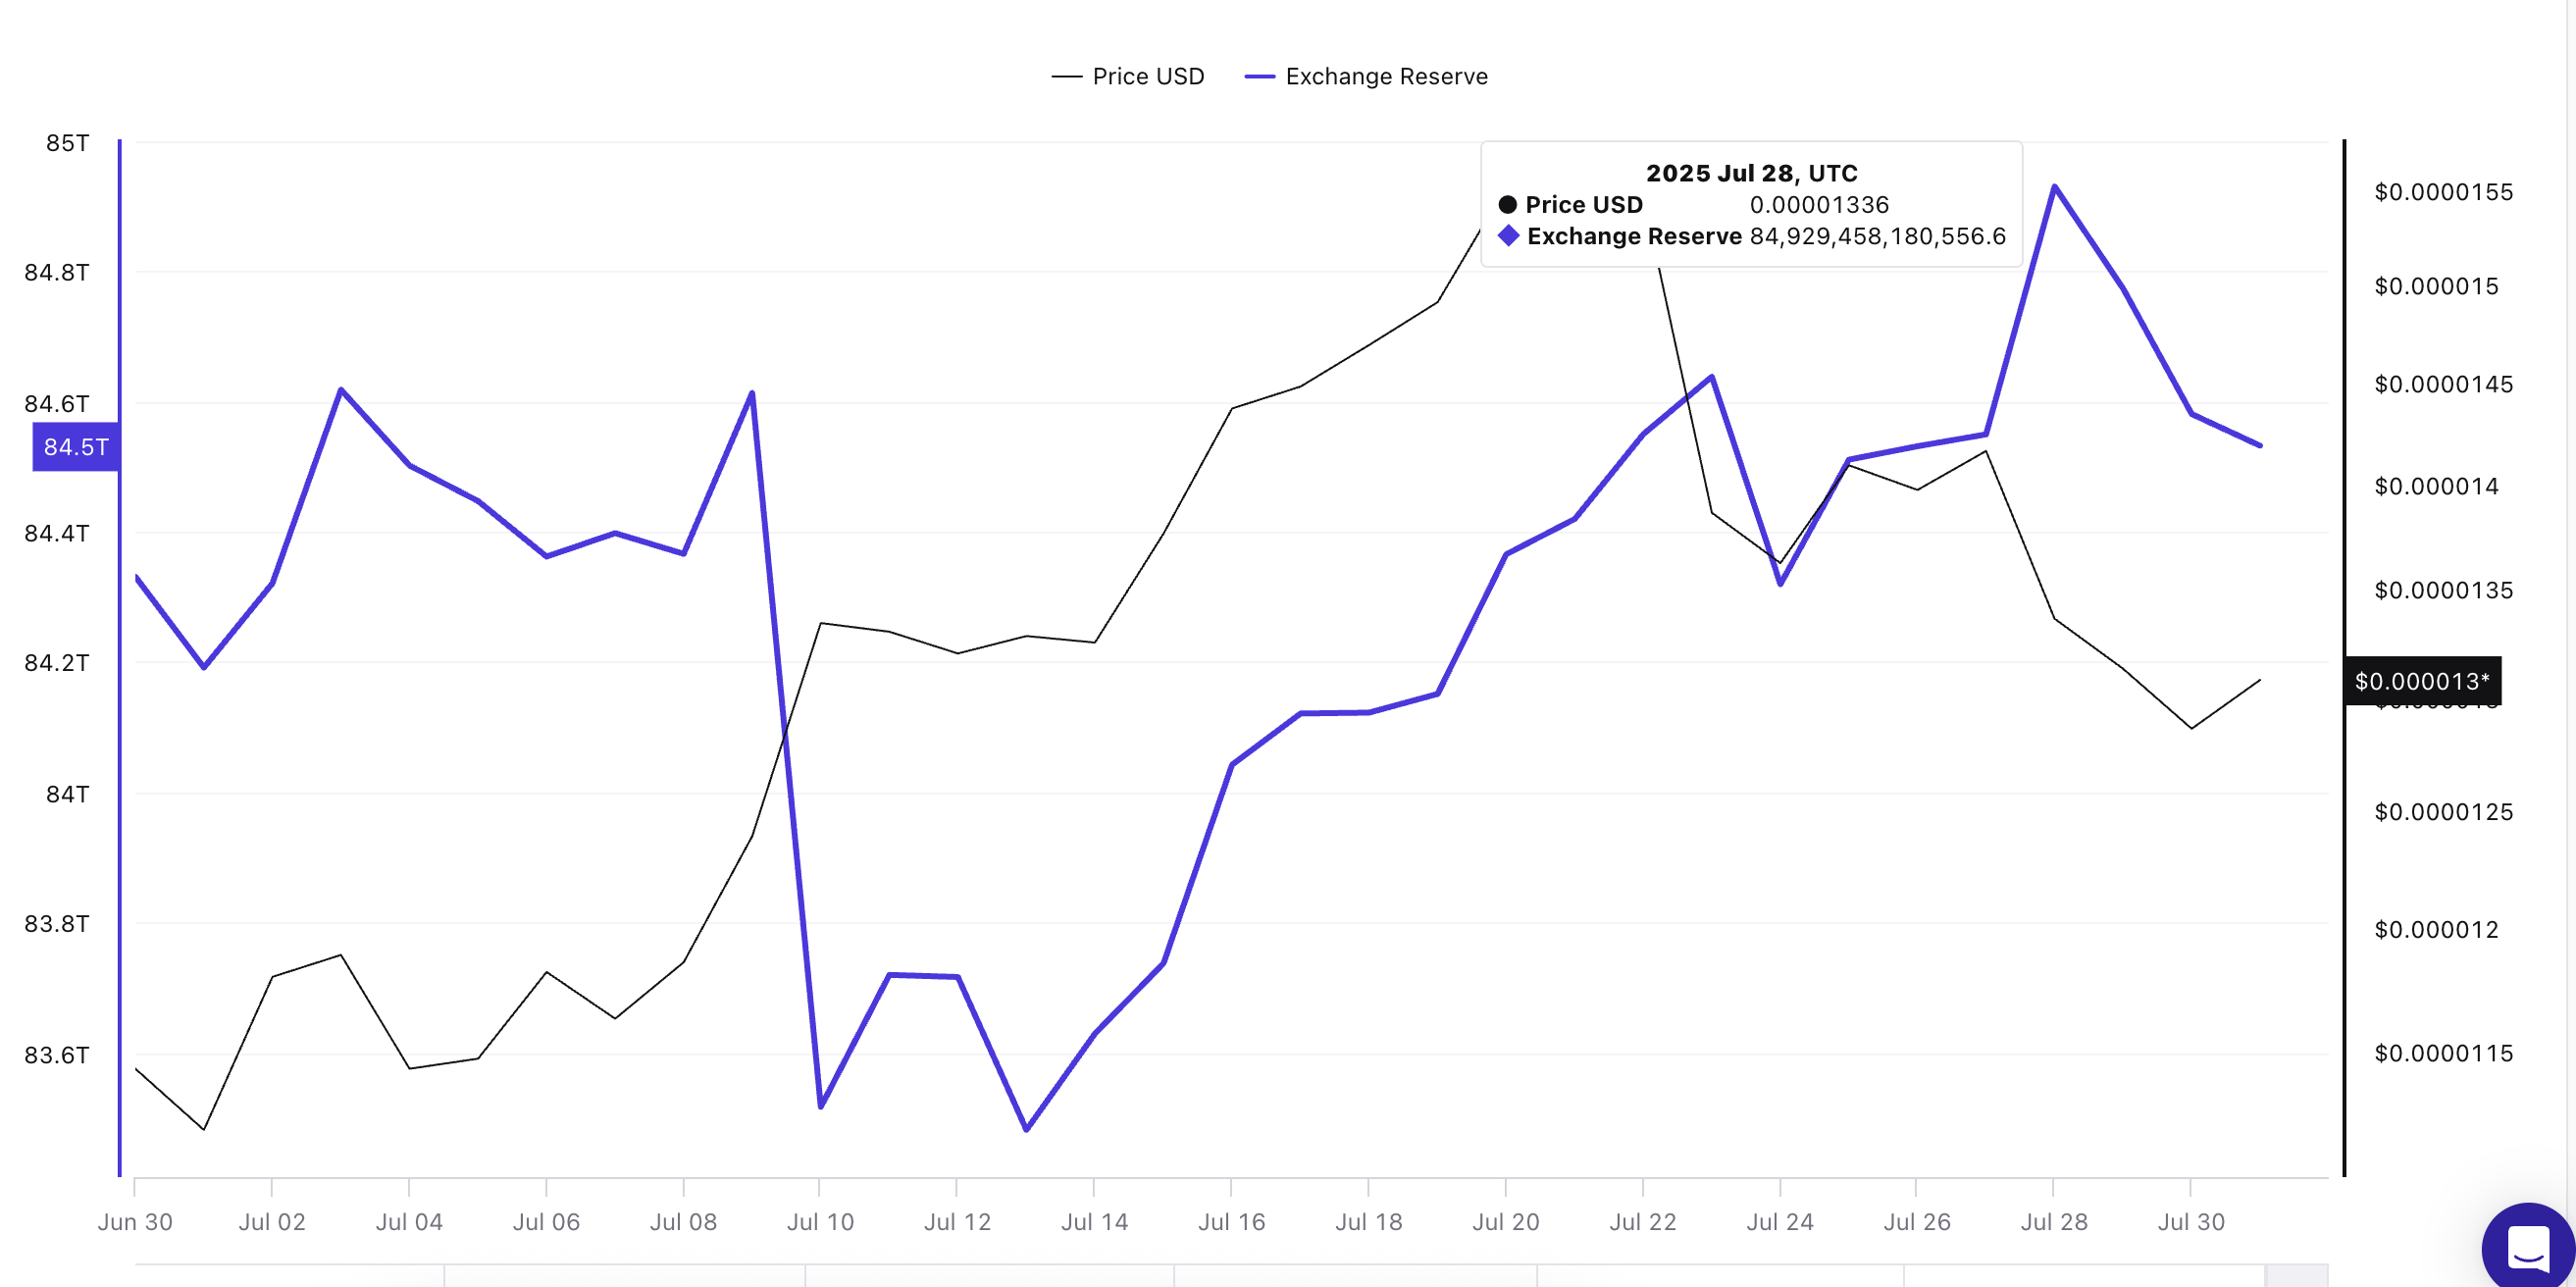 Shiba Inu price and piling exchange reserves:
This matches what was seen in earlier data showing large holder net flows turning negative. Whales are dumping tokens into the market instead of holding them in private wallets, creating extra supply and making it harder for SHIB’s price to rally.
For token TA and market updates: Want more token insights like this? Sign up for Editor Harsh Notariya’s Daily Crypto Newsletter
Money Flow Index Shows Fading Buyer Strength
The Money Flow Index (MFI) tells us how much money is flowing in or out of a token, based on price and volume. In SHIB’s case, MFI has fallen sharply from 91 to 69 in just 10 days. This shows buyers are no longer putting in strong capital despite cheaper prices.
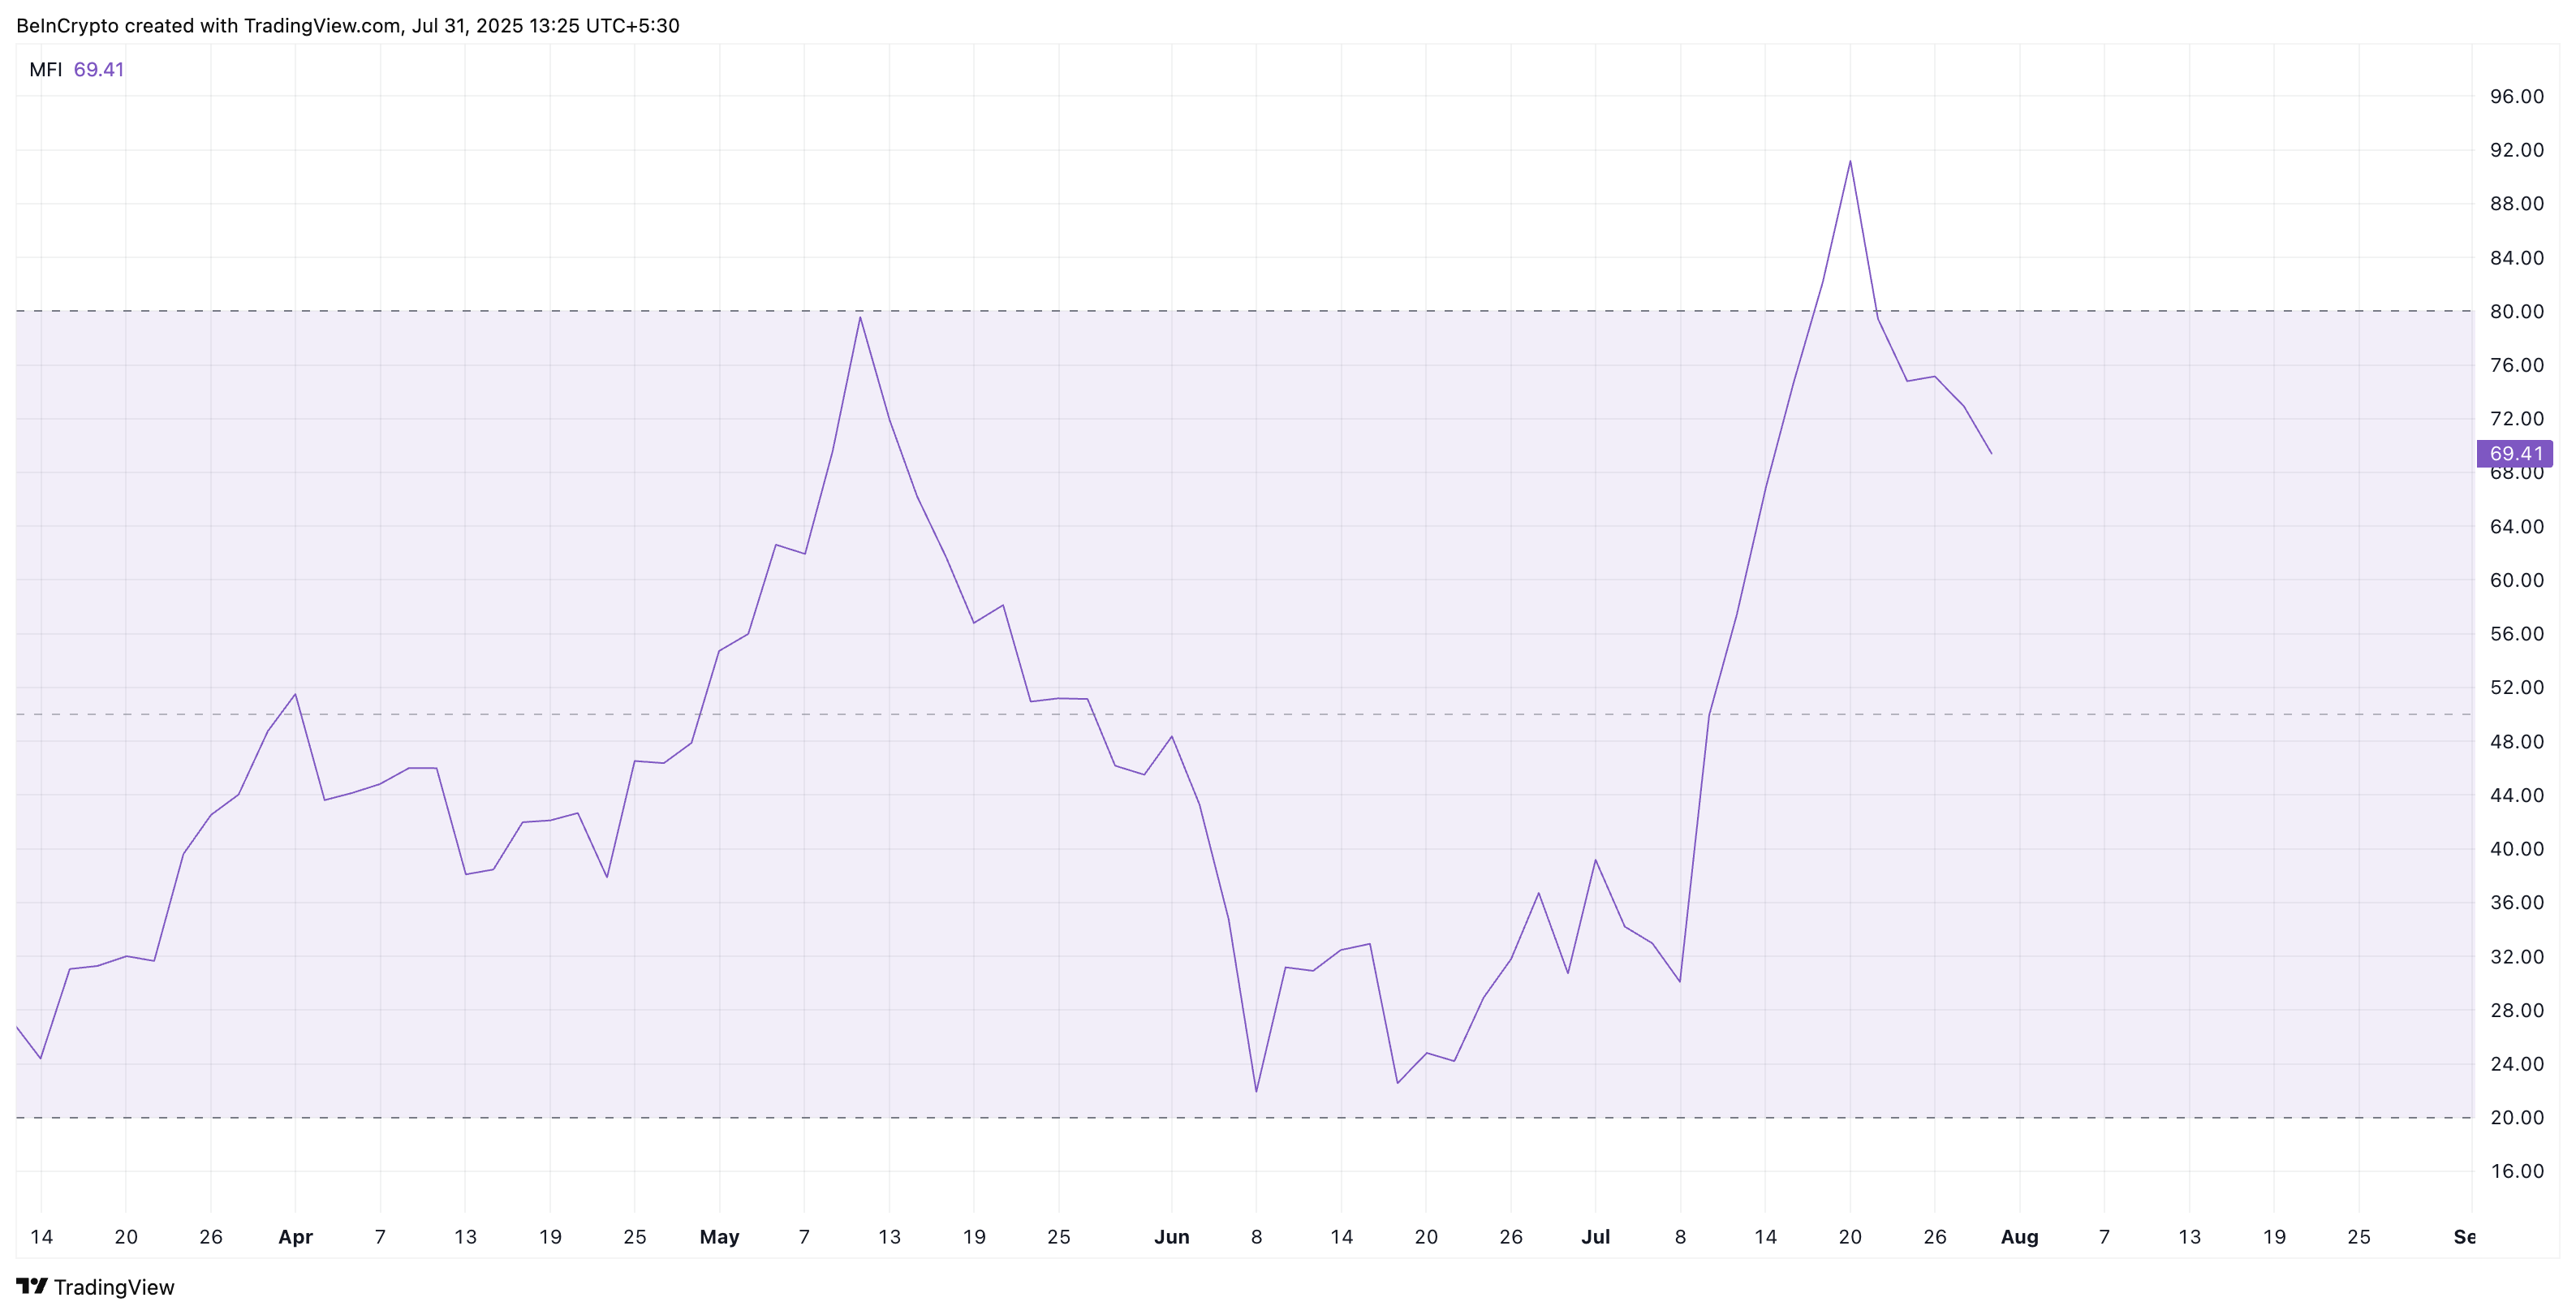 Money flow slows down:
The Bull-Bear Power indicator (BBP) backs this up, showing that sellers have gained control of recent price action. While the bullish momentum kept weakening for a while, the long red bar clearly shows who is in control of the SHIB price action at the moment.
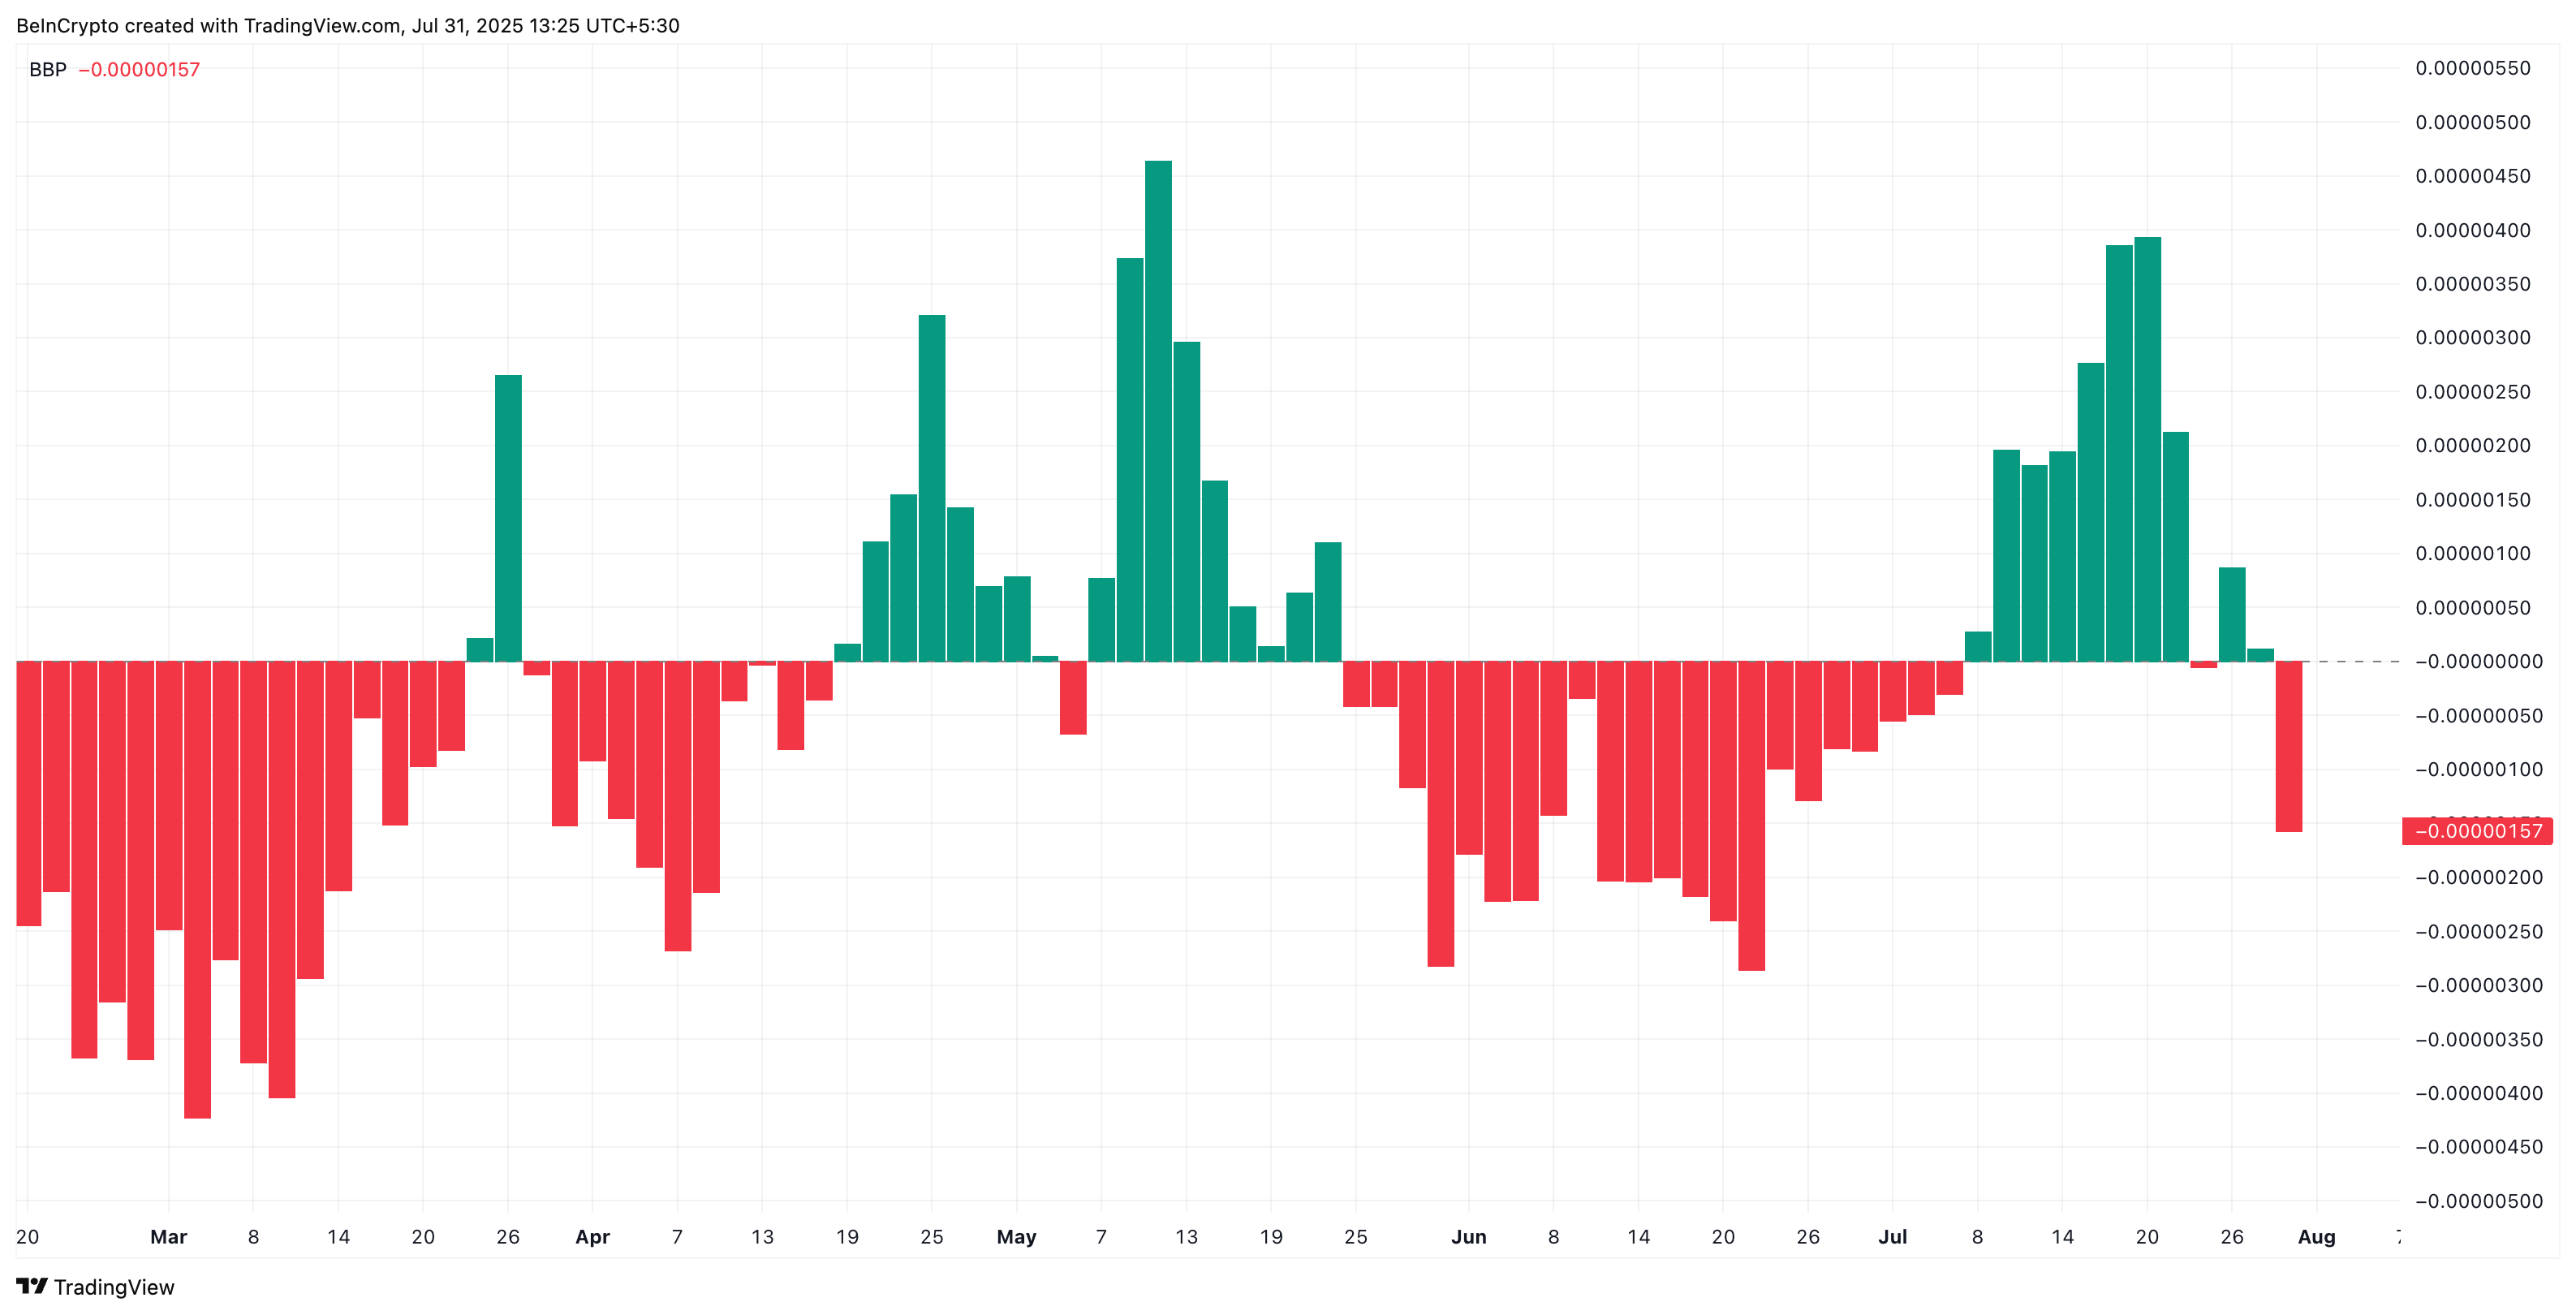 Bears are back in control:
Even with SHIB trading inside a bullish wedge, the dip in MFI and stronger bear signals suggest buying demand is weak for now.
The Bull-Bear Power Indicator measures the strength of buyers versus sellers. It does that by comparing price action to a moving average. Positive values mean bulls are stronger, whereas negative values show bears are in control.
Shiba Inu (SHIB) Price Still Stuck In Wedge; Key Levels To Watch
SHIB’s price is holding inside a falling wedge pattern in the 2-day timeline. This setup often leads to a bullish breakout. But for now, the token is trapped near $0.0000130, with strong support at $0.0000128. If this level breaks, the next downside stops are $0.0000122 and then $0.000010. A dip below $0.000010 would completely invalidate the bullish setup.
As SHIB’s price has moved sideways during the past few days, having a 2-day chart to keep the noise out makes sense.
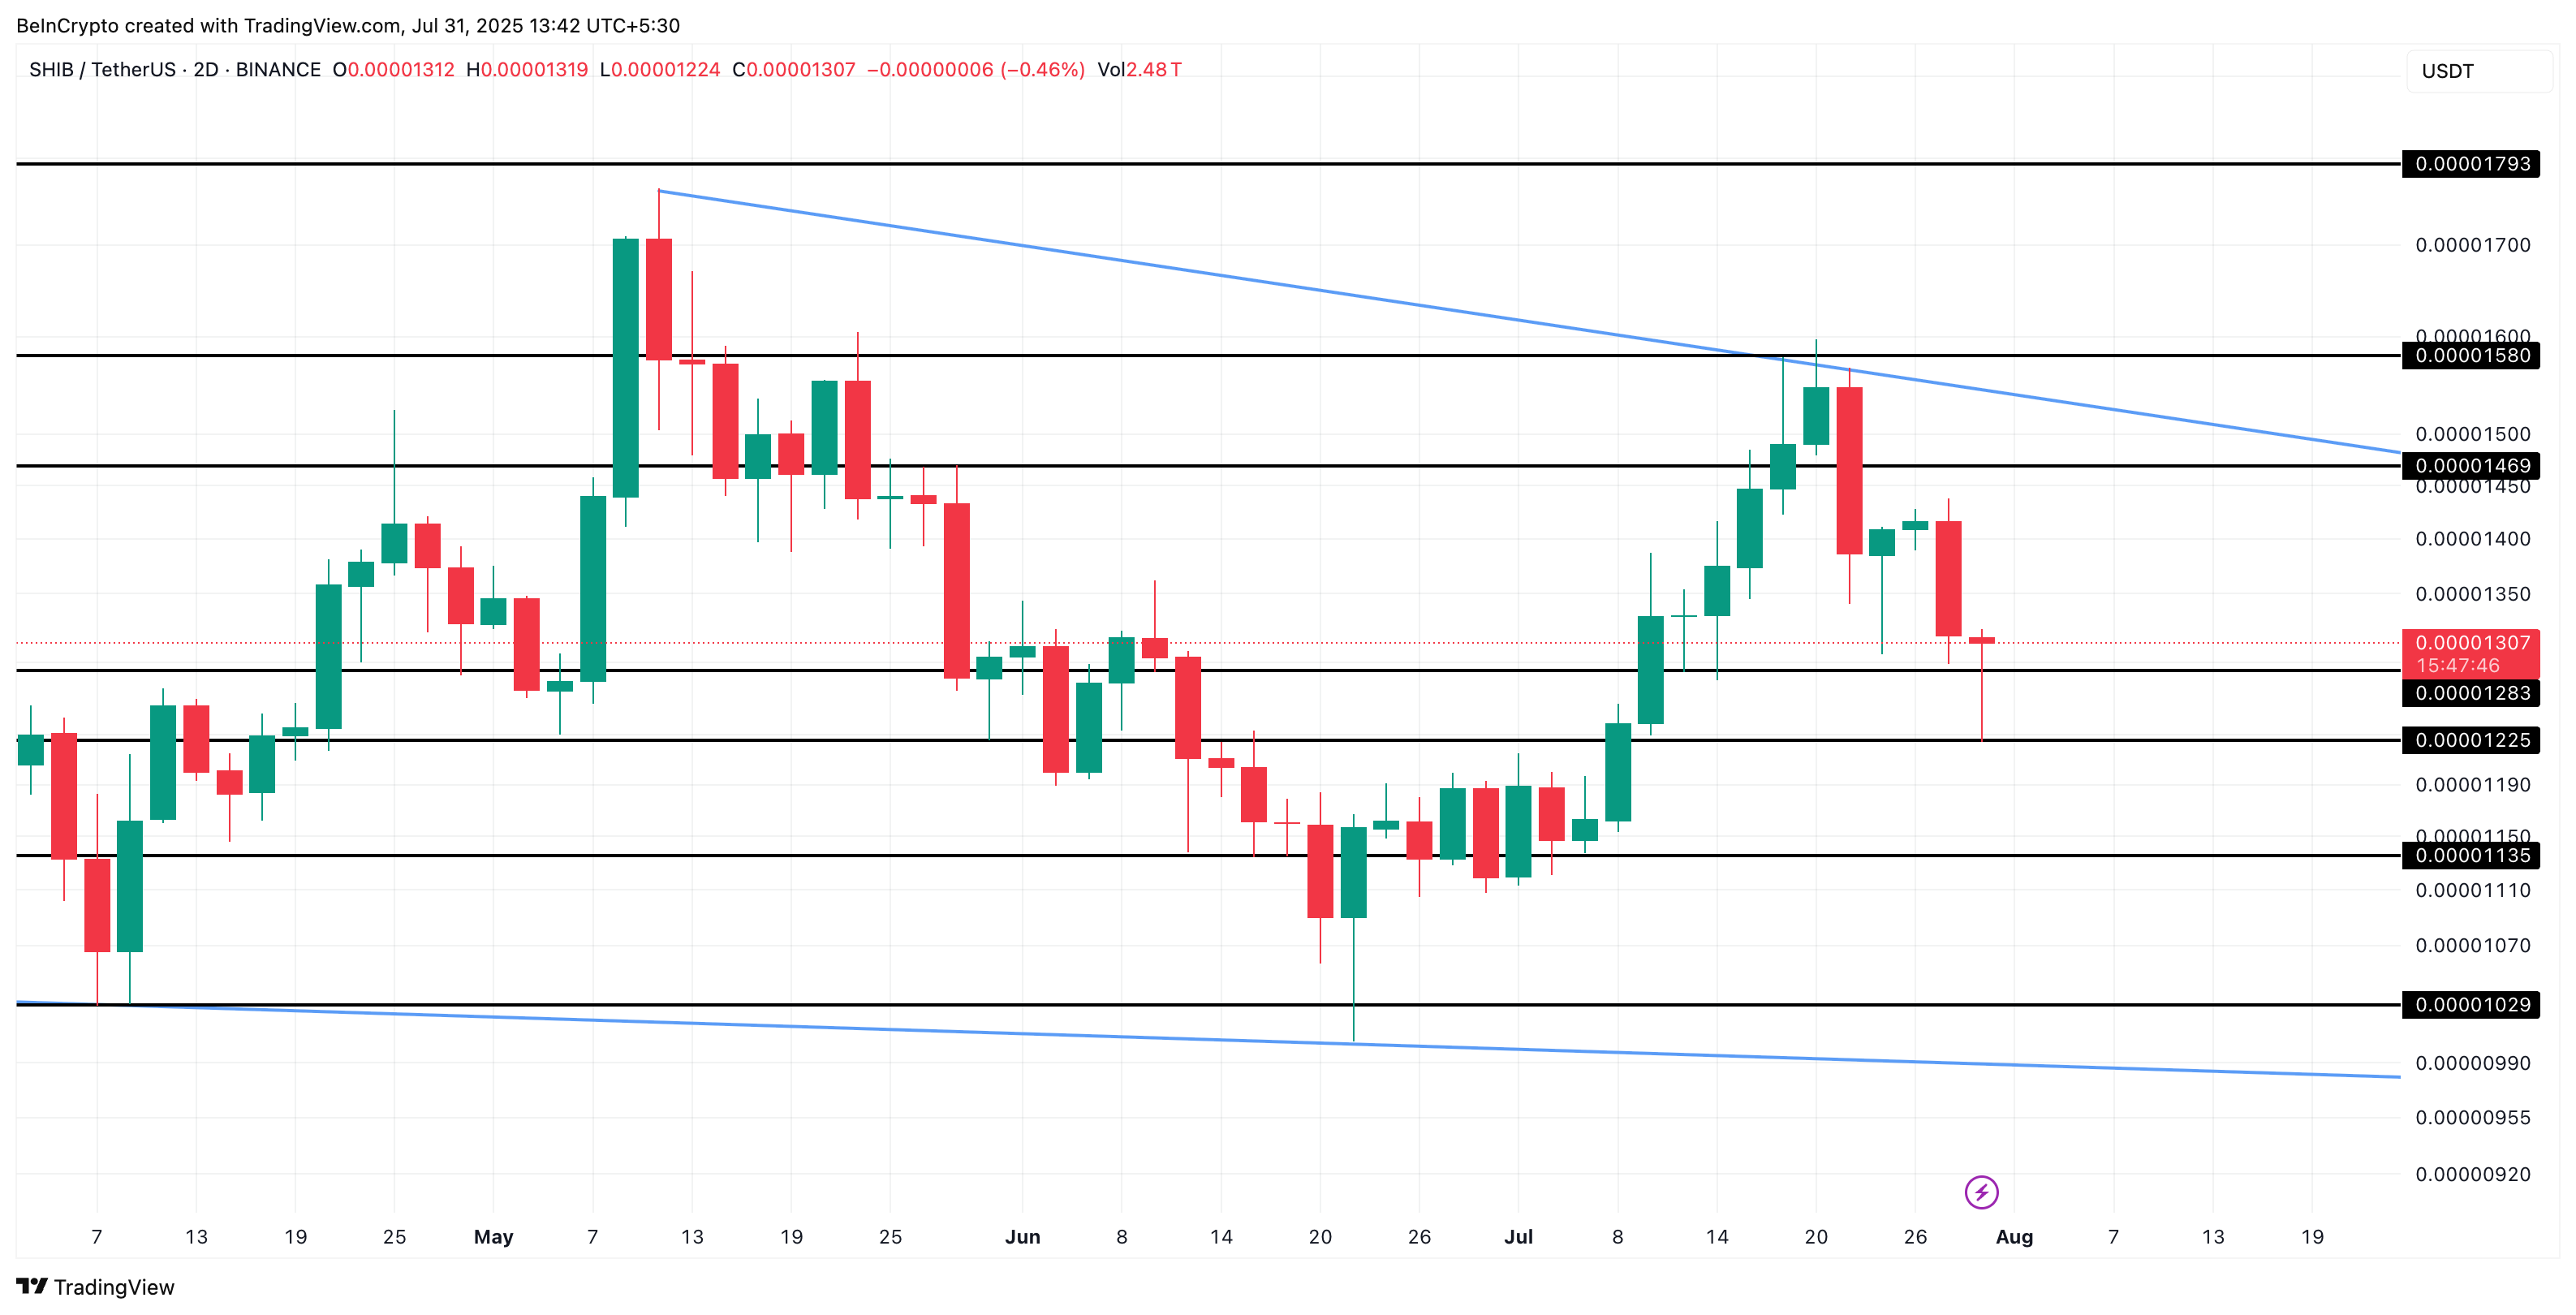 Shiba Inu price analysis:
On the other hand, a breakout above $0.0000158 (but $0.0000146 first) could finally give bulls control. And this could trigger a bigger rally, aligning with the wedge’s expected breakout direction.
Disclaimer: The content of this article solely reflects the author's opinion and does not represent the platform in any capacity. This article is not intended to serve as a reference for making investment decisions.
You may also like
Over $10 billion in market value evaporated in four trading days as CoreWeave (CRWV.US) debt risks trigger sell-off, but Deutsche Bank sees it as a buying opportunity
Deutsche Bank believes that the recent sell-off of CoreWeave lacks sufficient company fundamentals to justify it, and the sharp price correction has instead created a buying opportunity for investors.

Overnight US Stock Market | Inflation Pressure Continues to Rise, All Three Major Indexes Up, Dell (DELL.US) Down 6.8%
At the close of trading, the Dow Jones Industrial Average rose 557.51 points, or 1.08%, to 52,178.99 points; the S&P 500 Index gained 25.18 points, or 0.33%, to 7,744.12 points; and the Nasdaq Composite Index increased by 20.16 points, or 0.08%, to 26,713.03 points.
Interactive Brokers (IBKR.US) Q3 revenue increased by 16% year-on-year, announces over 70% increase in quarterly dividend
Driven by growth in net interest income and commission income, Interactive Brokers' Q3 net revenue increased by 16% year-on-year, with adjusted earnings per share rising by approximately 18% year-on-year.
CoreWeave default probability exceeds 60%! Jensen Huang "puts out the fire": Financing costs are declining, no need for NVIDIA to backstop
After Jensen Huang's speech, CoreWeave's stock price, which had fallen by as much as 9.5% in early trading, turned positive. The company's five-year CDS rose above 1,190 basis points during Thursday’s session, a historical high reflecting the cost of debt default protection, while yields on some of its corporate bonds have climbed above 15% to 16%. The five-year CDS spreads for Oracle, Amazon, Google’s parent company, and Meta are all at historically high levels. Deutsche Bank analysts believe that as the AI capital expenditure cycle is increasingly supported by debt rather than free cash flow, investors must place greater emphasis on signals from the credit market. Overall, while AI-related financing costs are not yet excessively high, worrying signs have begun to emerge.

Crypto prices
More


