Date: Tue, Aug 05, 2025 | 11:30 AM GMT
The cryptocurrency market is making a slight recovery from the latest sharp decline as the price of Ethereum (ETH) has bounced to $3,675 from its recent low of $3,357. As momentum returns, several altcoins and memecoins are starting to show strength — including Pepe (PEPE).
PEPE is trading back in the green today, posting modest gains. Its chart is now highlighting the emergence of a symmetrical triangle pattern, a technical structure that could be setting the stage for a potential upside move.
 Source: Coinmarketcap
Symmetrical Triangle in Play?
On the daily chart, PEPE is forming a symmetrical triangle — a pattern that generally signals consolidation before a decisive breakout in either direction. Recently, PEPE was rejected at the upper boundary near $0.00001474, which pushed it back toward the triangle’s lower trendline at around $0.0000098.
That level also aligned with the 200-day moving average (200 MA), creating a strong support zone that helped the price stabilize.
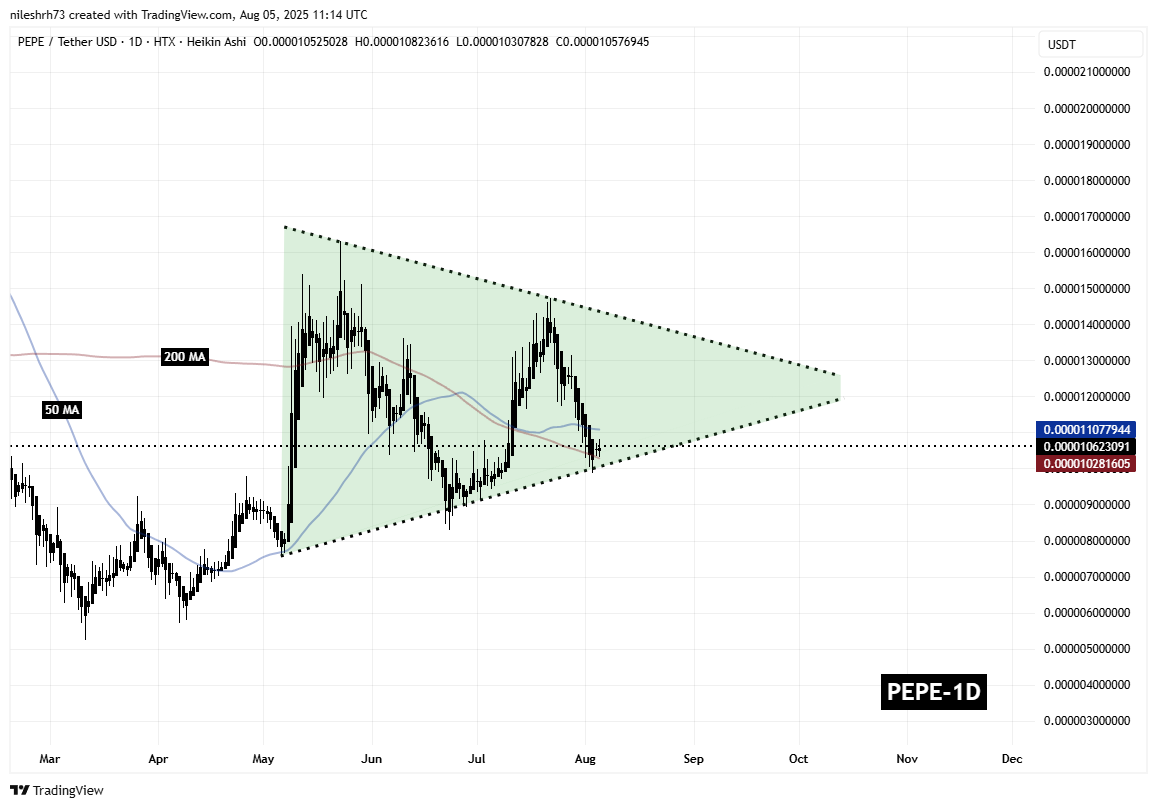 PEPE Daily Chart/Coinsprobe (Source: Tradingview)
From there, PEPE has started to recover and is now trading above $0.00001062, attempting to push past its 50-day moving average (50 MA) at $0.00001107.
What’s Next for PEPE?
If PEPE manages to break and hold above the 50 MA, bullish momentum could build, potentially driving the price toward the triangle’s upper resistance near $0.00001330 — an upside of over 25% from current levels.
However, to maintain the bullish setup, PEPE must hold above the 200 MA at $0.00001028 and the triangle’s lower trendline. A breakdown below these levels could invalidate the pattern and shift sentiment bearish.
Disclaimer: This article is for informational purposes only and not financial advice. Always conduct your own research before investing in cryptocurrencies.