XRP is showing signs of recovery after a recent sell-off, trading around $3.00. However, key resistance levels suggest caution for traders.
-
XRP has recently closed above the 26-day Exponential Moving Average, indicating potential for a macrotrend reversal.
-
The asset has rebounded from a low of $2.80 to around $3.00, but caution is advised as market indicators show hesitancy.
-
Volume trends indicate a lack of buying strength, which could impact XRP’s ability to sustain its current price levels.
XRP shows signs of recovery after a sell-off, trading around $3.00. However, key resistance levels suggest caution for traders. Read more to understand the market dynamics.
What is XRP’s Current Market Situation?
XRP is currently trading around $3.00 after a significant drop from its local peak of $3.70. The recent close above the 26-day Exponential Moving Average has raised hopes for a potential trend reversal, although caution is warranted as the daily chart structure does not yet indicate a full recovery.
Why is Caution Advised for XRP Traders?
Despite the recent price increase, the spinning top candlestick pattern suggests market hesitancy. This pattern typically indicates a pause or potential reversal, especially at psychological resistance levels like $3.00. Additionally, declining buy-side volume during this recovery raises concerns about the sustainability of the upward movement.
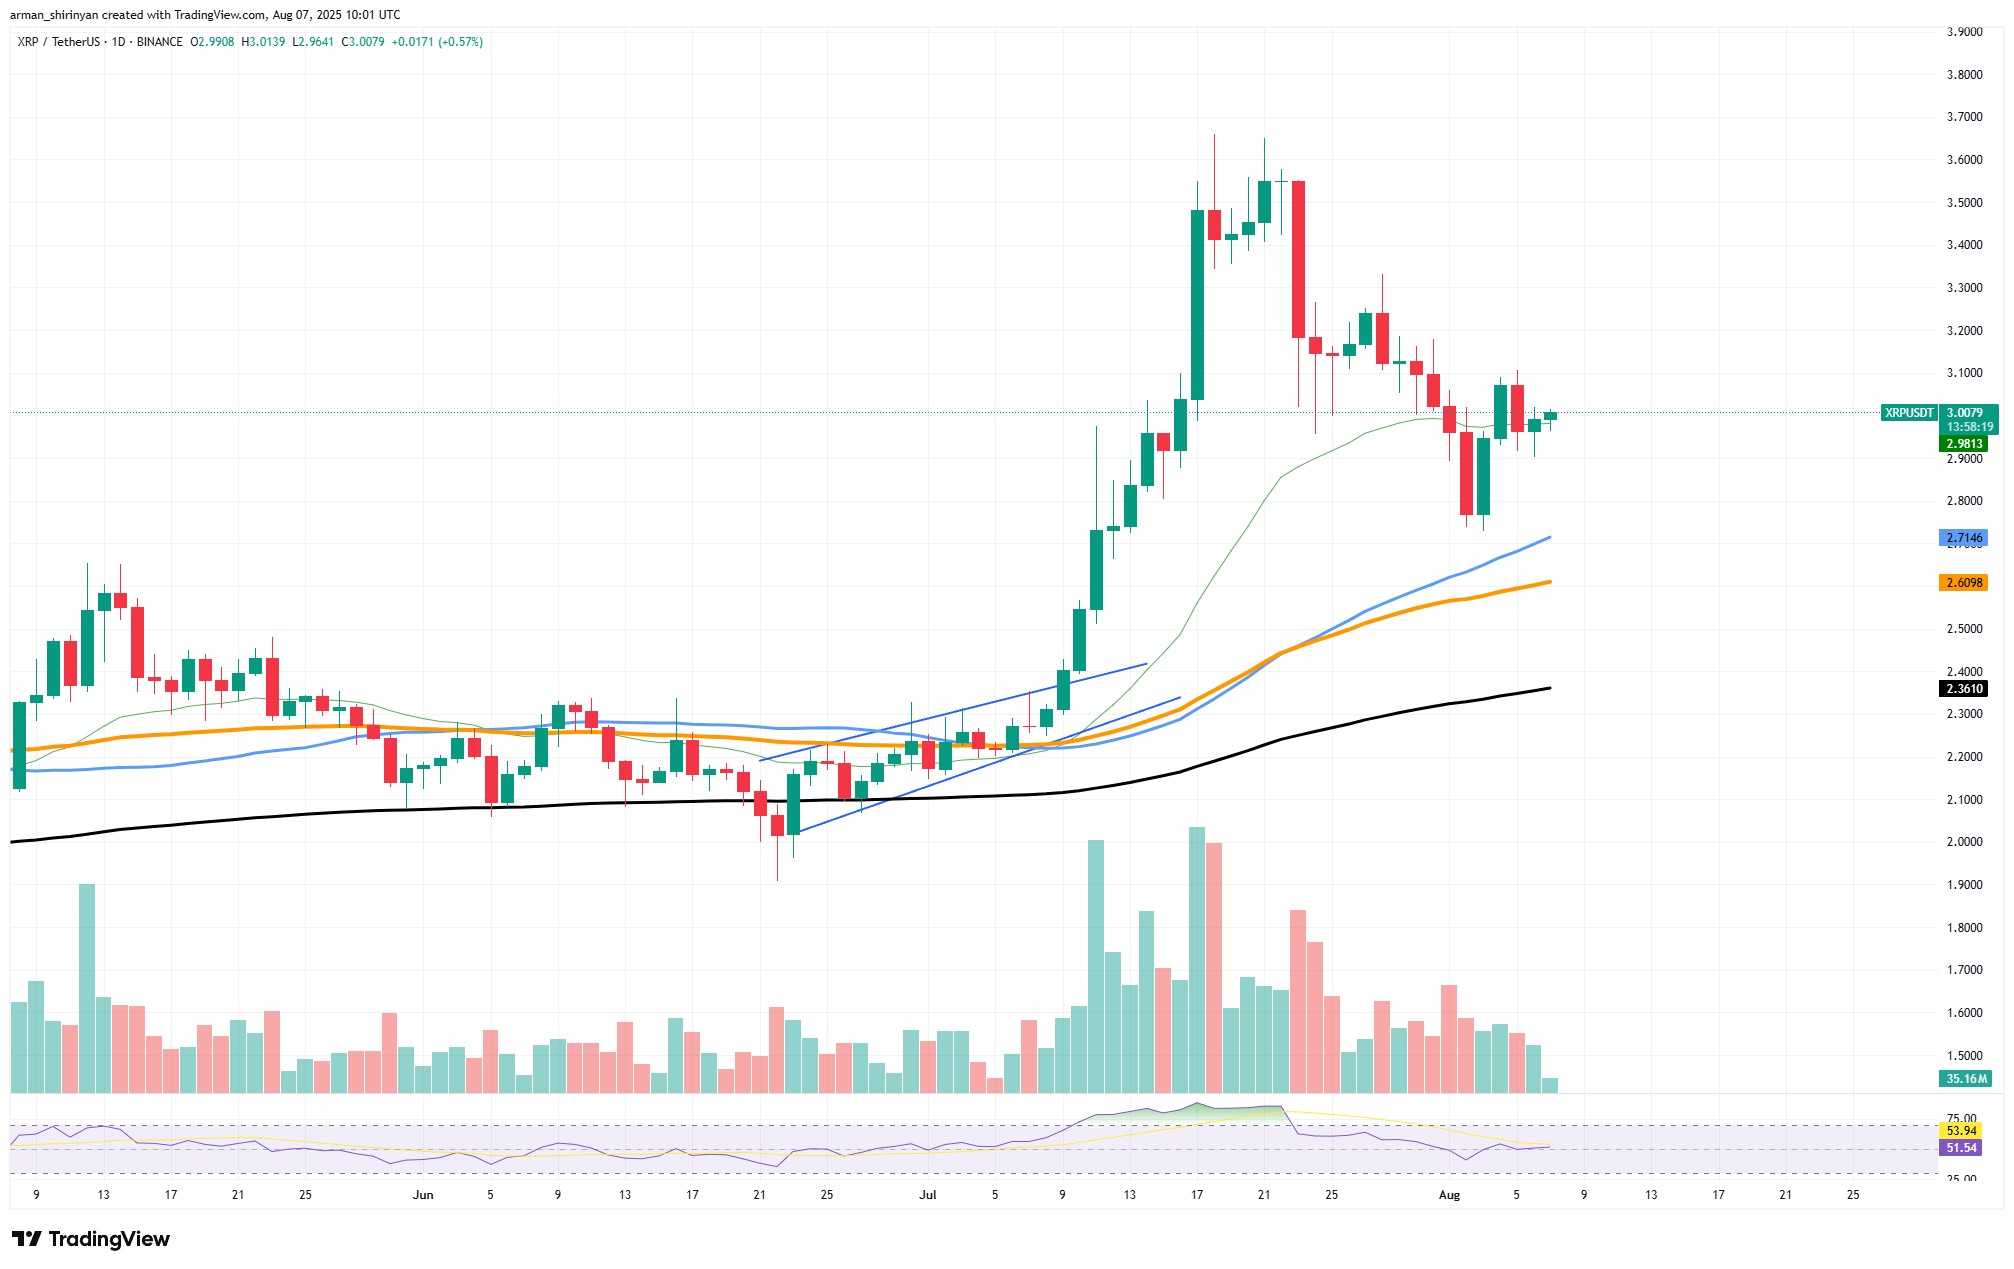 XRP/USDT Chart by TradingView
What Are XRP’s Recovery Chances?
The current lack of conviction in the market may suggest that the recent bounce is merely a relief rally. Key support zones include the 50 EMA at approximately $2.71 and the 100 EMA at $2.60. If XRP fails to maintain its current levels and drops below the 26 EMA, a retest of these averages is likely.
With the Relative Strength Index (RSI) hovering just above 51, there is potential for both upward and downward momentum. However, a sustained reversal will require a clear break above $3.10-$3.20 supported by increased volume.
Frequently Asked Questions
What are the key resistance levels for XRP?
The key resistance level for XRP is around $3.00. A break above $3.10-$3.20 is needed for a sustained upward trend.
How does the RSI affect XRP’s price movement?
The RSI hovering just above 51 indicates potential for both upward and downward momentum, suggesting traders should remain cautious.
Key Takeaways
- XRP is trading around $3.00: Recent price movements indicate a potential recovery, but caution is advised.
- Resistance levels are critical: Key resistance at $3.00 may lead to selling pressure.
- Volume trends are concerning: Declining buy-side volume raises questions about the sustainability of the current price levels.
Conclusion
In summary, while XRP shows signs of recovery, traders should remain vigilant due to key resistance levels and declining volume trends. The market remains uncertain, and a cautious approach is recommended as XRP navigates its next moves.