
Pi Coin Price Makes 2 Bullish Moves in August: Do Buyers Still Want a Slice of PI?

Pi Coin has been in freefall, but two short-term chart signals now suggest a potential trend shift. From EMA crossovers to bull-bear strength, here’s what’s changing under the surfac
July was rough for Pi Coin. But why stop there? Over the past year, the token has shed over 60% of its value. Traders have largely tuned out. Yet in the first week of August, something changed.
PI bounced 4.6% from its all-time low, and for the first time since July 30, two short-term bullish moves have surfaced, hinting at a potential shift in sentiment.
Bulls Show Signs of Life First Time In August
The first notable signal came on the 4-hour bull-bear power chart, where a green bar flashed after 40+ sessions. This matters. The last time bulls registered on this chart was back in July, and since then, sellers have completely dominated. A green bar suggests that for the first time in weeks, buying pressure has overtaken selling power, even if briefly.
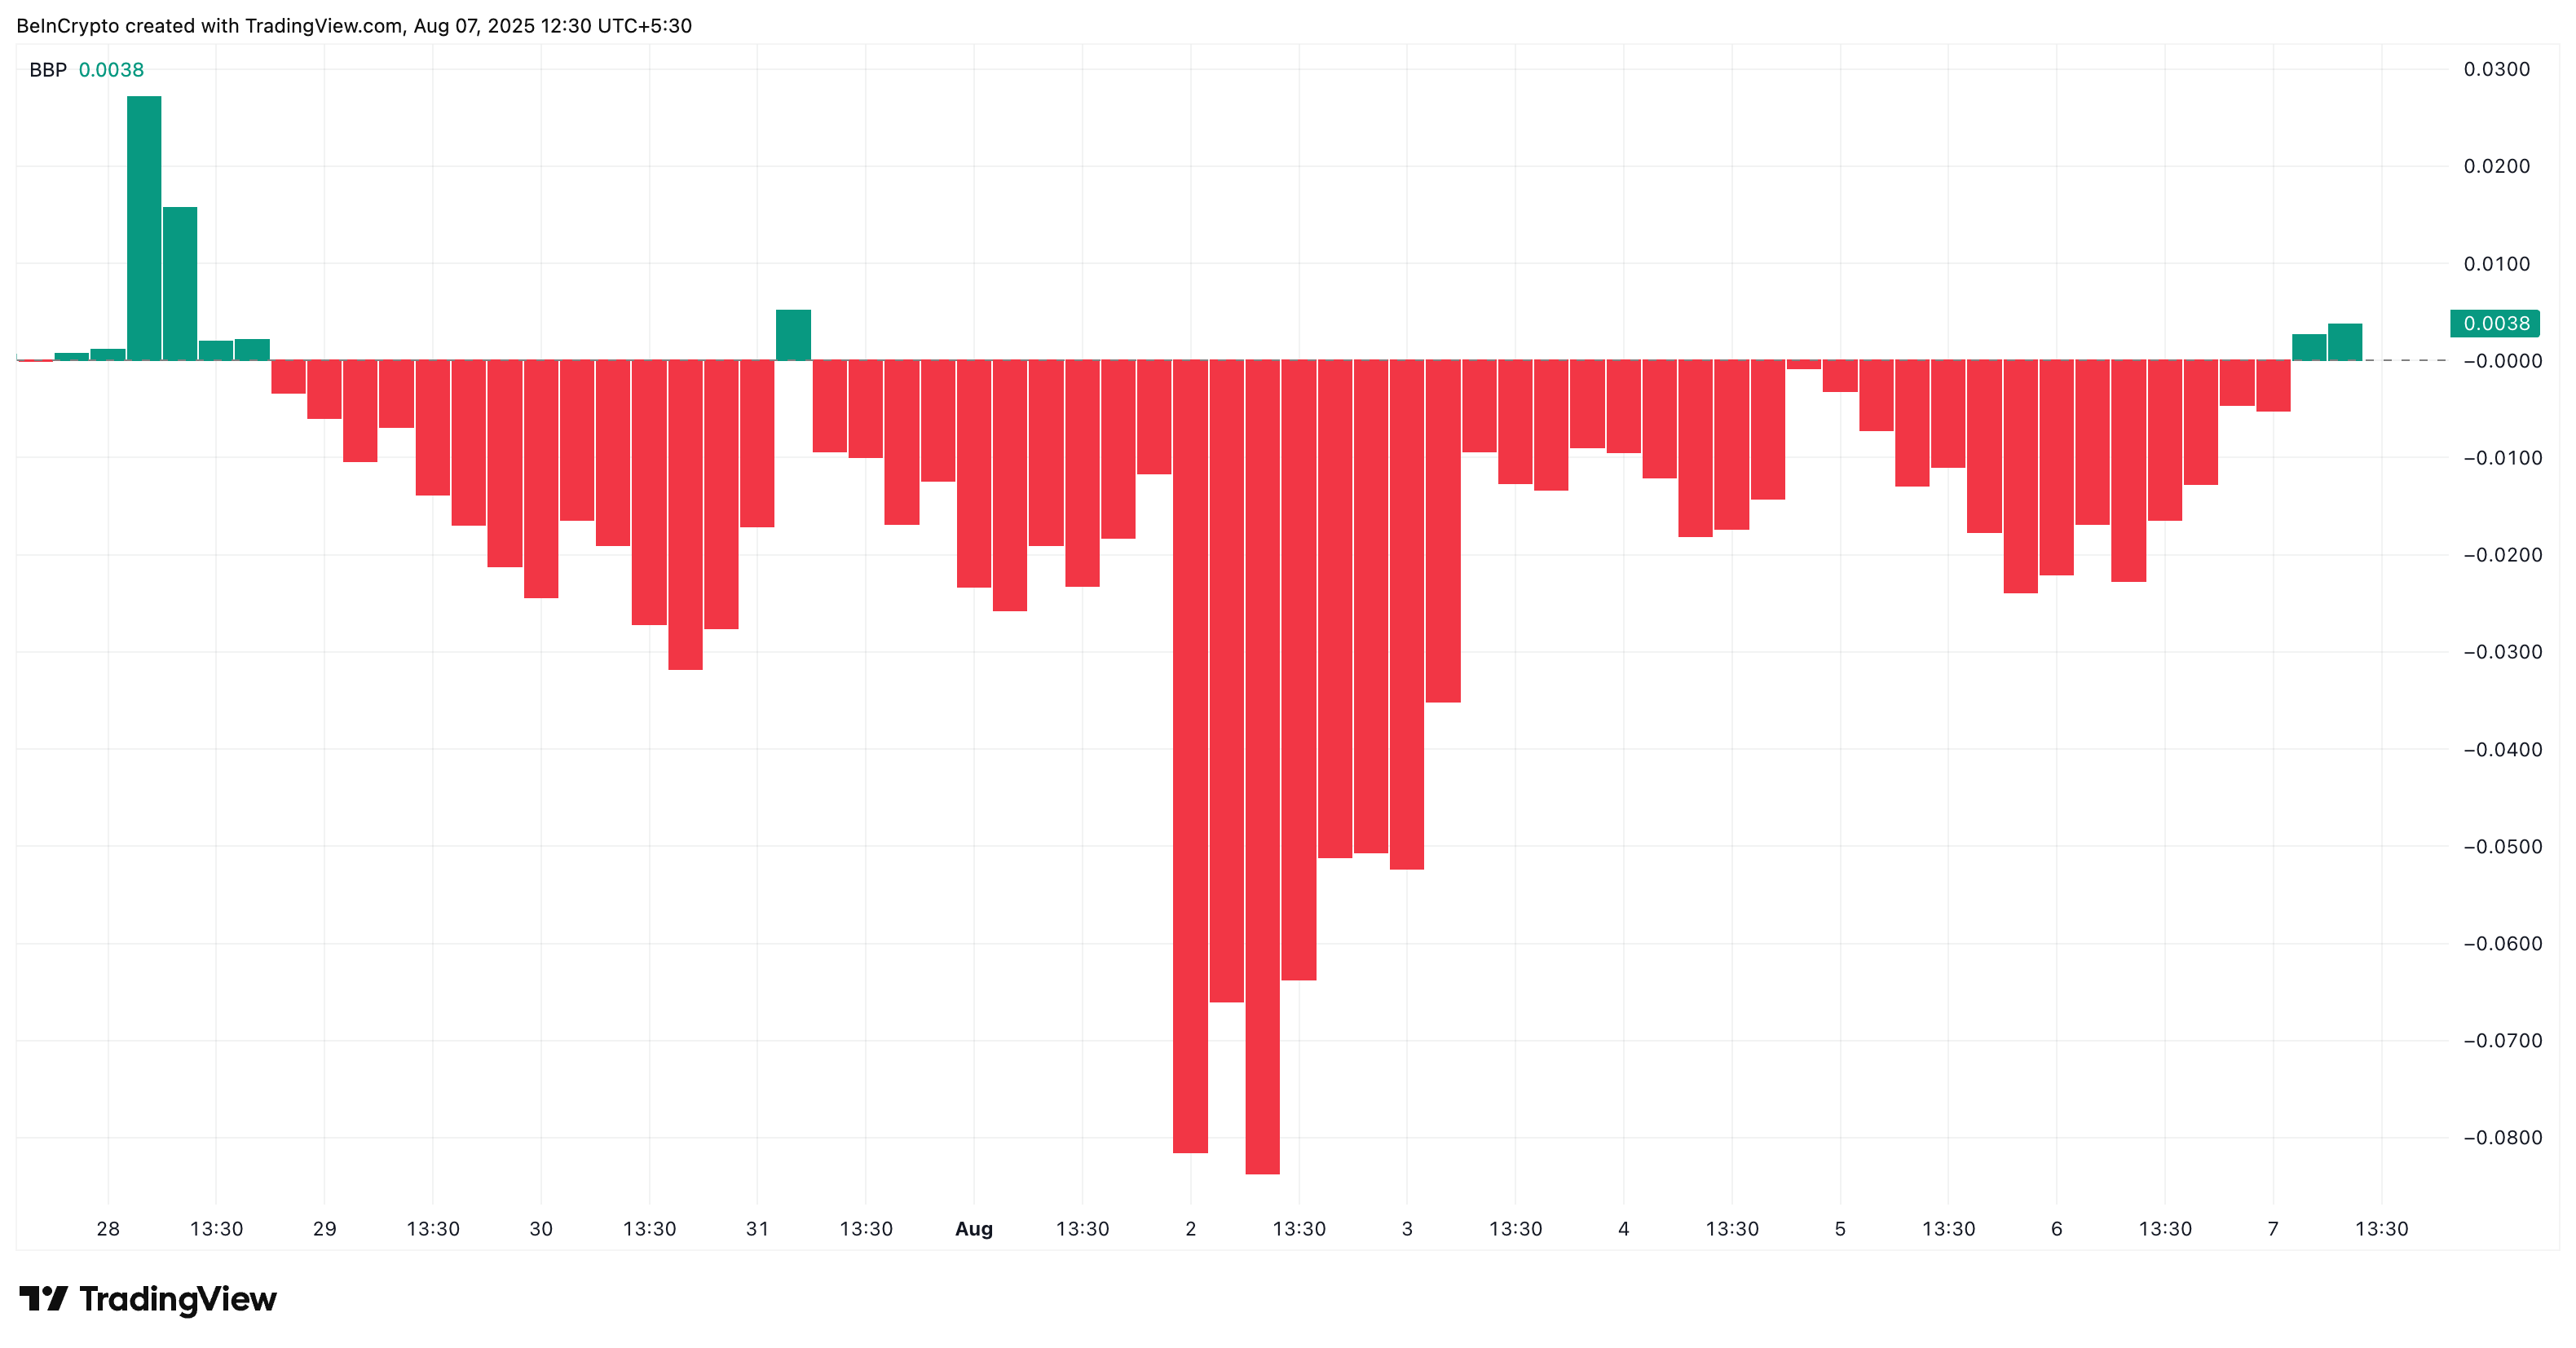 Pi Network bulls come back to life:
The Bull-Bear Power index tracks the difference between intraday highs and lows relative to a moving average. When green bars appear, it indicates bulls are attempting to take control, often a subtle but early sign of accumulation.
2-Hour Chart Reveals PI Coin Trend Shift With EMA Crossover
While the 4-hour chart showed the first signs of buying pressure, it lacked directional clarity. That’s why we shift to the 2-hour chart: to catch early trend changes and momentum buildups that larger timeframes might blur.
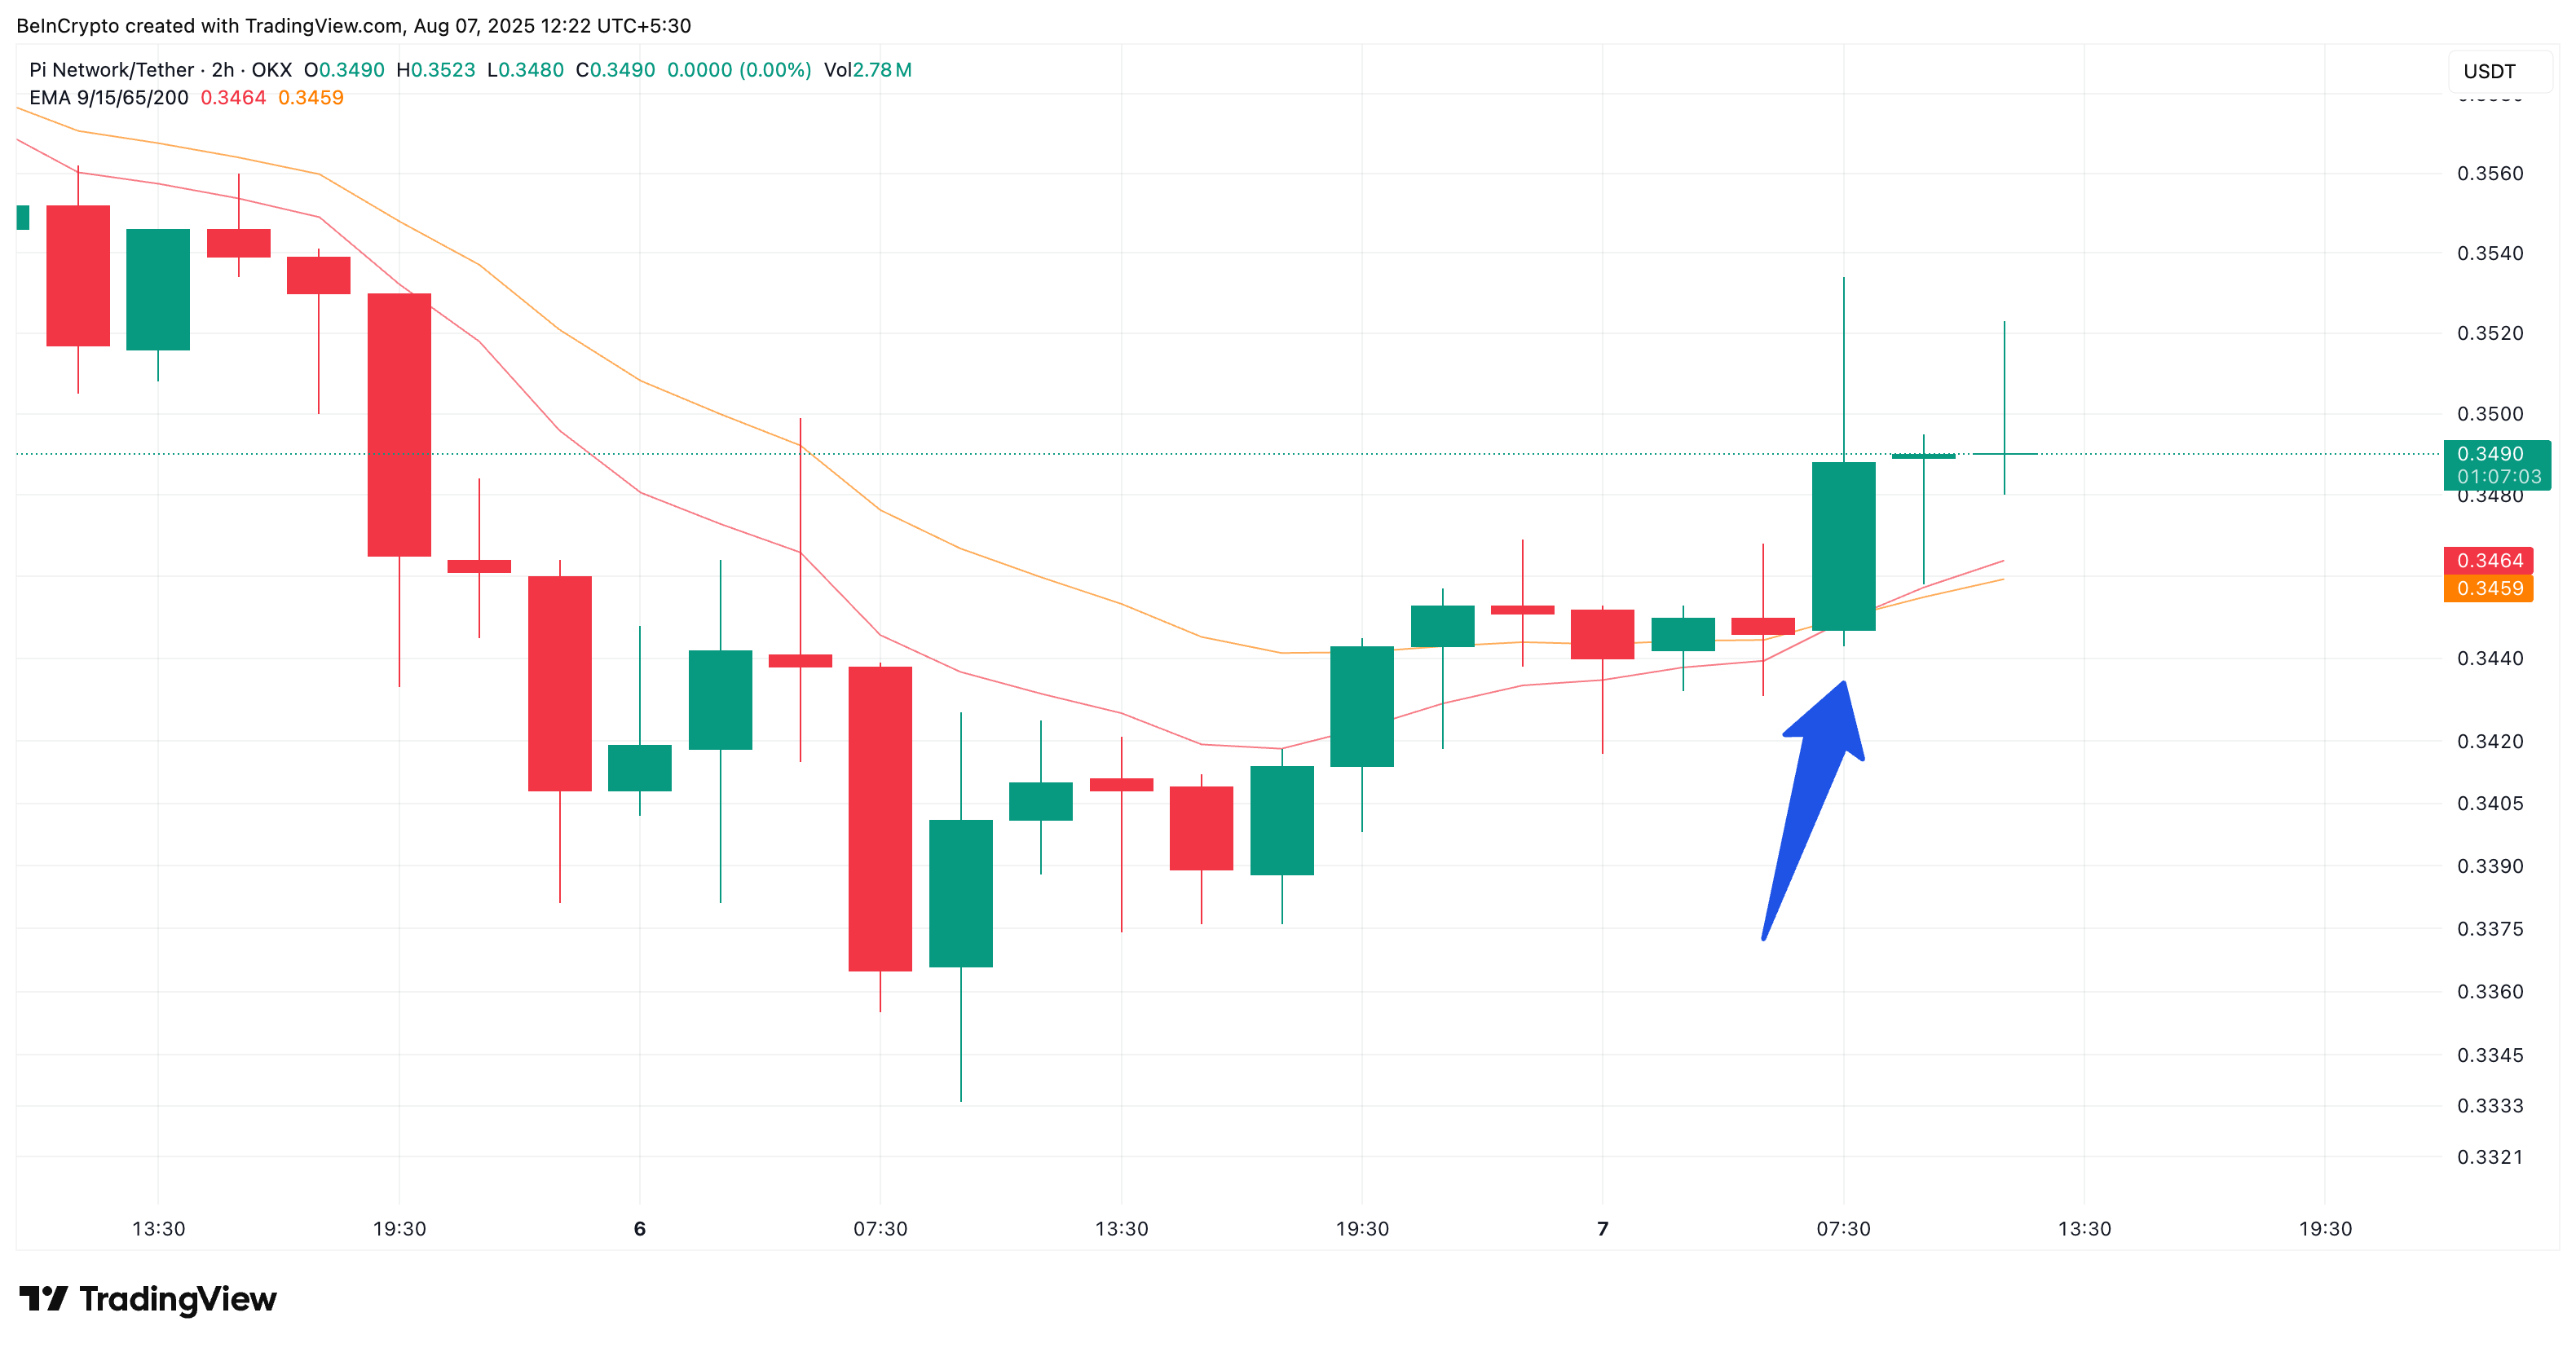 PI Coin Price 2-hour chart:
On this lower timeframe, a 9/15-period exponential moving average (EMA) crossover has just taken place, with the faster-moving 9-EMA (red line) crossing above the slower 15-EMA (orange line). This suggests that buyers have started gaining control over short-term price action, overpowering sellers for the first time in August. The 9/15 EMA is often used to identify early momentum shifts before they appear on higher timeframes, making this crossover a relevant bullish cue.
Compared to the more commonly used 20/50-period EMAs, the 9/15 crossover reacts faster to smaller price shifts, making it more effective for spotting momentum shifts before they become obvious on longer timeframes. However, while it gives earlier signals, it’s also more sensitive to noise, so confirmation from price structure and volume remains essential.
PI Coin Price: All About A Pennant Pattern and Key Breakout Levels
On the same 2-hour chart, the PI price is also pressing against the upper trendline of a bullish pennant, consolidating tightly near $0.35. A clean candle close above that level could unlock a short leg higher, with short-term targets near $0.36.
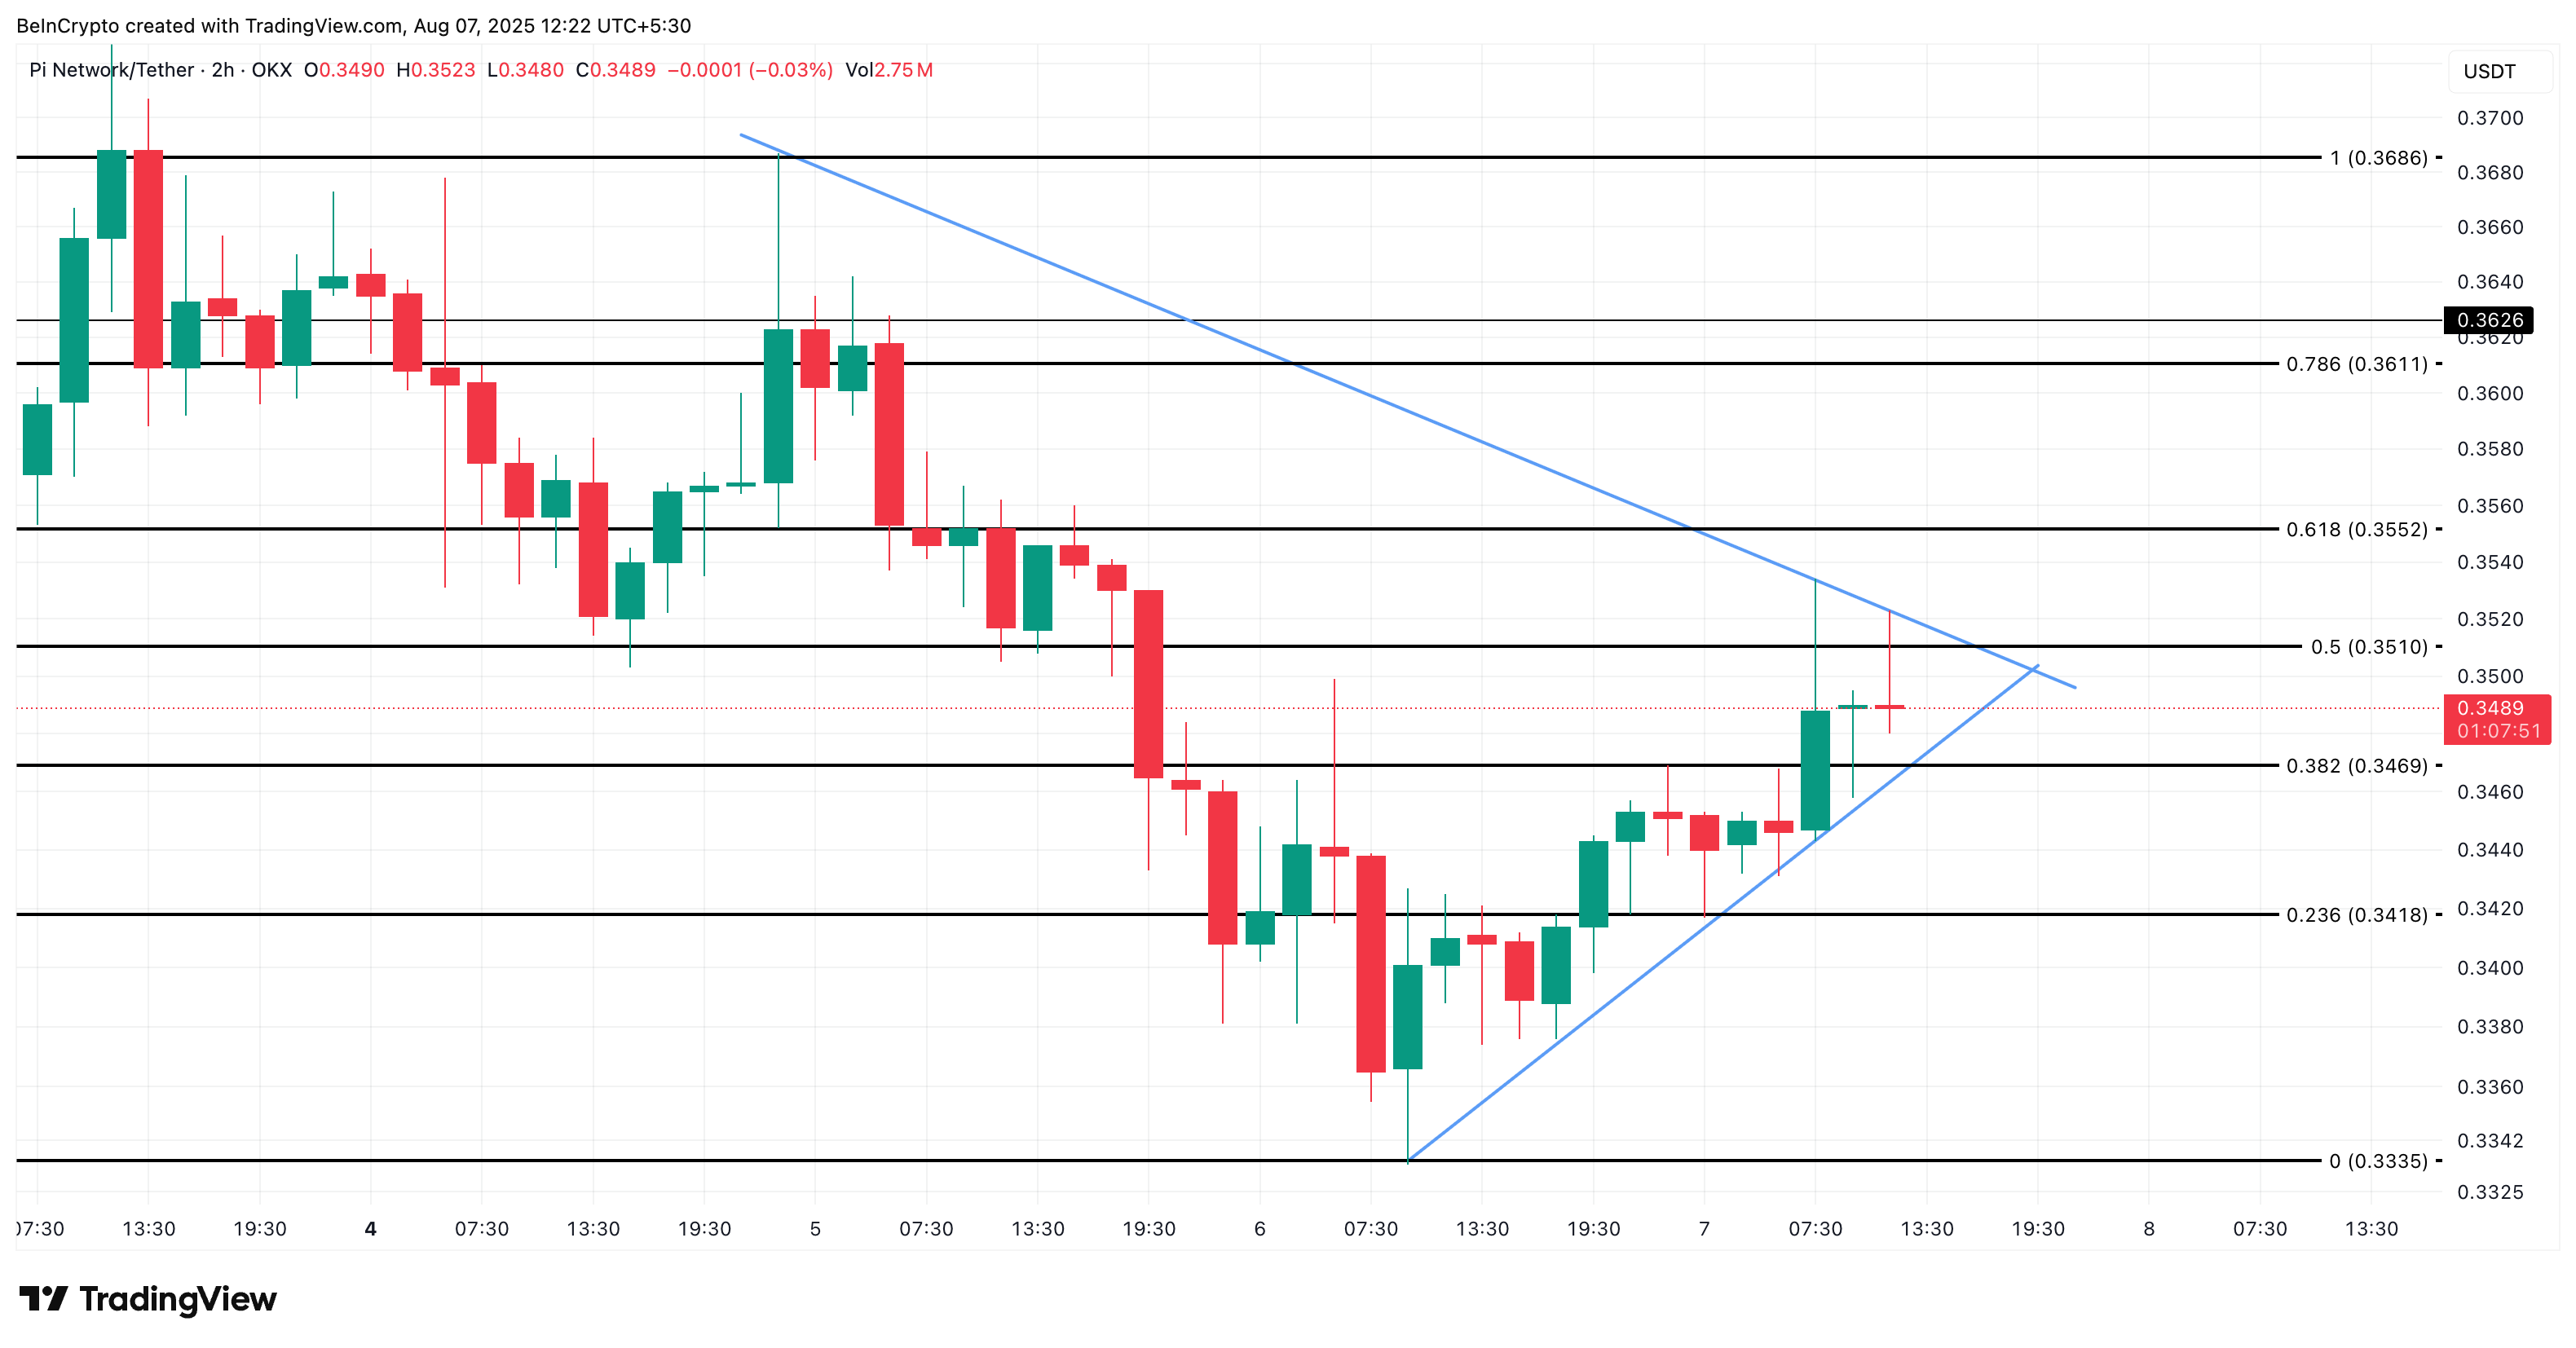 Pi Coin short-term price action:
The daily Pi Coin price chart confirms that these levels are key resistance zones. The 0.36 mark aligns with the upper boundary of previous rejections, followed by $0.39.
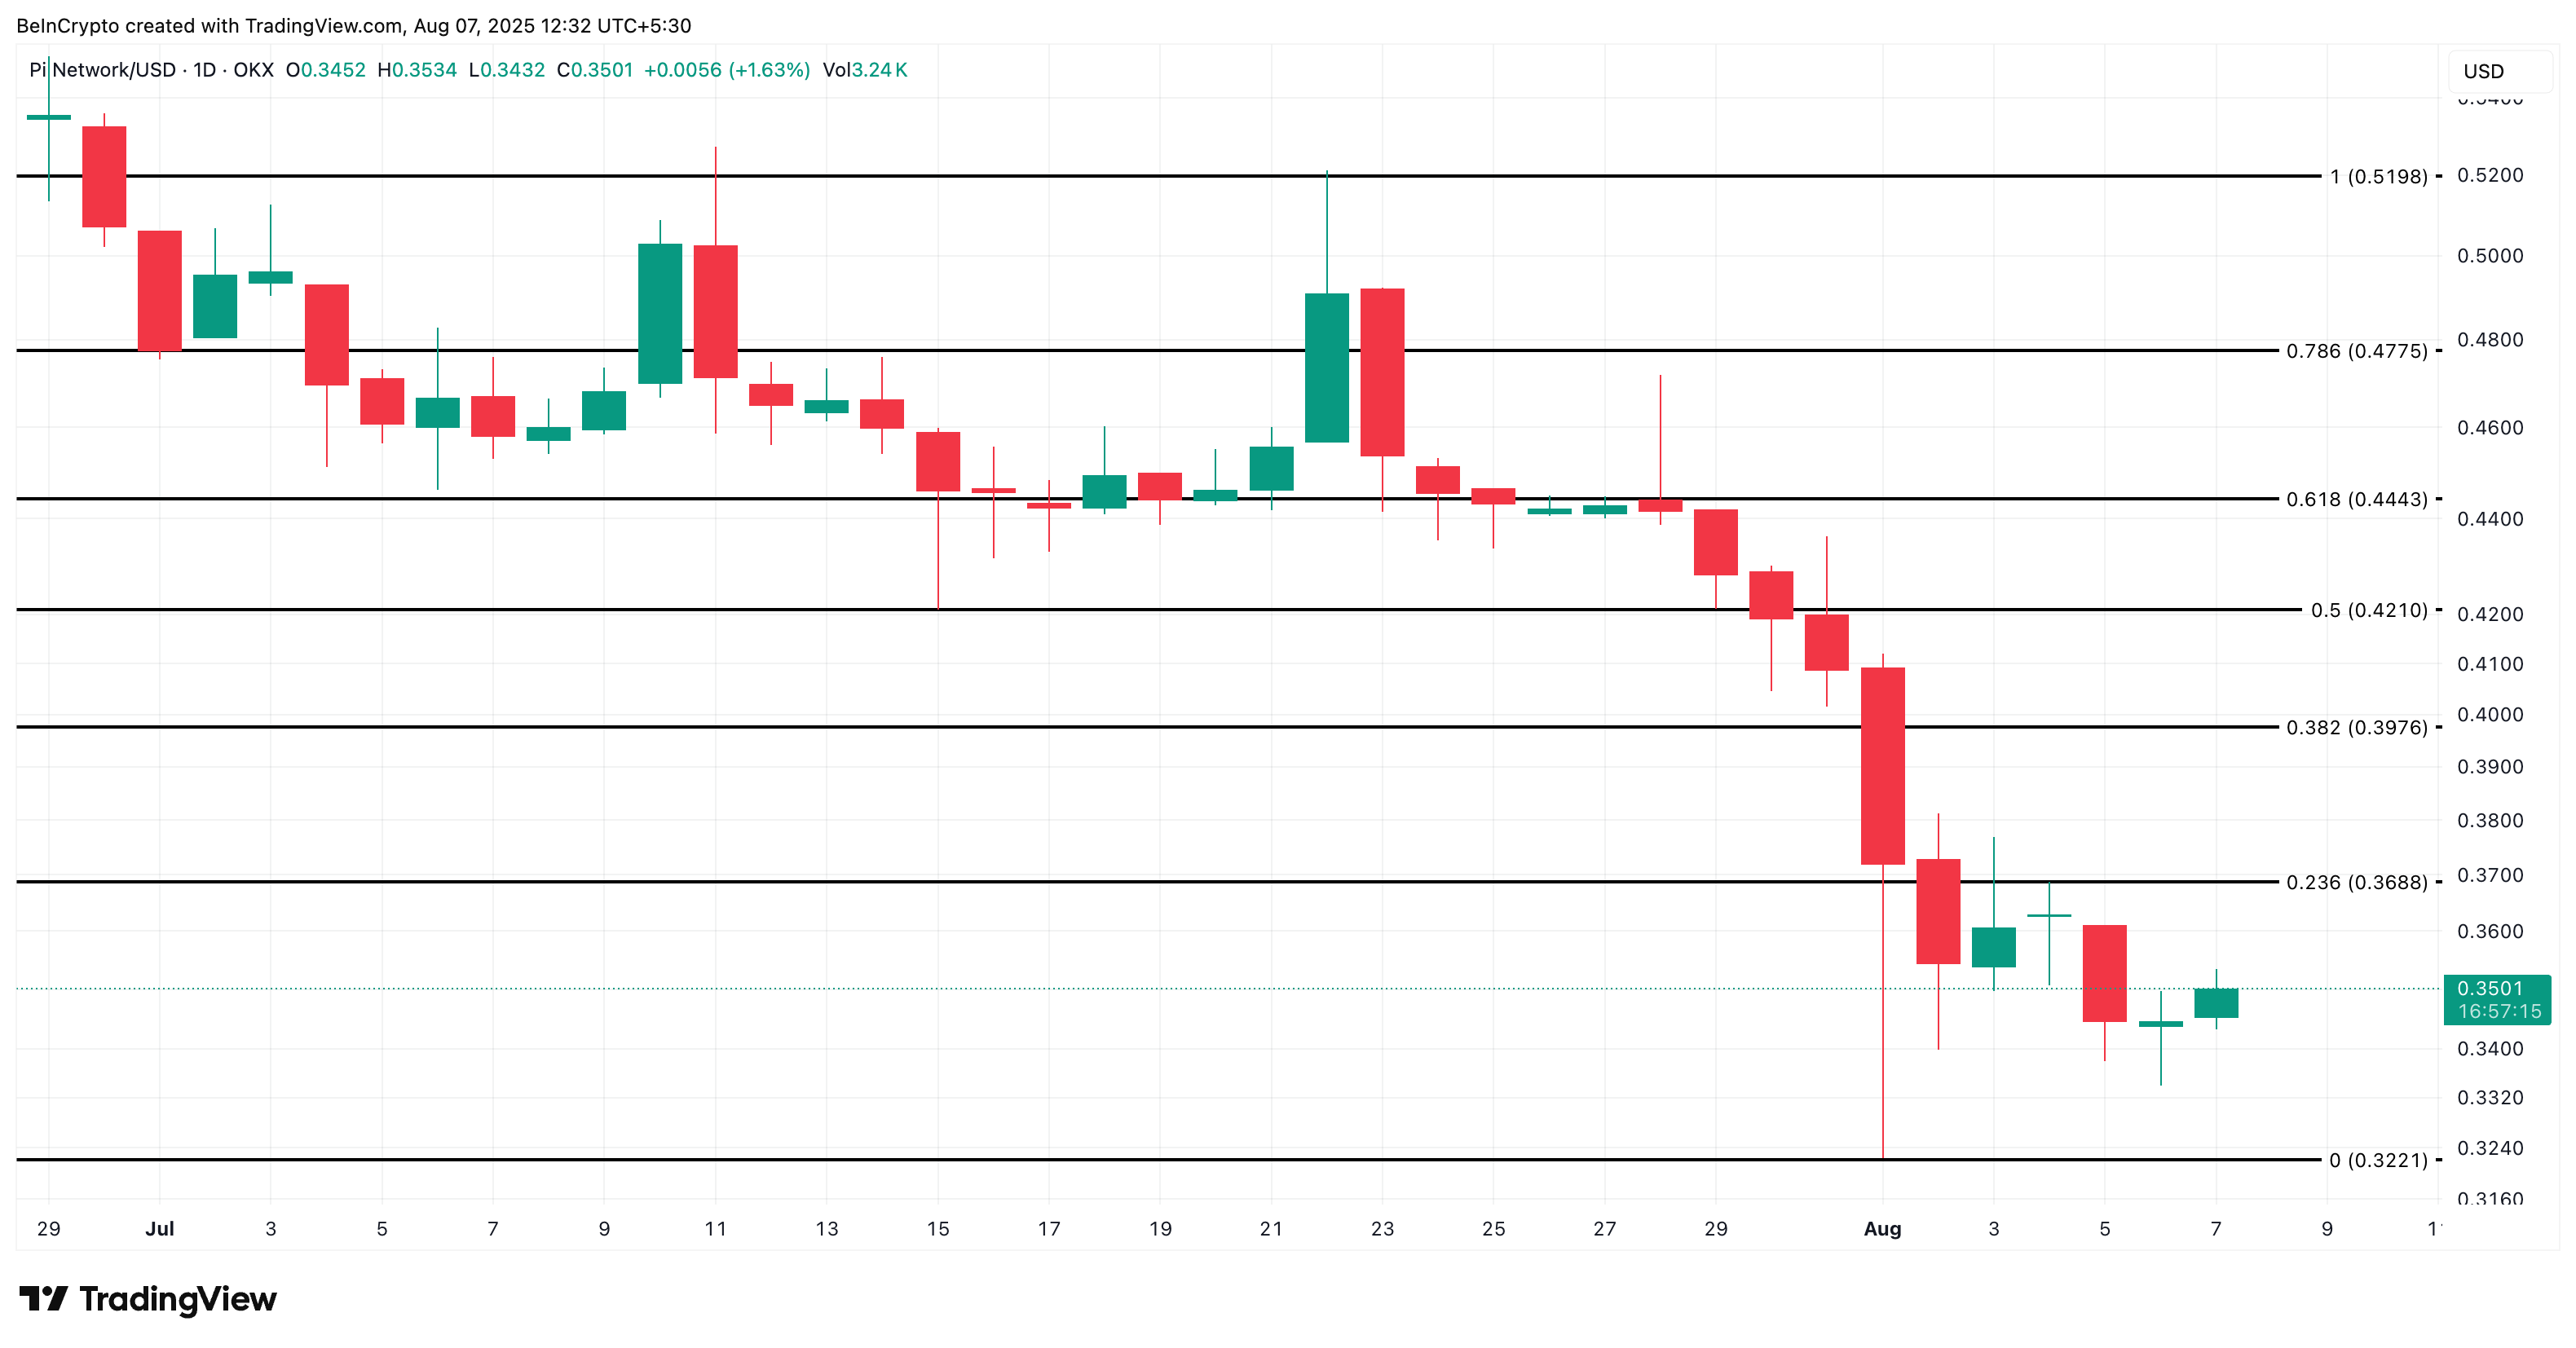 Pi Coin price analysis:
PI price invalidation lies near $0.32; if that breaks, the current pattern fails and fresh lows are likely.
Disclaimer: The content of this article solely reflects the author's opinion and does not represent the platform in any capacity. This article is not intended to serve as a reference for making investment decisions.
You may also like
Federal Reserve's Transparency Debate: Is Silence Really Golden?
Federal Reserve Chair Waller advocates for a "quieter" central bank approach, seeking to eliminate forward guidance and dot plots, but faces public resistance within the institution. Amid volatile inflation data and uncertain rate hike prospects, colleagues frequently speak out to stabilize market expectations. Complete silence risks amplifying market fluctuations, so Waller must weigh policy transparency against the need for balanced communication in his upcoming speech.
Direxion Daily Semiconductor Bear ETF gains 13.63%, faces $42.90 upper Bollinger band

As AI momentum begins to recede, Buffett-style "boring investments" quietly make a comeback
After years of AI and momentum trading dominance, the "quality factor" investment strategy is making a strong comeback. Driven by the repricing of interest rate expectations and slowing profit growth, capital is shifting focus from chasing growth to emphasizing profit quality and robust balance sheets. The long quality, short momentum strategy has surged 55% so far this year. The quality factor is negatively correlated with AI; amid crowded momentum positions, Warren Buffett's philosophy of steadfastly holding high-quality assets is once again gaining recognition on Wall Street.

Crypto prices
More


