Bitget App
Trade smarter
Buy cryptoMarketsTradeFuturesStocksEarnInstitutionAI & More
OMNI Just Broke Out, 25% Pump After 7x Volume Spike

OMNI Just Broke Out, 25% Pump After 7x Volume Spike

CoinspeakerCoinspeaker2025/08/06 16:00
By:By Parth Dubey Editor Hamza Tariq

Omni Network (OMNI) has surged 25% in a sharp breakout from a long-term downtrend, driven by a 770% spike in trading volume.

Key Notes

  • OMNI surged 25% in 24 hours following a 770% increase in trading volume.
  • The token broke out of a long-term descending wedge, signaling trend reversal.
  • Despite the rally, OMNI struggles to hold above the key $5 support level.

Omni Network OMNI $4.87 24h volatility: 23.5% Market cap: $190.05 M Vol. 24h: $408.82 M shot up 25% in the past 24 hours following a massive 770% increase in trading volume. The token reached an intraday high of $5.35 before retreating to $4.83 at the time of writing.

The sudden jump provides a much-needed relief to investors following recent struggles as OMNI remains 83.9% below its all-time high of $29.93.

OMNI hit rock bottom just a month ago, touching a historic low of $1.37. Since then, the asset has shown strong signs of recovery.

However, the token has not yet managed to hold above the $5 mark, a solid support level if sustained .

Wedge Breakout Triggered OMNI Rally

A key factor behind OMNI’s explosive move appears to be a clear breakout from a long-standing descending wedge pattern. The formation, visible on the daily chart, had been containing the token’s price since early April.

$OMNI broke the falling wedge.

Retest holding strong.

Next leg could send it +270%.

Momentum’s real. pic.twitter.com/SRXhFoHft2

— Smith (@CryptoSmith0x) August 7, 2025


The wedge’s narrowing structure signaled decreasing volatility, but the eventual breakout to the upside confirmed a potential shift in trend.

The breakout followed an expansion in the Bollinger Bands, indicating rising volatility. The price climbed above the 20-day simple moving average, which often acts as a short-term trend guide, reinforcing the strength of the breakout.

OMNI Price Analysis: Momentum Is Building

The MACD has made a bullish crossover, suggesting a potential beginning of a new uptrend. However, the histogram remains relatively flat, indicating that the strength of this trend has not yet matured.

The RSI currently stands at 67.5, just below the overbought threshold and the BoP indicator also currently favors buyers.

However, the CMF remains in negative territory at -0.20, suggesting that capital inflows have not yet fully supported the price rise.
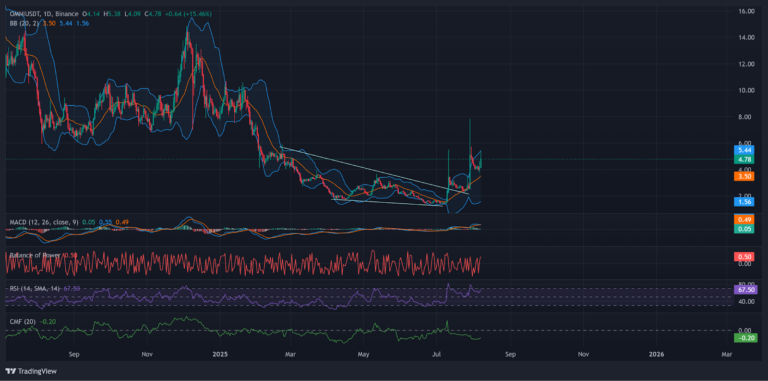
OMNI Just Broke Out, 25% Pump After 7x Volume Spike image 0

OMNI daily chart with momentum indicators. | Source: TradingView

If OMNI is able to turn $5 into support, the next resistance is located around $5.44, which is aligned with the upper Bollinger Band.

A break above this zone might allow OMNI to approach the $6.30 to $6.50 range, where previous price action encountered selling pressure in late 2024. If momentum continues, a move toward $8 could also come into play.

On the other hand, if OMNI drops below the $4 to $3.50 zone, the bullish structure could weaken. In that case, support would be near the 20-day moving average, followed by the lower boundary of the wedge, around $2.90.

A further breakdown could drive prices toward the $2 region, potentially placing OMNI at risk of retesting its all-time low.


0
0

Disclaimer: The content of this article solely reflects the author's opinion and does not represent the platform in any capacity. This article is not intended to serve as a reference for making investment decisions.

Understand the market, then trade.
Bitget offers one-stop trading for cryptocurrencies, stocks, and gold.
Trade now!

You may also like

Quarterly Revenue Hits 16.8 Billion for IPO Push—Can Anthropic’s Profits Support a $2 Trillion Valuation?

Anthropic disclosed Q3 revenue of $16.8 billion and achieved adjusted profitability. Compared to OpenAI's expectations and projected massive losses in 2025, the analysis covers Anthropic's enterprise growth logic, competitive landscape, and the rationality of its $2 trillion valuation.

智通财经•2026/10/15 09:07

"Bullish" Burry Issues Another Warning for US Stocks: If the "Magnificent Seven" Join the Drop and Bond Yields Fall, Wall Street May Face a "Bloody October"

Burry warns that the painful trading in the market may continue. He proposes a bearish "Red October" scenario: if the "Magnificent Seven" U.S. tech stocks follow semiconductor stocks in a decline, and bond yields simultaneously fall, his conviction in this scenario will become even stronger.

智通财经•2026/10/15 08:46
"Bullish" Burry Issues Another Warning for US Stocks: If the "Magnificent Seven" Join the Drop and Bond Yields Fall, Wall Street May Face a "Bloody October"

Tesla (TSLA.US) to Host Roadster Launch Event This Friday: Elon Musk Promises "Greatest Product Demo Ever," Debut of the Nine-Year-Teased "Flying Sports Car"

On the eve of the Roadster launch event, Elon Musk promised to deliver "the greatest product demonstration in history."

智通财经•2026/10/15 08:37
Tesla (TSLA.US) to Host Roadster Launch Event This Friday: Elon Musk Promises "Greatest Product Demo Ever," Debut of the Nine-Year-Teased "Flying Sports Car"

Tech Stocks Plunge, Safe-Haven U.S. Treasury Trades Return? 10-Year U.S. Treasury Yield Drops to Three-Week Low

If AI capital expenditure slows down, a sudden halt in computing power construction will severely impact the supply chain while lowering market expectations for demand in electricity, commodities, and high-end hardware. This not only leads to a correction of overvalued assets, but also undermines growth expectations and inflation premiums, ultimately benefiting bonds. This logic is highly similar to the macroeconomic landscape during the bursting of the internet bubble in 2000, when the Nasdaq collapsed and the yield on 10-year US Treasury bonds dropped from a high of 6.5% to the 4% range.

华尔街见闻•2026/10/15 08:29