
Technical Indicators Align for Solana as Bulls Target $180 Barrier Next

Solana has gained nearly 10% in the past few days, with bulls showing signs of reclaiming control. Positive technical indicators, including a rising RSI and BoP, support the rally — but SOL now faces a crucial resistance level at $176.33 that will determine whether further gains are possible.
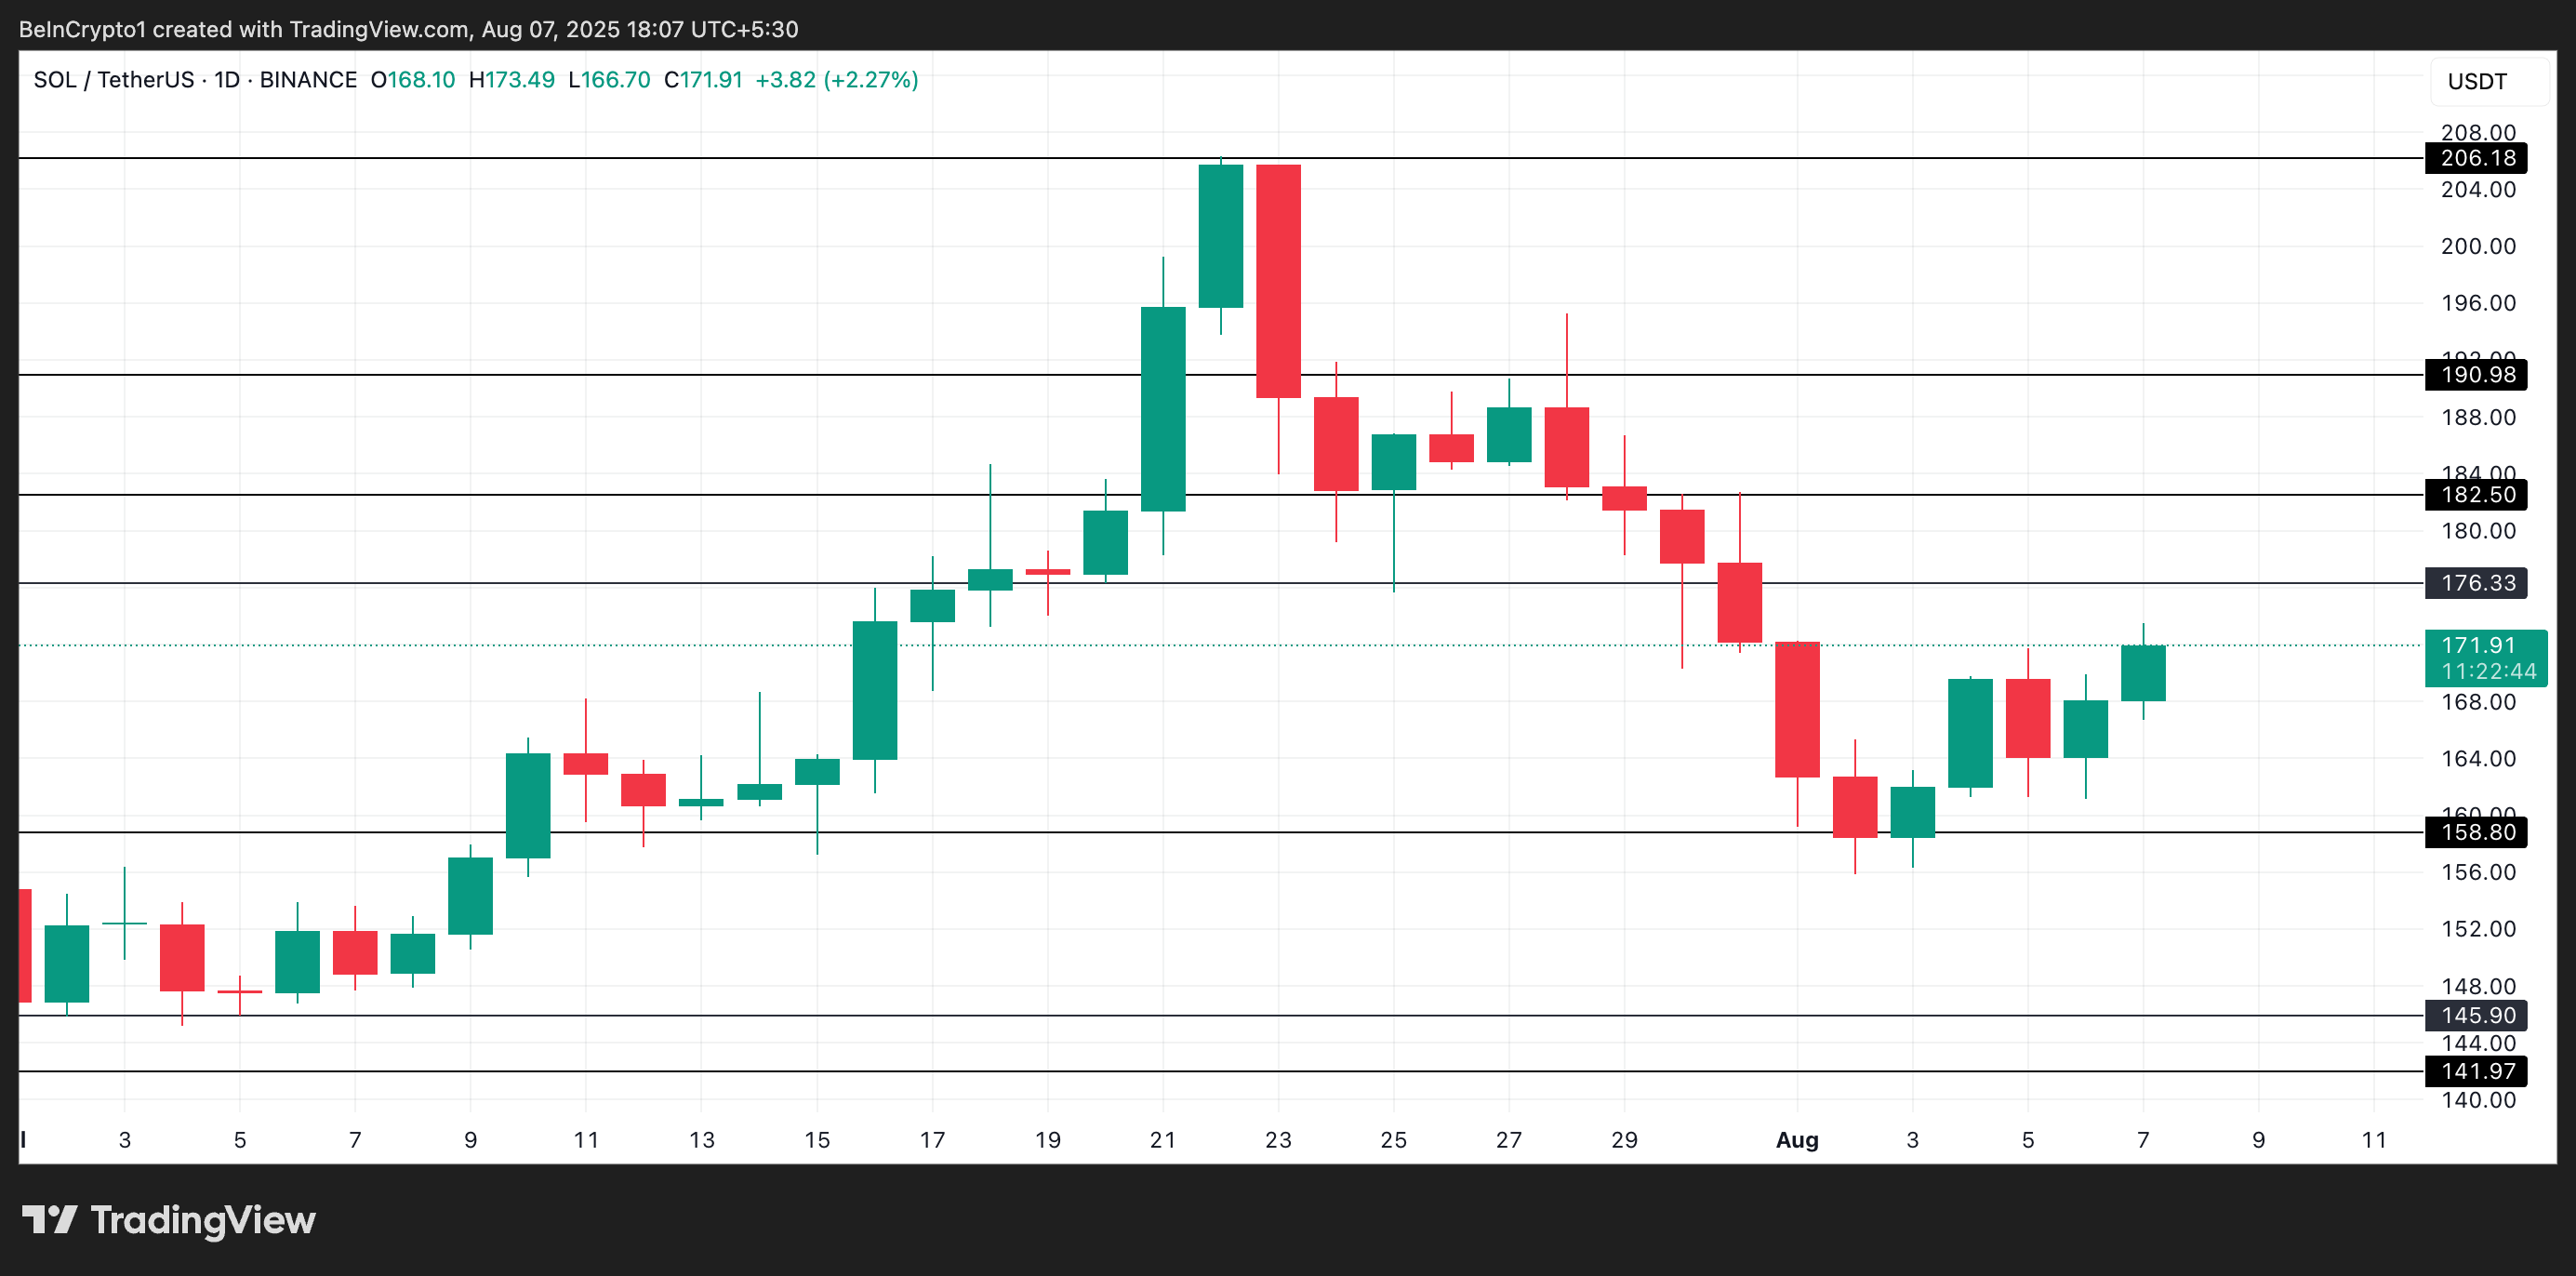
Popular altcoin Solana has seen a modest recovery, climbing upward since August 2. Despite earlier weakness, the token has since rallied nearly 10%, reaching $171.91 at press time.
The uptick suggests a potential shift in sentiment, with technical indicators hinting at a continuation of the uptrend.
SOL Price Recovery Gains Steam
Readings from the SOL/USD one-day chart show a gradual resurgence of bullish momentum among SOL holders.
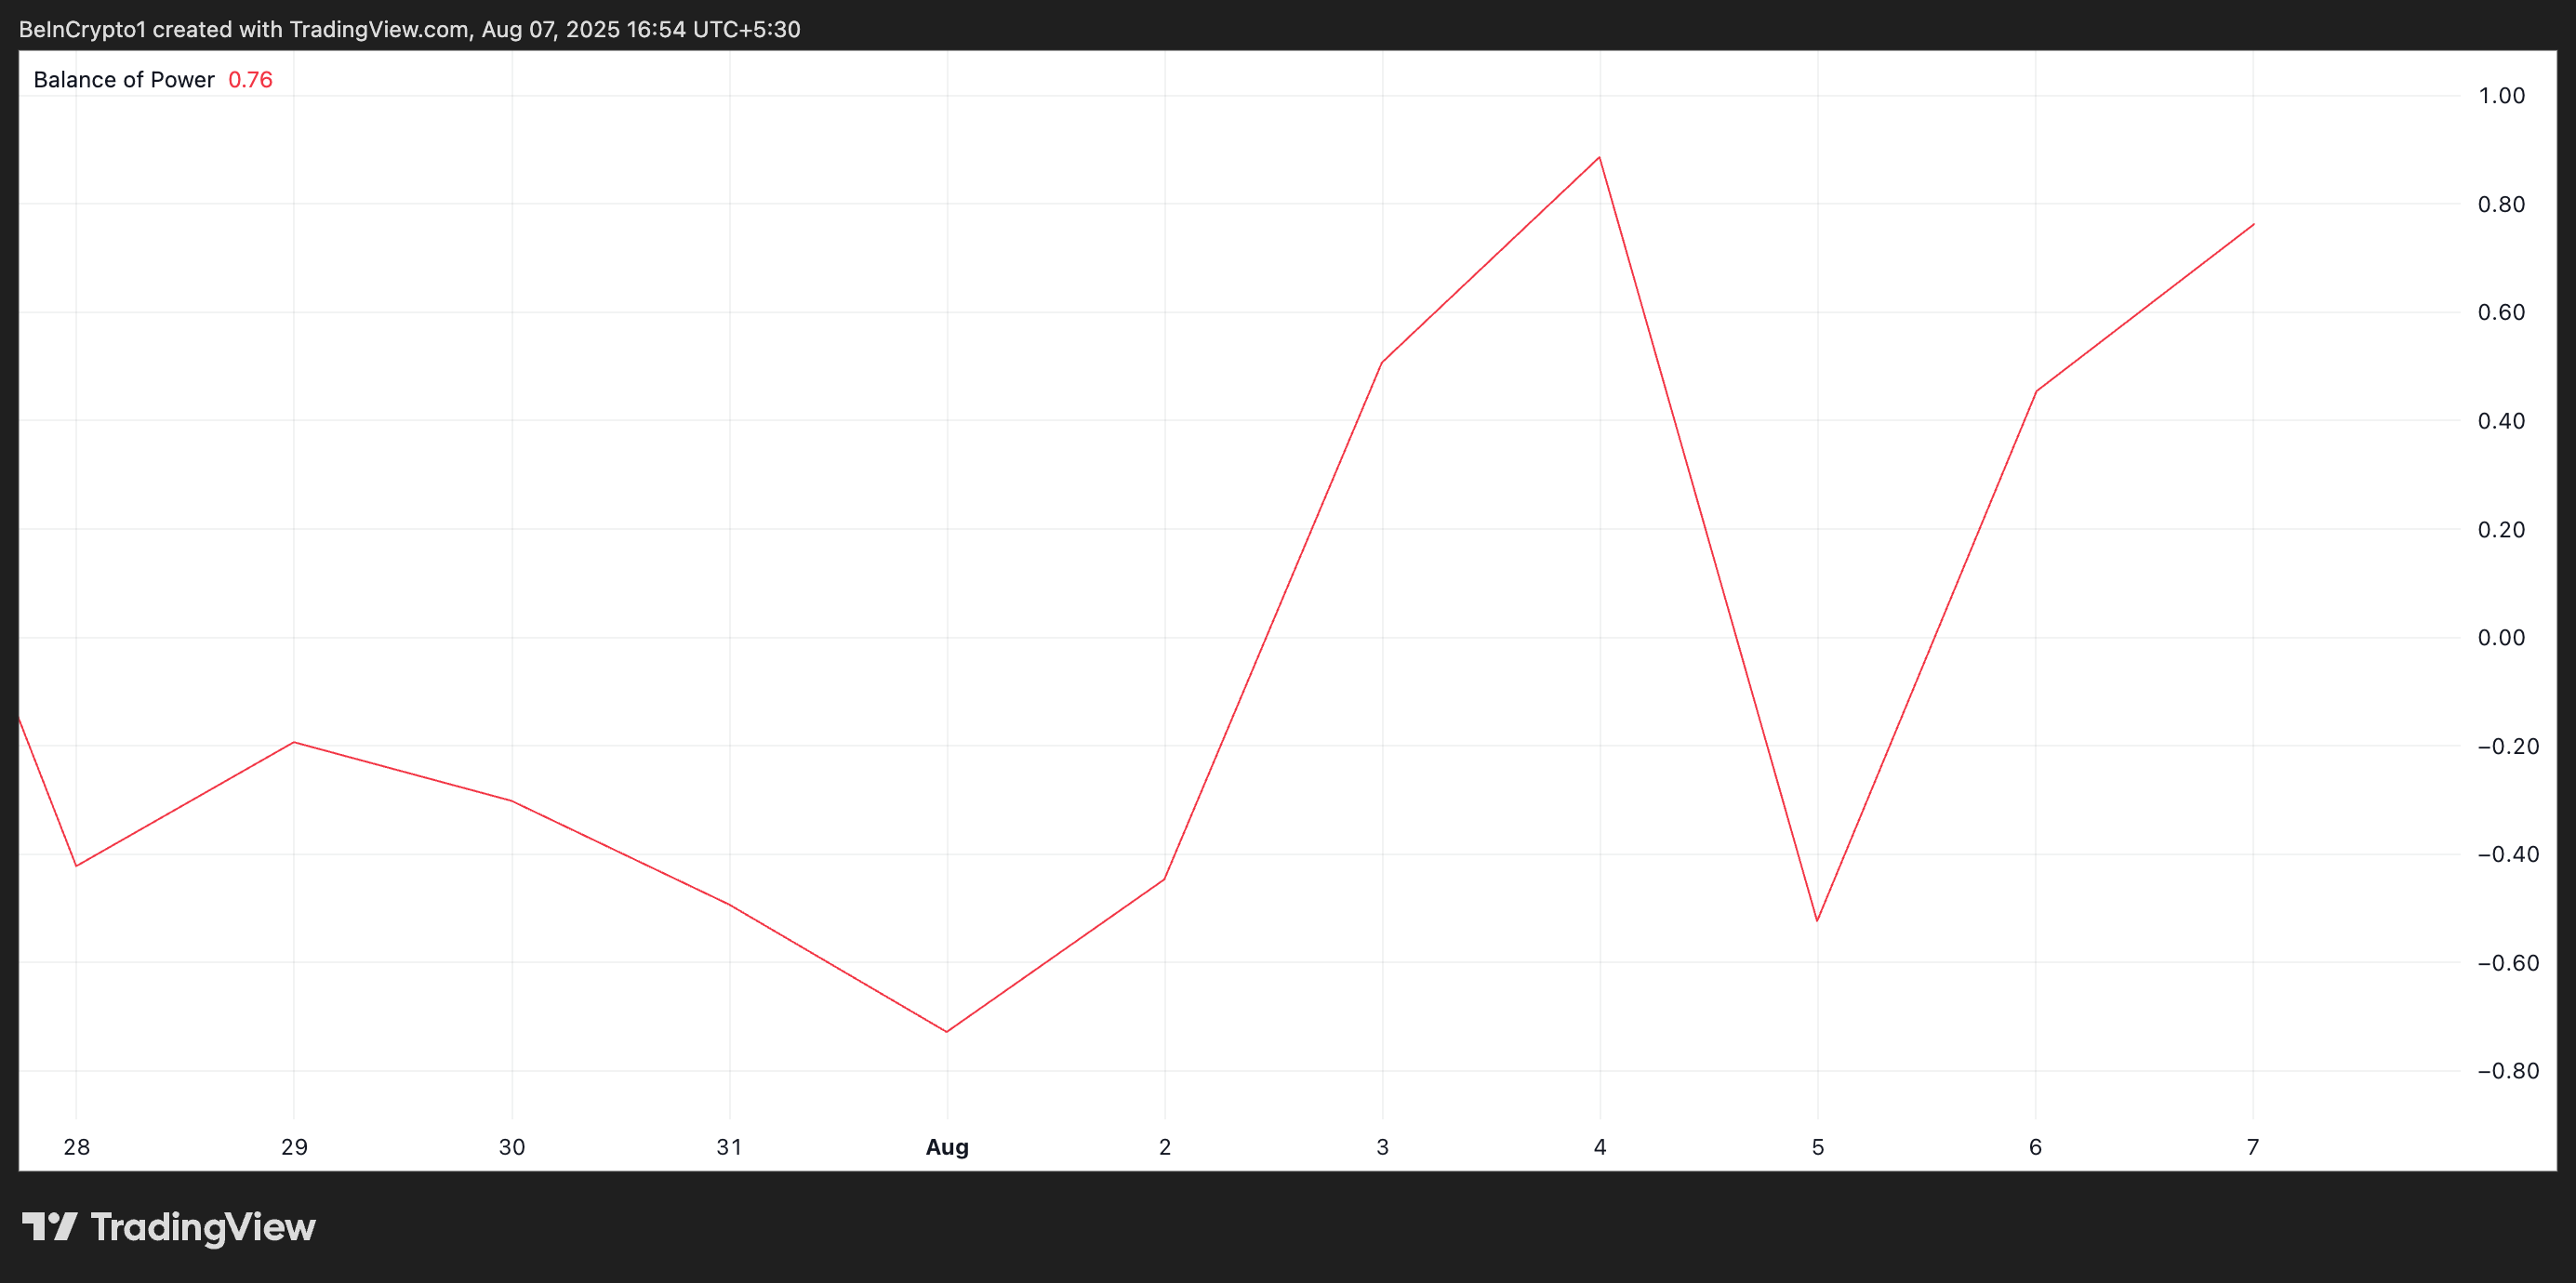
For example, its Balance of Power (BoP) is positive as of this writing, indicating that bias is currently skewed in favor of the bulls. It is presently in an uptrend and stands at 0.76.For token TA and market updates: Want more token insights like this? Sign up for Editor Harsh Notariya’s Daily Crypto Newsletter
 SOL BoP. Source:
TradingView
SOL BoP. Source:
TradingView
The BoP measures the strength of buyers versus sellers in the market. It compares the price movement within a trading period to determine which side has more control. BoP values typically oscillate between -1 and +1.
A positive BoP suggests that buyers are dominating, pushing prices higher by closing near the top of the range, while a negative BoP indicates that sellers have the upper hand, closing prices near the bottom of the range.
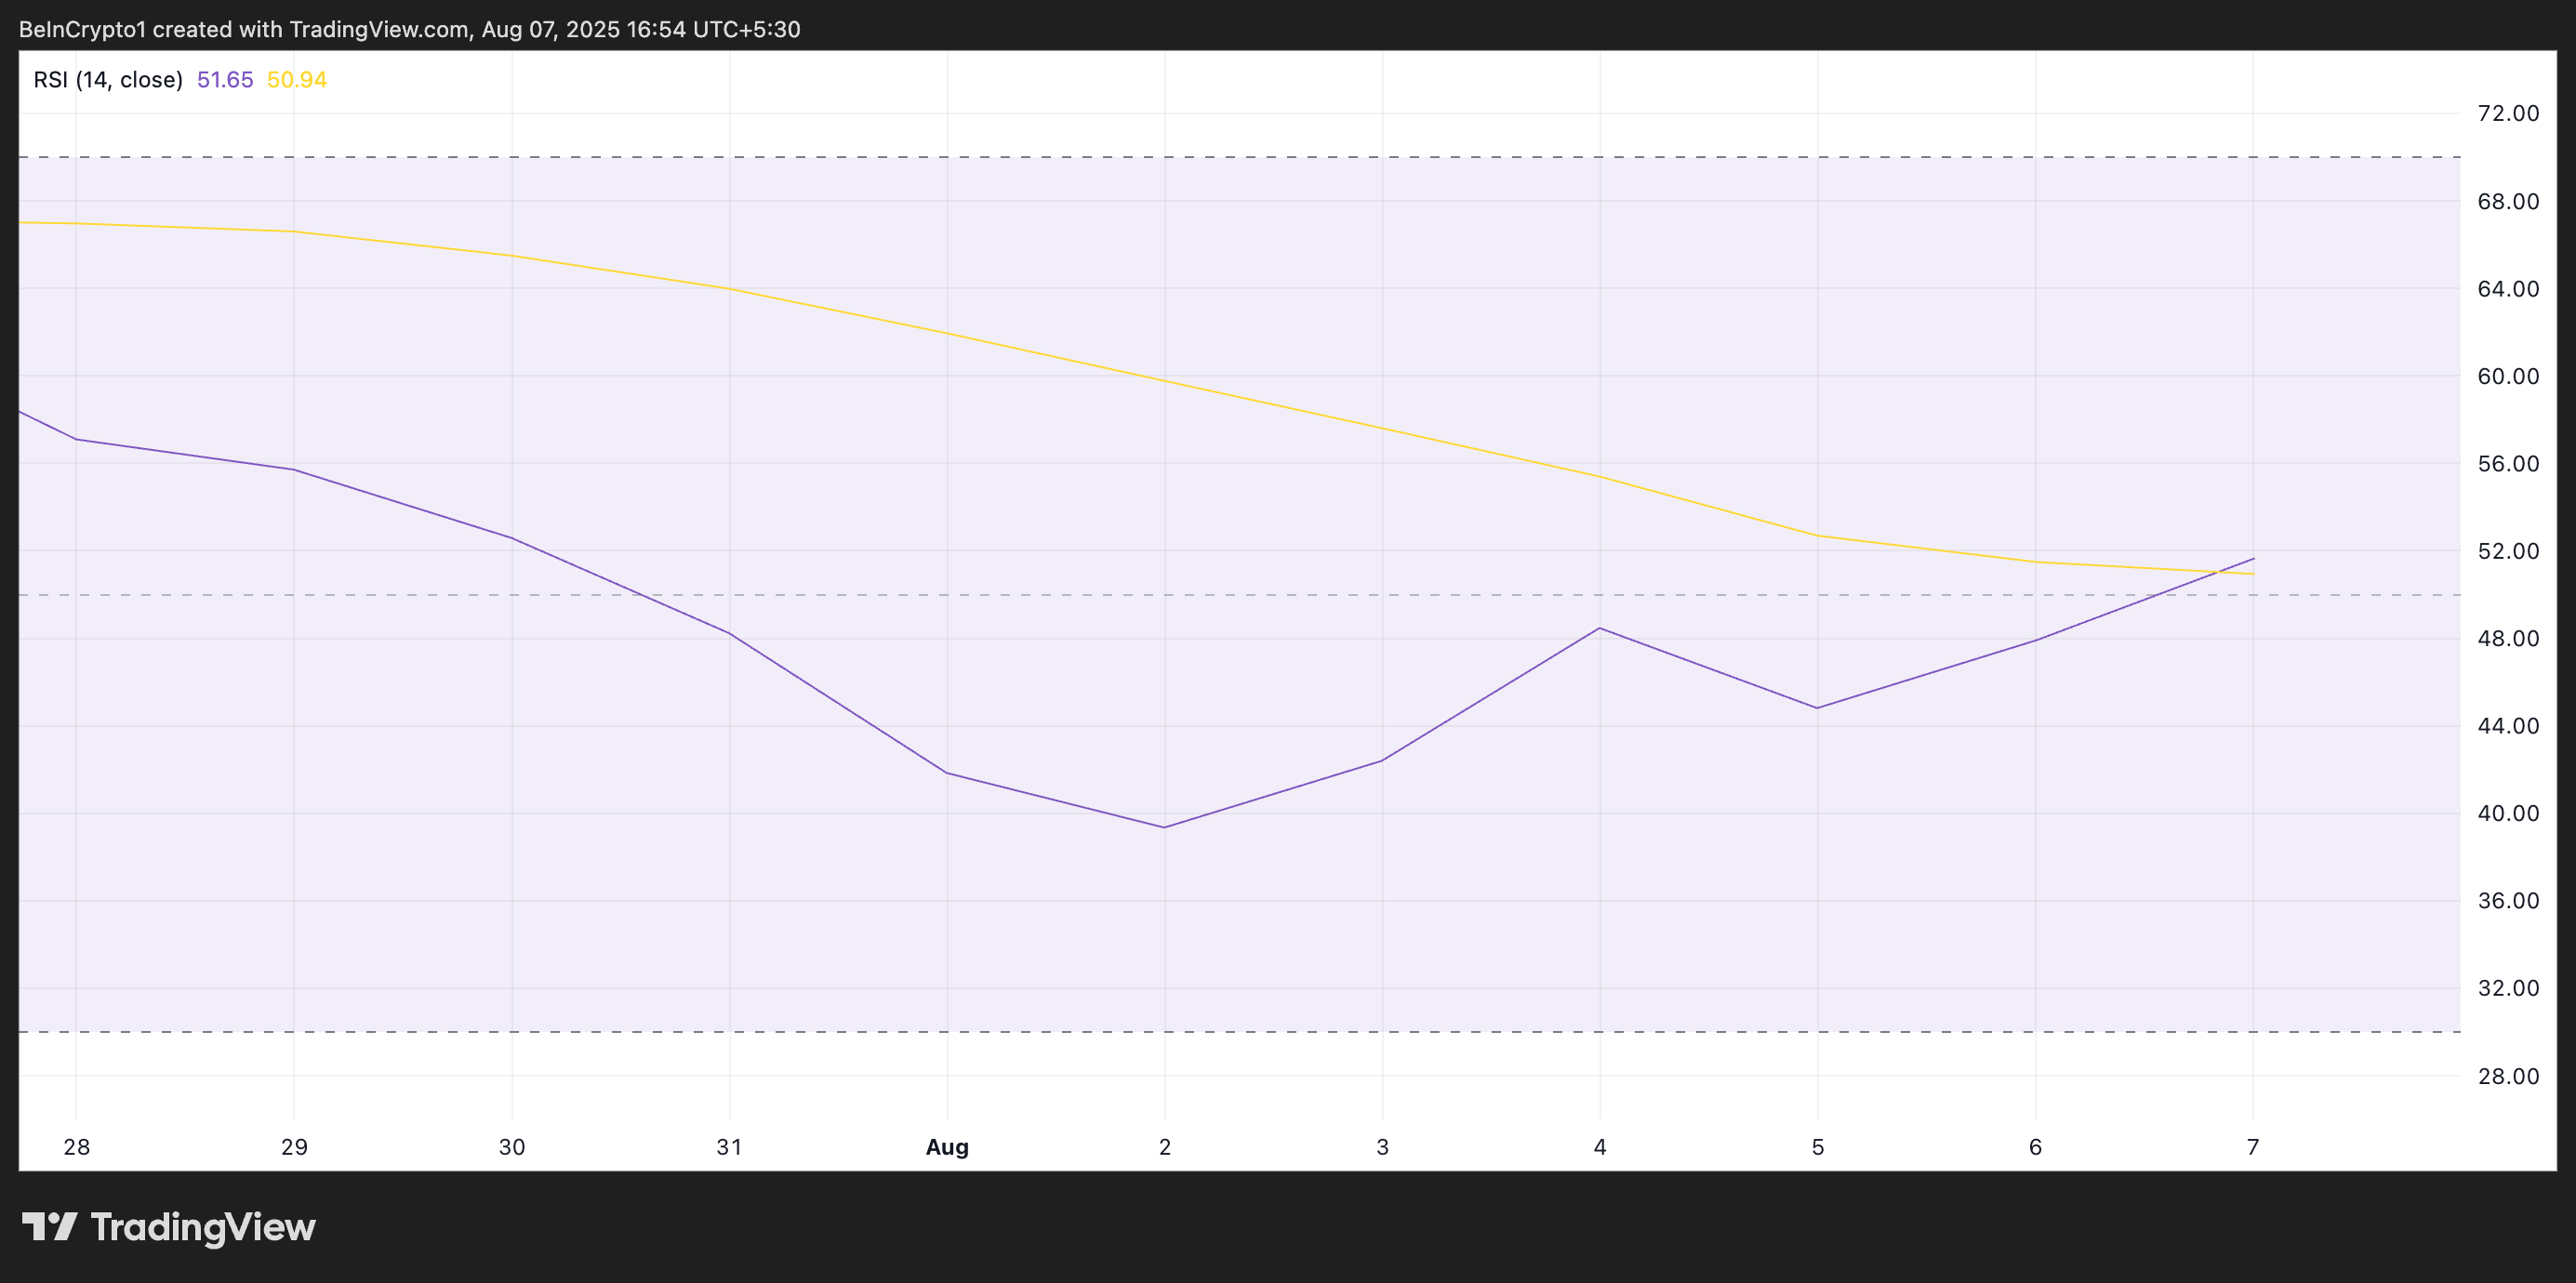
For SOL, its current positive BoP reading signals that bulls are gaining market control, strengthening the ongoing price recovery.Furthermore, the climbing Relative Strength Index (RSI) adds to the bullish outlook for SOL. This key momentum indicator currently stands at 51.65, ticking up, indicating a steady rise in buy-side pressure.
 SOL RSI. Source:
TradingView
SOL RSI. Source:
TradingView
The RSI indicator measures an asset’s overbought and oversold market conditions. It ranges between 0 and 100. Values above 70 suggest that the asset is overbought and due for a price decline, while values under 30 indicate that the asset is oversold and may witness a rebound.
At 51.65 and climbing, SOL’s RSI suggests strengthening bullish momentum. Its buyers are gradually regaining control, leaving room for further upside if demand continues to build.
SOL Price Approaches Make-or-Break Moment
A sustained wave of buying pressure could fuel a breakout above SOL’s immediate resistance at $176.33.
If this level is cleared with strong momentum, SOL may be poised to push past the psychological barrier at $180, opening the door to further gains.
 SOL Price Analysis. Source:
TradingView
SOL Price Analysis. Source:
TradingView
However, a shift in sentiment or renewed profit-taking could prevent this. If bears regain control, SOL’s price risks a pullback toward the $158.80 support level, erasing recent gains.
Disclaimer: The content of this article solely reflects the author's opinion and does not represent the platform in any capacity. This article is not intended to serve as a reference for making investment decisions.
You may also like
Quarterly Revenue Hits 16.8 Billion for IPO Push—Can Anthropic’s Profits Support a $2 Trillion Valuation?
Anthropic disclosed Q3 revenue of $16.8 billion and achieved adjusted profitability. Compared to OpenAI's expectations and projected massive losses in 2025, the analysis covers Anthropic's enterprise growth logic, competitive landscape, and the rationality of its $2 trillion valuation.
"Bullish" Burry Issues Another Warning for US Stocks: If the "Magnificent Seven" Join the Drop and Bond Yields Fall, Wall Street May Face a "Bloody October"
Burry warns that the painful trading in the market may continue. He proposes a bearish "Red October" scenario: if the "Magnificent Seven" U.S. tech stocks follow semiconductor stocks in a decline, and bond yields simultaneously fall, his conviction in this scenario will become even stronger.

Tesla (TSLA.US) to Host Roadster Launch Event This Friday: Elon Musk Promises "Greatest Product Demo Ever," Debut of the Nine-Year-Teased "Flying Sports Car"
On the eve of the Roadster launch event, Elon Musk promised to deliver "the greatest product demonstration in history."

Tech Stocks Plunge, Safe-Haven U.S. Treasury Trades Return? 10-Year U.S. Treasury Yield Drops to Three-Week Low
If AI capital expenditure slows down, a sudden halt in computing power construction will severely impact the supply chain while lowering market expectations for demand in electricity, commodities, and high-end hardware. This not only leads to a correction of overvalued assets, but also undermines growth expectations and inflation premiums, ultimately benefiting bonds. This logic is highly similar to the macroeconomic landscape during the bursting of the internet bubble in 2000, when the Nasdaq collapsed and the yield on 10-year US Treasury bonds dropped from a high of 6.5% to the 4% range.
Crypto prices
More


