
ENA Eyes Breakout Toward $1.25 as Price Reclaims Key Support


- ENA price reclaims crucial support, signaling a bullish pattern similar to its 2024 breakout.
- Analyst projects a potential rally to $1.25 if it breaks and holds above the resistance level.
- Rising open interest and positive funding suggest strong trader confidence in ENA’s uptrend.
Ethena’s native token, ENA, is showing signs of a major breakout. After months of consolidation, the asset is reclaiming key levels. This move has sparked interest across the crypto market, with traders watching for a repeat of last year’s rally. In November 2024, ENA surged 120% in just 22 days. That breakout began at the same $0.51 support level the price has now reclaimed. At press time, the token was trading near $0.63 after gaining over 1.5% in 24 hours.
Retesting Crucial Resistance After Failed 2024 Breakout
ENA previously struggled at the $0.65 resistance zone. In late 2024, the asset briefly broke above this level. However, it quickly reversed, forming a potential bull trap. Prices fell sharply afterward, bottoming out near $0.24. That reversal formed the basis for a long accumulation phase. As buying momentum returned, the token began a strong upward trend.
As of this week, ENA is once again testing the $0.65 resistance. This time, the chart shows a stronger market structure. Analysts point to increased volume and conviction. A breakout above this level could signal a move toward the $1.25–$1.40 zone.
Crypto analyst Ali shared the chart comparing the current setup to the 2024 breakout. He noted that the previous rally followed a similar reclaim of support. A grey projected path shows a possible breakout above $0.70. That path targets $1.25 as a medium-term goal. Key levels include the mid-range at $0.65 and resistance above $1.25.
Bullish Momentum Builds as Open Interest Rises
Recent market activity supports the bullish view. Open Interest (OI) in ENA futures has climbed back above $1 billion. This follows a short dip to $916 million after last week’s price drop. Open Interest reflects the number of outstanding contracts. Increased OI is usually an indication of increasing trader conviction. Many investors are entering long positions, betting on continued upside. Funding rate also remains positive, which also confirms a bullish sentiment.
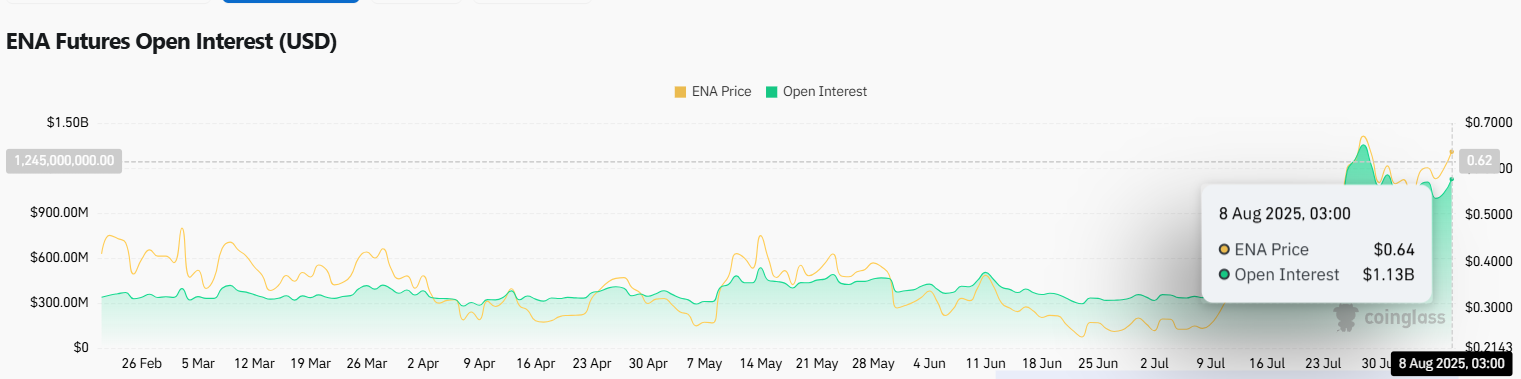 Source:
Coinglass
Source:
Coinglass
Technical momentum matches this trend. ENA is forming higher lows and higher highs on the 12-hour chart. It has broken out of months of sideways movement and strongly followed through above $0.60. The next major resistance is at $0.70. In case ENA breaks and sustains above this level, it may aim at $1.00 and $1.25. This might happen in case bulls defend the support levels.
Related: Altcoin Momentum Builds as BTC Dominance Continues to Drop
Ethena Labs is gaining traction in the DeFi space with its latest offering, Liquid Leverage, which debuted in late July. The new tool enables users to earn yield on USDe, Ethena’s synthetic dollar, by staking it. It integrates with Aave to boost leverage strategies. The product drew $1.5 billion in deposits within days of launch. This increase in demand reflects rising interest in the Ethena ecosystem. It also adds credibility to ENA’s recent price gains.
With a strong technical structure and mounting interest, traders are observing ENA’s next move. Once it breaks out of $0.70 and holds, it could see another rally. The momentum in market, along with derivatives data and historical trends, suggests further upside as long as key levels hold.
The post ENA Eyes Breakout Toward $1.25 as Price Reclaims Key Support appeared first on Cryptotale.
Disclaimer: The content of this article solely reflects the author's opinion and does not represent the platform in any capacity. This article is not intended to serve as a reference for making investment decisions.
You may also like
Tech Stocks Plunge, Safe-Haven U.S. Treasury Trades Return? 10-Year U.S. Treasury Yield Drops to Three-Week Low
If AI capital expenditure slows down, a sudden halt in computing power construction will severely impact the supply chain while lowering market expectations for demand in electricity, commodities, and high-end hardware. This not only leads to a correction of overvalued assets, but also undermines growth expectations and inflation premiums, ultimately benefiting bonds. This logic is highly similar to the macroeconomic landscape during the bursting of the internet bubble in 2000, when the Nasdaq collapsed and the yield on 10-year US Treasury bonds dropped from a high of 6.5% to the 4% range.
BlackRock (BLK.US) Q3 Conference Call: Huge Financing Demand for AI Infrastructure, Computing Power May Become a New Asset Class
BlackRock (BLK.US) will release its third-quarter 2026 earnings before the US stock market opens on October 14, followed by a conference call.

Litecoin falls 2% to $59.90 as traders watch key $59 support zone
Approaching the "Death Cross"! Korean stocks hit "Black Thursday", KOSPI continuously falls below the 200-day moving average, is a prolonged bear market coming?
Hit hard by rising US inflation and concerns over AI profitability, Korean stocks plummeted 7.57% in a single day on October 15, with two major indices triggering circuit breakers for the first time in two and a half months. Foreign investors have cumulatively sold over 16 trillion won ($12 billion) in eight days. Technical indicators are flashing warnings: the KOSPI has fallen more than 8% below its 200-day moving average, and if it cannot recover within two weeks, the probability of a prolonged bear market is as high as 43%; a "death cross" is expected to form after 16 trading days. The Q3 earnings season will serve as the final validation point.

Crypto prices
More


