
Stellar (XLM) Price Breaks Out With 100% Rally in Sight; But One Risk Remains

Stellar (XLM) price is showing signs of a major rally after a clean breakout. But one key on-chain metric hints at possible early profit-booking. Will it stall the move?
Stellar (XLM) price has jumped over 16% in the past 24 hours, breaking out of a bullish continuation pattern. While many traders might expect a pullback, several technical indicators suggest this could be the beginning of a much bigger rally.
However, one on-chain metric throws in a caution flag that could slow things down.
Triple EMA Crossover Shows Strong Uptrend Setup
The 4-hour chart gives a clear view of trend momentum, and this is where the triple EMA crossover begins to show strength. The 20-period exponential moving average (EMA) has already crossed above both the 50 and 100 EMAs, and the 50 EMA is now closing in on a similar crossover above the 100 EMA.
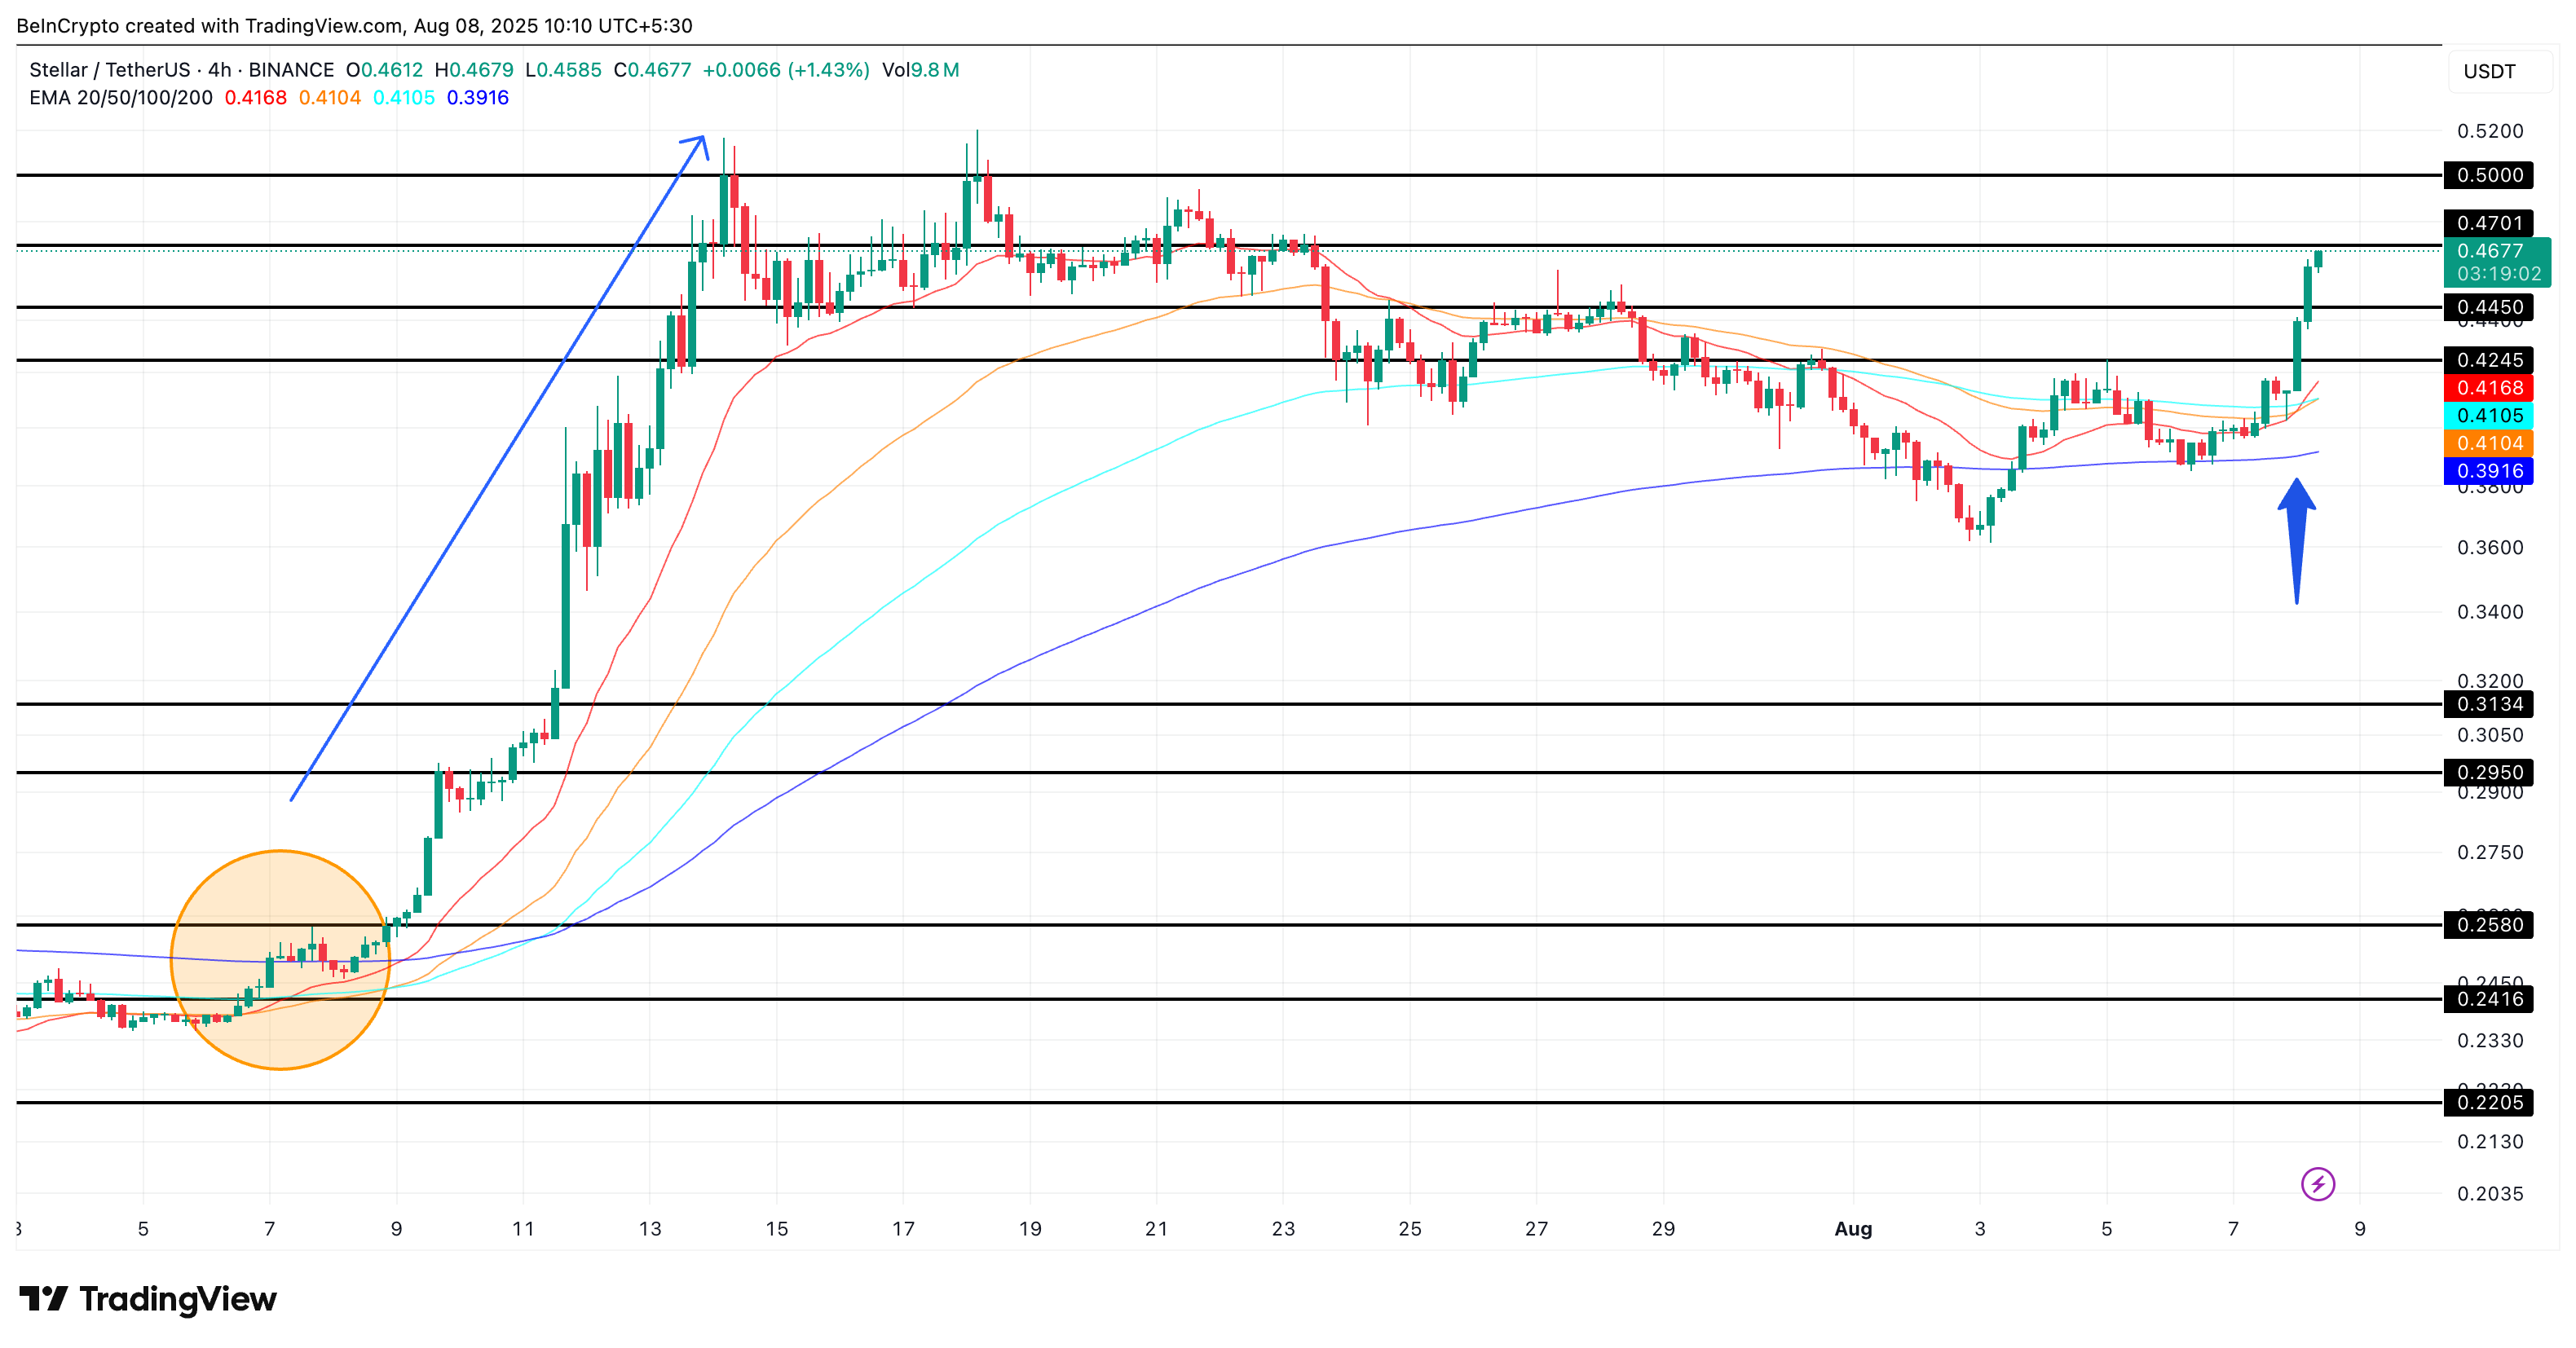 Stellar price and triple crossover:
An exponential moving average (EMA) is a technical tool that smooths price data, placing more weight on recent prices. It reacts faster to recent movements compared to a simple moving average (SMA). A “Golden Cross” occurs when a shorter EMA crosses above a longer one, commonly used by traders to confirm bullish trend reversals.
Historically, the last time this triple crossover setup occurred (in early July), Stellar price jumped from $0.23 to over $0.52; a 122% rally, give or take. This setup builds strong technical momentum as the price currently pushes above $0.46, with $0.50 as immediate psychological resistance and the $0.52–$0.97 range as the bullish extension zone.
For token TA and market updates: Want more token insights like this? Sign up for Editor Harsh Notariya’s Daily Crypto Newsletter.
Netflows Show Early Profit-Taking Risk
The one-week spot exchange netflow chart shows a jump from just $724,000 in the previous week to $9.12 million this week; an increase of over 1,159%. This metric tracks how much XLM is flowing onto or off exchanges. When flows rise, it usually signals traders moving tokens to exchanges to potentially sell.
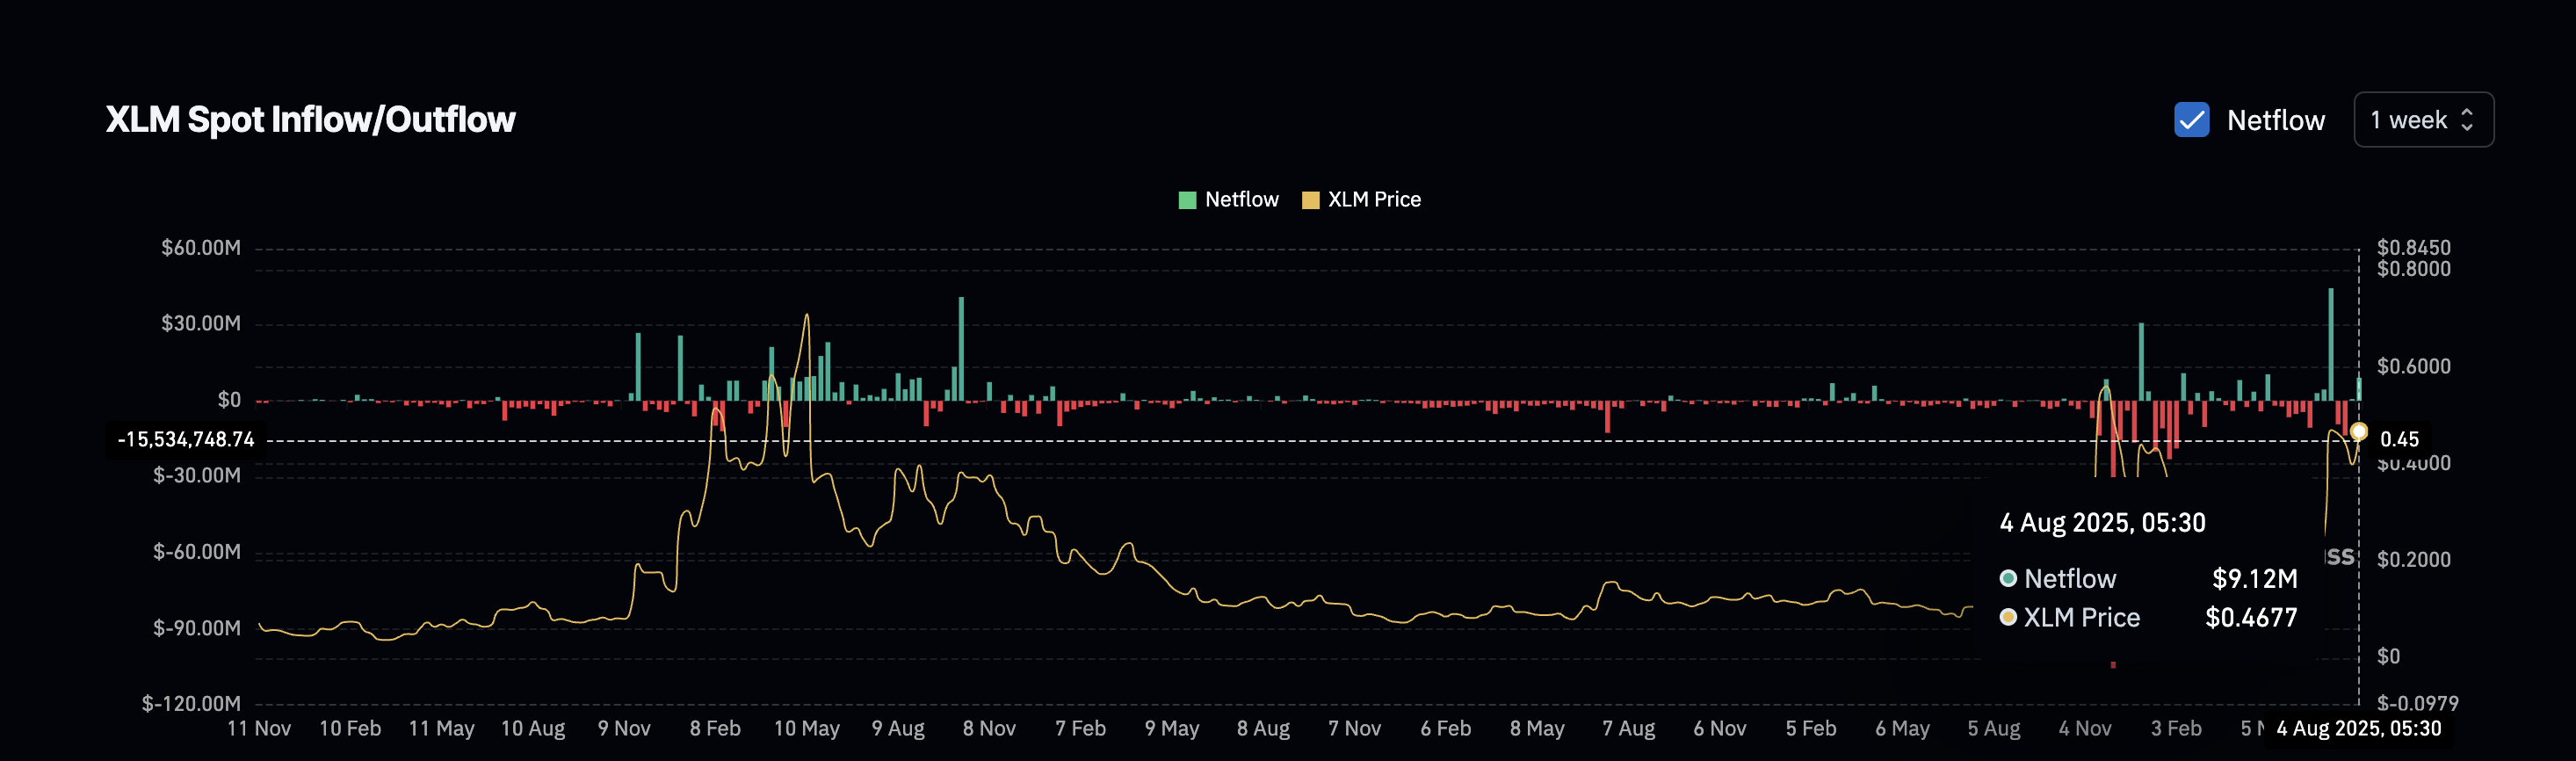 XLM Inflows increase after a few muted weeks:
This isn’t the first time this has happened. On June 23, 2024, netflows also flipped positive, and the Stellar price dropped from $0.26 to $0.24 shortly after. Another instance was on December 30, 2024, when a similar surge (after weeks of silence) in exchange inflows led to a short-term price correction.
So while the technical setup looks bullish, traders should stay alert for potential pullbacks triggered by profit-booking pressure in the coming sessions.
Bull-Bear Power Index Validates the Stellar Price Breakout
The pole-and-flag breakout on the daily chart adds further strength to the bullish argument. It starts with a strong price run (the pole), followed by a slanted consolidation (the flag), and a breakout usually leads to another leg up.
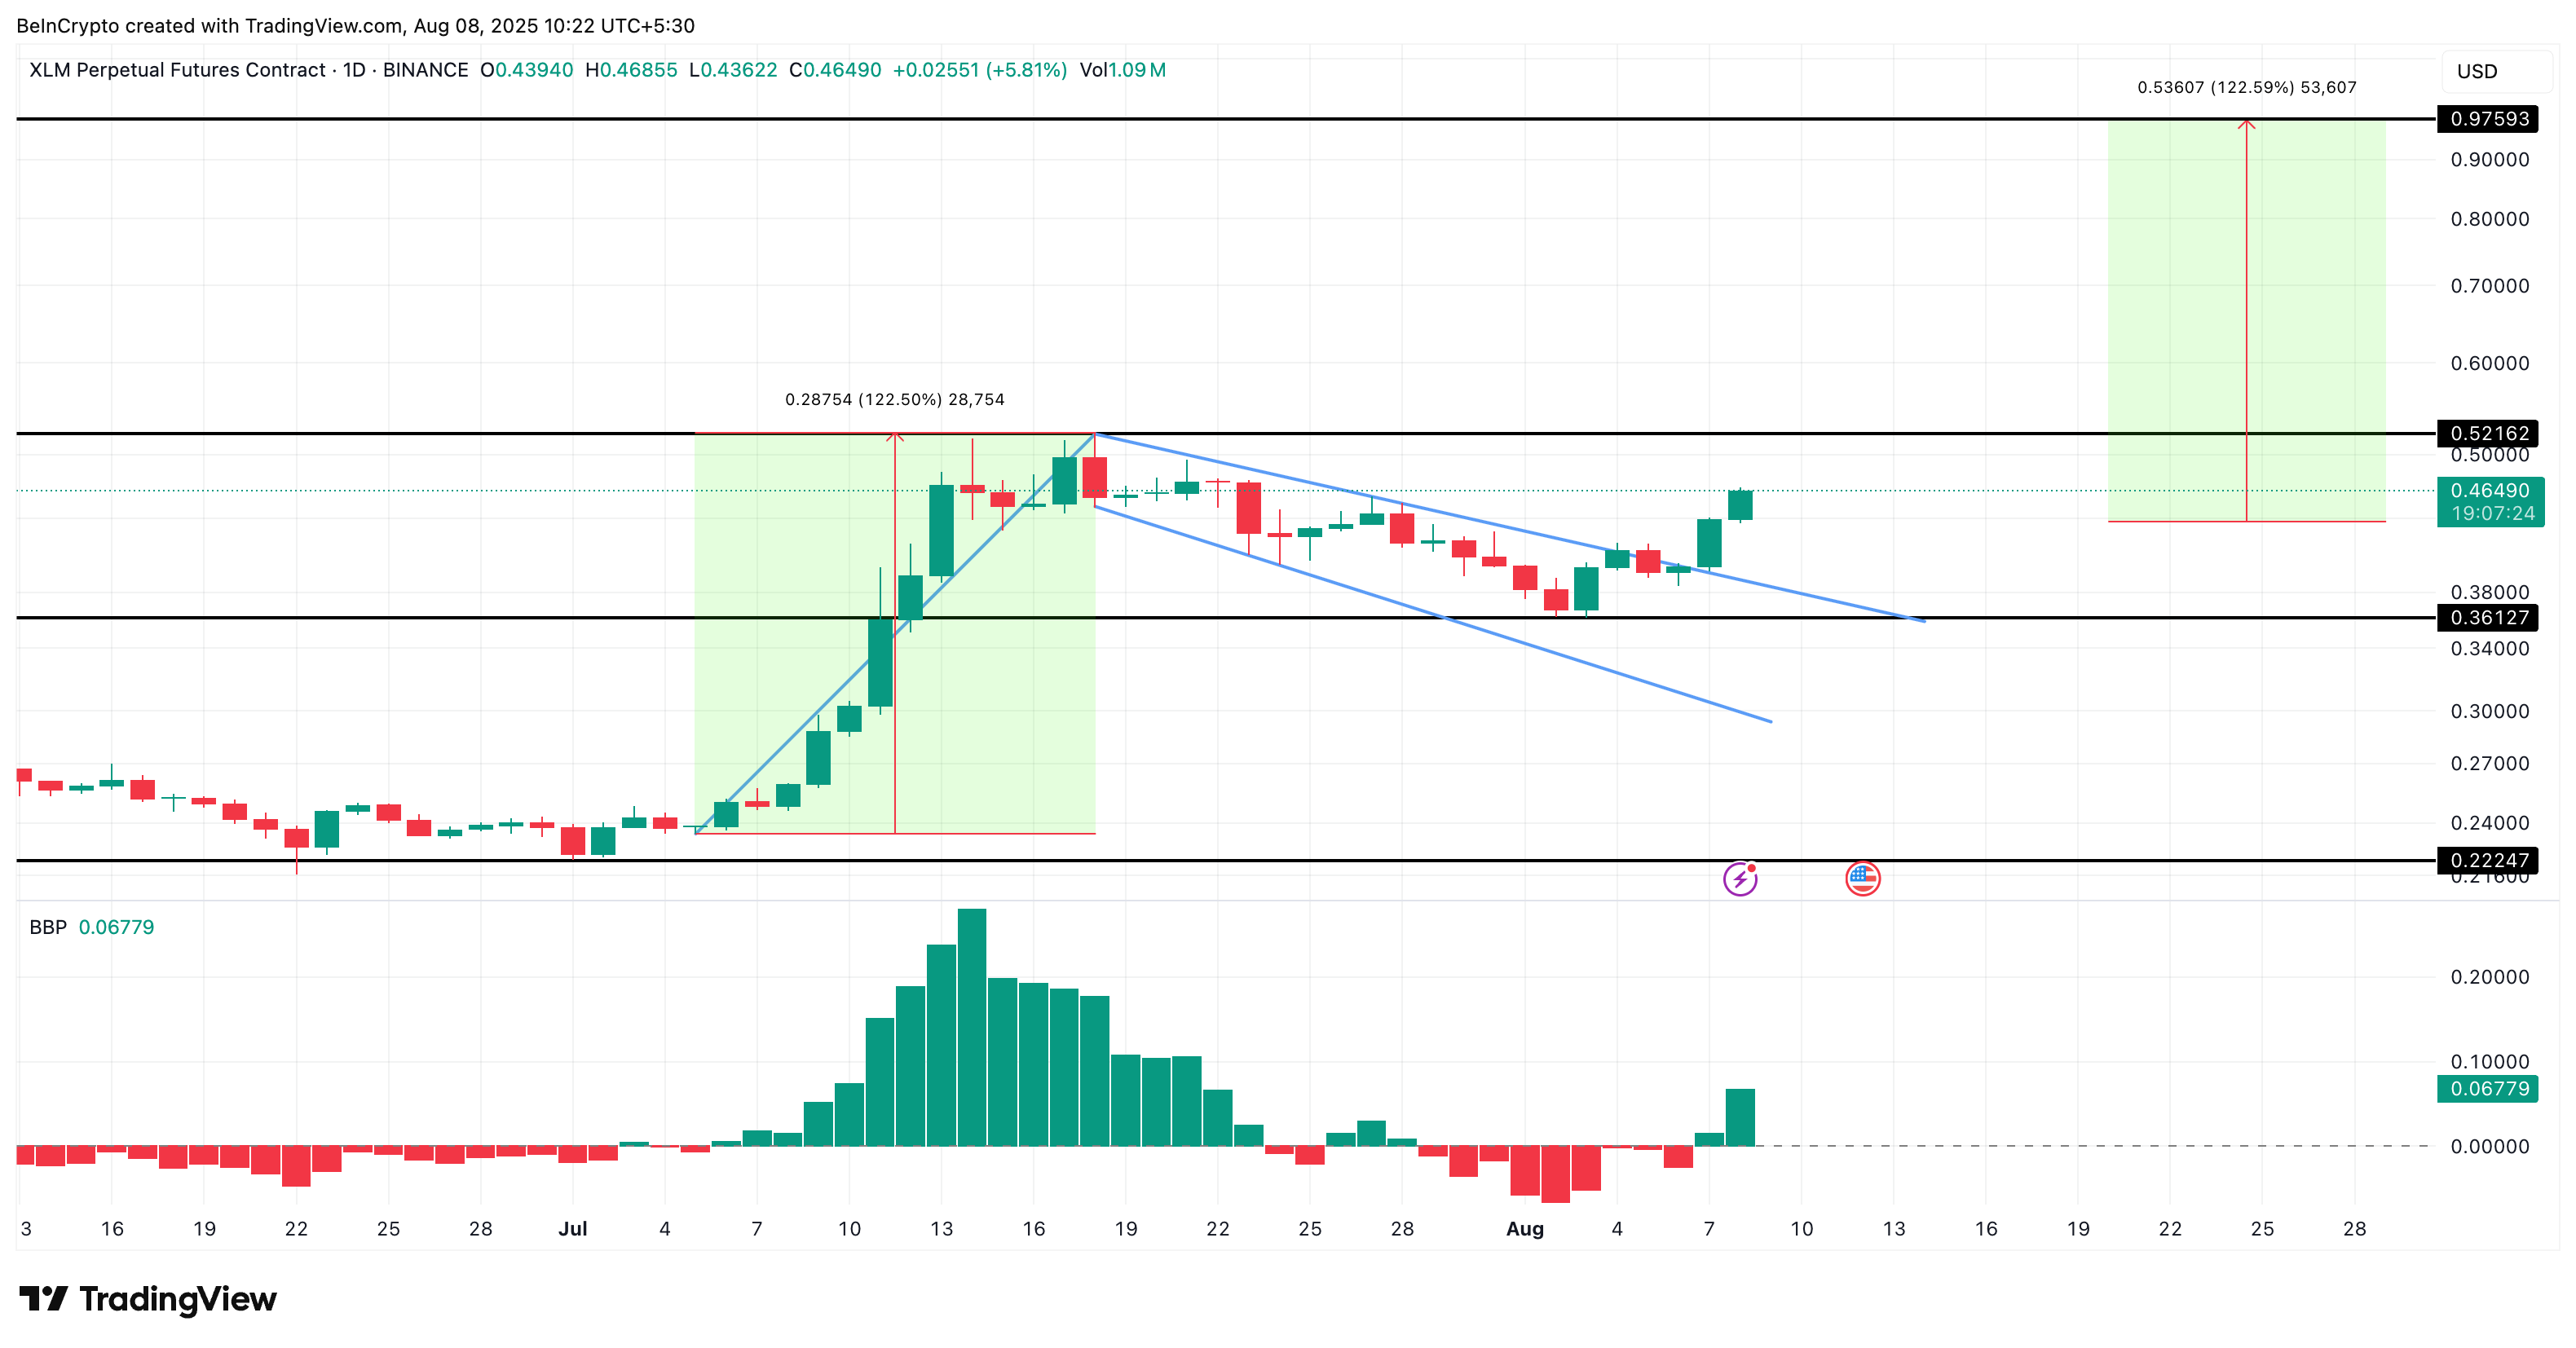 Stellar price analysis:
What makes this case stronger is the Bull-Bear Power (BBP) index, which has flipped green again. This indicator shows the difference between the highest price buyers were willing to pay and the lowest price sellers accepted. A green BBP during a breakout usually confirms that buying strength is returning.
With the pole measured from the $0.23 bottom to the $0.52 top, the same extension from the breakout candle’s close puts the next Stellar price target near $0.97, assuming the rally continues. Do note that the pole comprises the same XLM price rally zone that was previously mentioned as part of the concluded triple crossover. To form a clean upside move, Stellar price must first cross $0.52, the previous swing high, or the highest point of the pole.
However, the short-term bullish hypothesis gets invalidated if the Stellar price falls under $0.36, primarily led by increased selling pressure, as highlighted earlier.
Disclaimer: The content of this article solely reflects the author's opinion and does not represent the platform in any capacity. This article is not intended to serve as a reference for making investment decisions.
You may also like
Federal Reserve's Transparency Debate: Is Silence Really Golden?
Federal Reserve Chair Waller advocates for a "quieter" central bank approach, seeking to eliminate forward guidance and dot plots, but faces public resistance within the institution. Amid volatile inflation data and uncertain rate hike prospects, colleagues frequently speak out to stabilize market expectations. Complete silence risks amplifying market fluctuations, so Waller must weigh policy transparency against the need for balanced communication in his upcoming speech.
Direxion Daily Semiconductor Bear ETF gains 13.63%, faces $42.90 upper Bollinger band

As AI momentum begins to recede, Buffett-style "boring investments" quietly make a comeback
After years of AI and momentum trading dominance, the "quality factor" investment strategy is making a strong comeback. Driven by the repricing of interest rate expectations and slowing profit growth, capital is shifting focus from chasing growth to emphasizing profit quality and robust balance sheets. The long quality, short momentum strategy has surged 55% so far this year. The quality factor is negatively correlated with AI; amid crowded momentum positions, Warren Buffett's philosophy of steadfastly holding high-quality assets is once again gaining recognition on Wall Street.

Crypto prices
More


