Bitget App
Trade smarter
Buy cryptoMarketsTradeFuturesStocksEarnInstitutionAI & More
Uniswap (UNI) To Rise Higher? Key Fractal Signaling Potential Upside Move

Uniswap (UNI) To Rise Higher? Key Fractal Signaling Potential Upside Move

CoinsProbeCoinsProbe2025/08/09 01:15
By:Nilesh Hembade

Date: Fri, Aug 08, 2025 | 07:04 PM GMT

The cryptocurrency market is flashing bullish signals as Ethereum (ETH) reclaims the $4,000 mark for the first time since late 2024. This 6% daily jump has sparked a broader rally across major altcoins , with Uniswap (UNI) emerging as one of the standout performers.

UNI has turned green with an impressive 8% daily jump, extending its monthly gains to over 32%. However, its current chart structure reveals a familiar price behavior, which may offer clues about its next move.

Uniswap (UNI) To Rise Higher? Key Fractal Signaling Potential Upside Move image 0 Source: Coinmarketcap

Fractal Suggests a Breakout Rally May Repeat

A closer look at the UNI/USD daily chart reveals striking similarities to its price behavior in late 2024. During that period, UNI broke out of a sustained downtrend and entered a brief correction phase, shown by the shaded blue area. It found strong support near its 200-day moving average, then surged sharply, gaining over 81% and nearly touching the upper boundary of a long-term ascending channel.
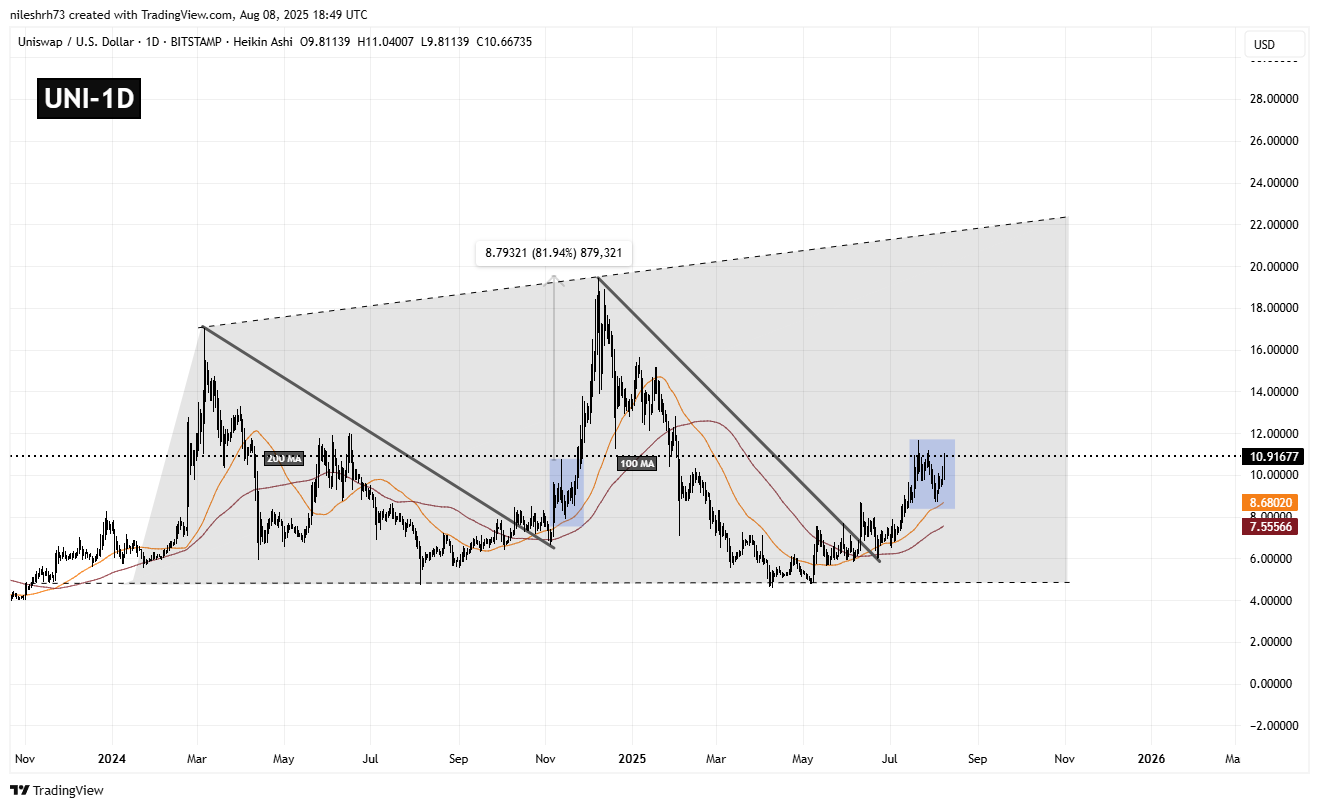
Uniswap (UNI) To Rise Higher? Key Fractal Signaling Potential Upside Move image 1 Uniswap (UNI) Daily Chart/Coinsprobe (Source: Tradingview)

Now, the price action appears to be following that same roadmap.

After breaking out of another downtrend, UNI once again corrected into a blue-shaded zone and found support around the 200-day moving average, which is currently near $8.68. From there, the token has rebounded and is now trading around $10.93. It’s inching closer to the next key level of interest — the top of the blue zone at $11.66, which could act as resistance just as it did previously.

What’s Next for UNI?

The bullish fractal scenario hinges on UNI’s ability to push above the $11.66 resistance level. If that breakout is confirmed, it could trigger another sharp rally, with the next major resistance level lining up near the $22.00 mark — right along the upper boundary of the long-term ascending channel.

This would represent a potential 100% move from current levels, similar to the surge seen in late 2024. However, the bullish case also depends heavily on UNI maintaining support above its 200-day moving average. A breakdown below $8.68 would weaken the setup significantly and could shift momentum in favor of further consolidation or even downside pressure, with the next key support around $7.55.
0
0

Disclaimer: The content of this article solely reflects the author's opinion and does not represent the platform in any capacity. This article is not intended to serve as a reference for making investment decisions.

Understand the market, then trade.
Bitget offers one-stop trading for cryptocurrencies, stocks, and gold.
Trade now!

You may also like

Tech Stocks Plunge, Safe-Haven U.S. Treasury Trades Return? 10-Year U.S. Treasury Yield Drops to Three-Week Low

If AI capital expenditure slows down, a sudden halt in computing power construction will severely impact the supply chain while lowering market expectations for demand in electricity, commodities, and high-end hardware. This not only leads to a correction of overvalued assets, but also undermines growth expectations and inflation premiums, ultimately benefiting bonds. This logic is highly similar to the macroeconomic landscape during the bursting of the internet bubble in 2000, when the Nasdaq collapsed and the yield on 10-year US Treasury bonds dropped from a high of 6.5% to the 4% range.

华尔街见闻•2026/10/15 08:29

BlackRock (BLK.US) Q3 Conference Call: Huge Financing Demand for AI Infrastructure, Computing Power May Become a New Asset Class

BlackRock (BLK.US) will release its third-quarter 2026 earnings before the US stock market opens on October 14, followed by a conference call.

智通财经•2026/10/15 08:19
BlackRock (BLK.US) Q3 Conference Call: Huge Financing Demand for AI Infrastructure, Computing Power May Become a New Asset Class

Approaching the "Death Cross"! Korean stocks hit "Black Thursday", KOSPI continuously falls below the 200-day moving average, is a prolonged bear market coming?

Hit hard by rising US inflation and concerns over AI profitability, Korean stocks plummeted 7.57% in a single day on October 15, with two major indices triggering circuit breakers for the first time in two and a half months. Foreign investors have cumulatively sold over 16 trillion won ($12 billion) in eight days. Technical indicators are flashing warnings: the KOSPI has fallen more than 8% below its 200-day moving average, and if it cannot recover within two weeks, the probability of a prolonged bear market is as high as 43%; a "death cross" is expected to form after 16 trading days. The Q3 earnings season will serve as the final validation point.

华尔街见闻•2026/10/15 08:12
Approaching the "Death Cross"! Korean stocks hit "Black Thursday", KOSPI continuously falls below the 200-day moving average, is a prolonged bear market coming?