
Why Aptos Could See More Downside After Unlocking $51 Million in APT

APT faces downward pressure as 11 million coins are unlocked, with a potential drop to $4.52 if bearish momentum persists.
Today kicked off with Aptos unlocking 11.31 million APT coins worth approximately $51 million, increasing its circulating supply.
With the surge in supply, combined with the dip in the broader market, and the growing desire among traders to make a profit, APT faces increased selling pressure that could worsen its price fall.
Aptos Price Weakens Amid Rising Selling Activity
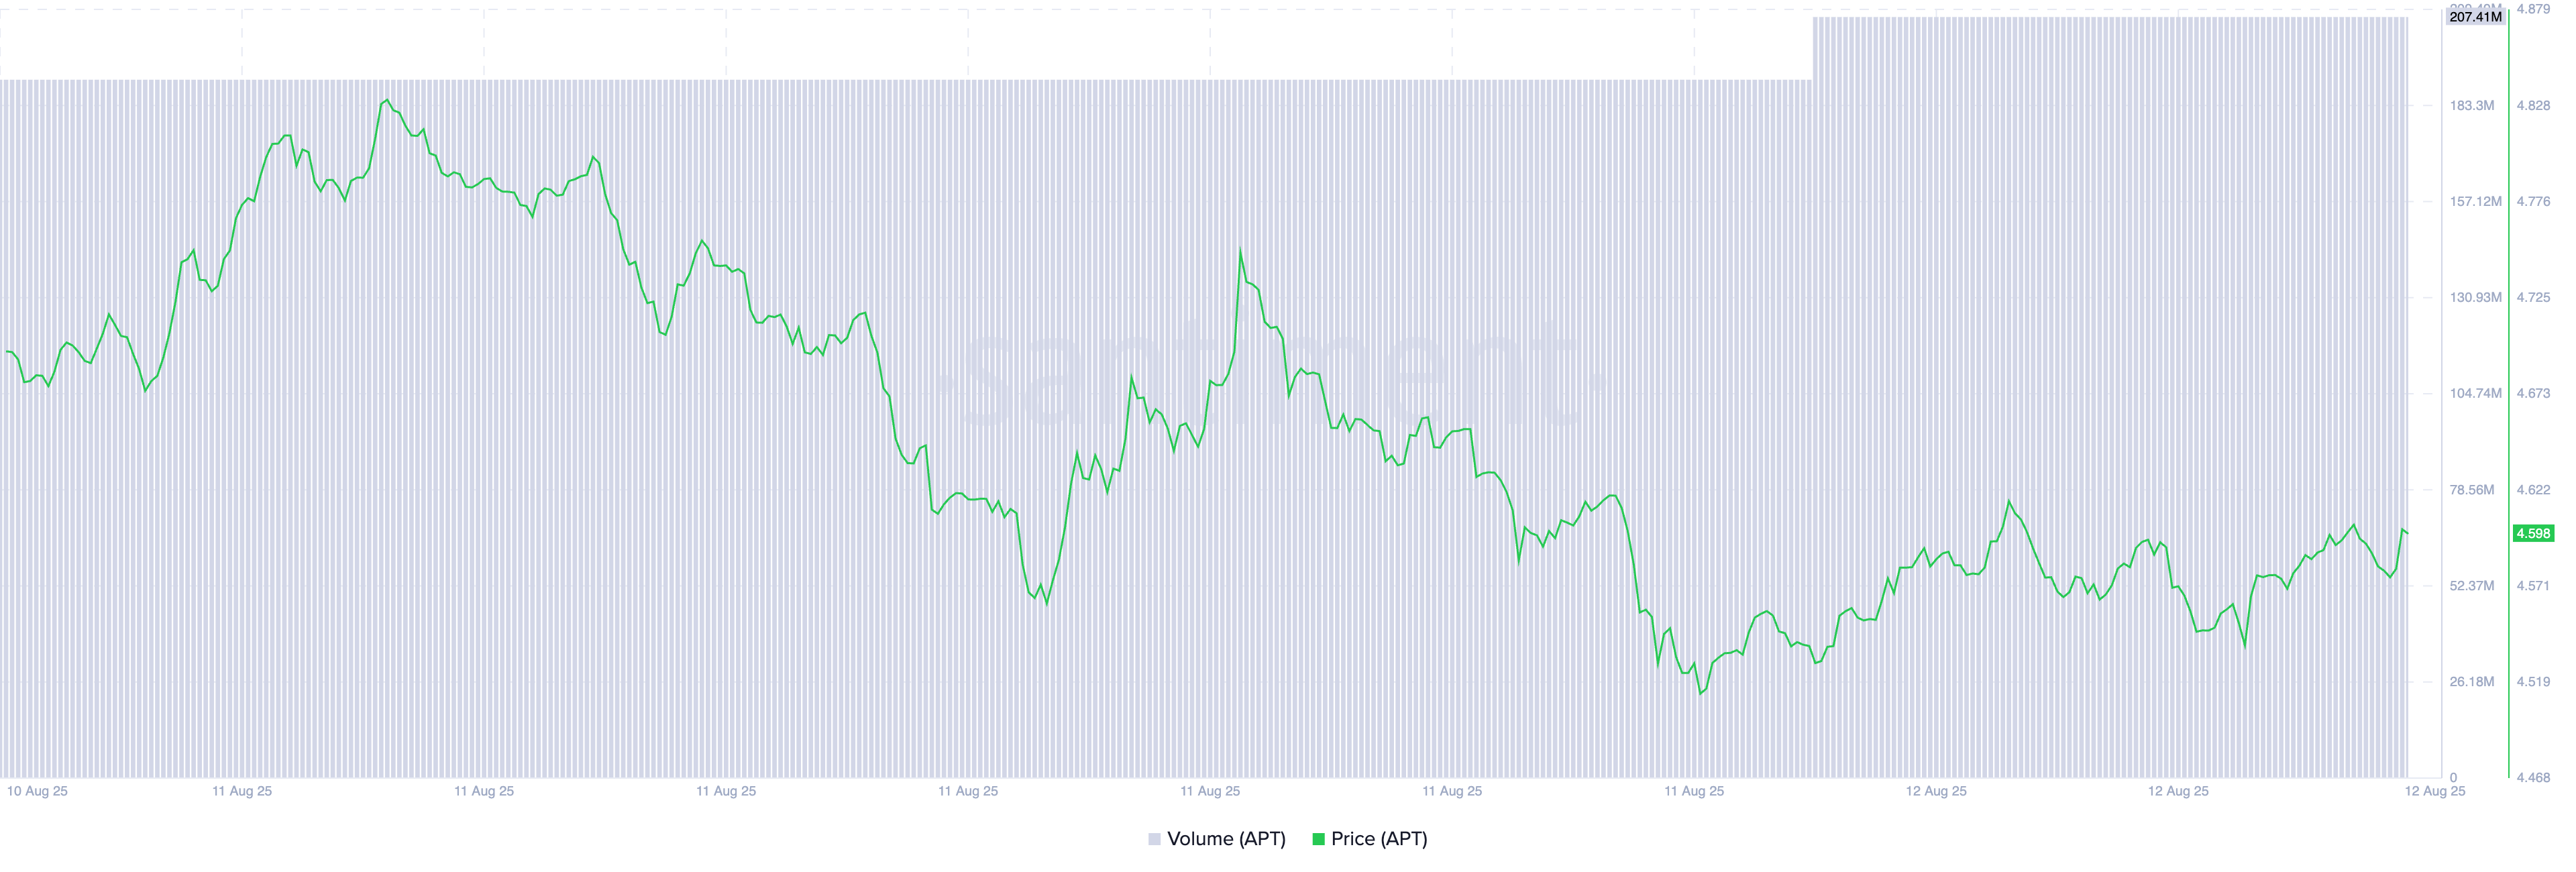
APT currently trades at $4.58, noting a 2% decline over the past 24 hours. During this same period, its trading volume has increased by 10%, indicating a rise in the number of coins changing hands.
For token TA and market updates: Want more token insights like this? Sign up for Editor Harsh Notariya’s Daily Crypto Newsletter
 APT Price/ Trading Volume. Source:
When an asset’s price falls while trading volume climbs, it signals heightened selling pressure. This pattern suggests that more investors are offloading their positions rather than buying. Hence, the trend signals that the APT market is experiencing stronger downward momentum with rising seller dominance.
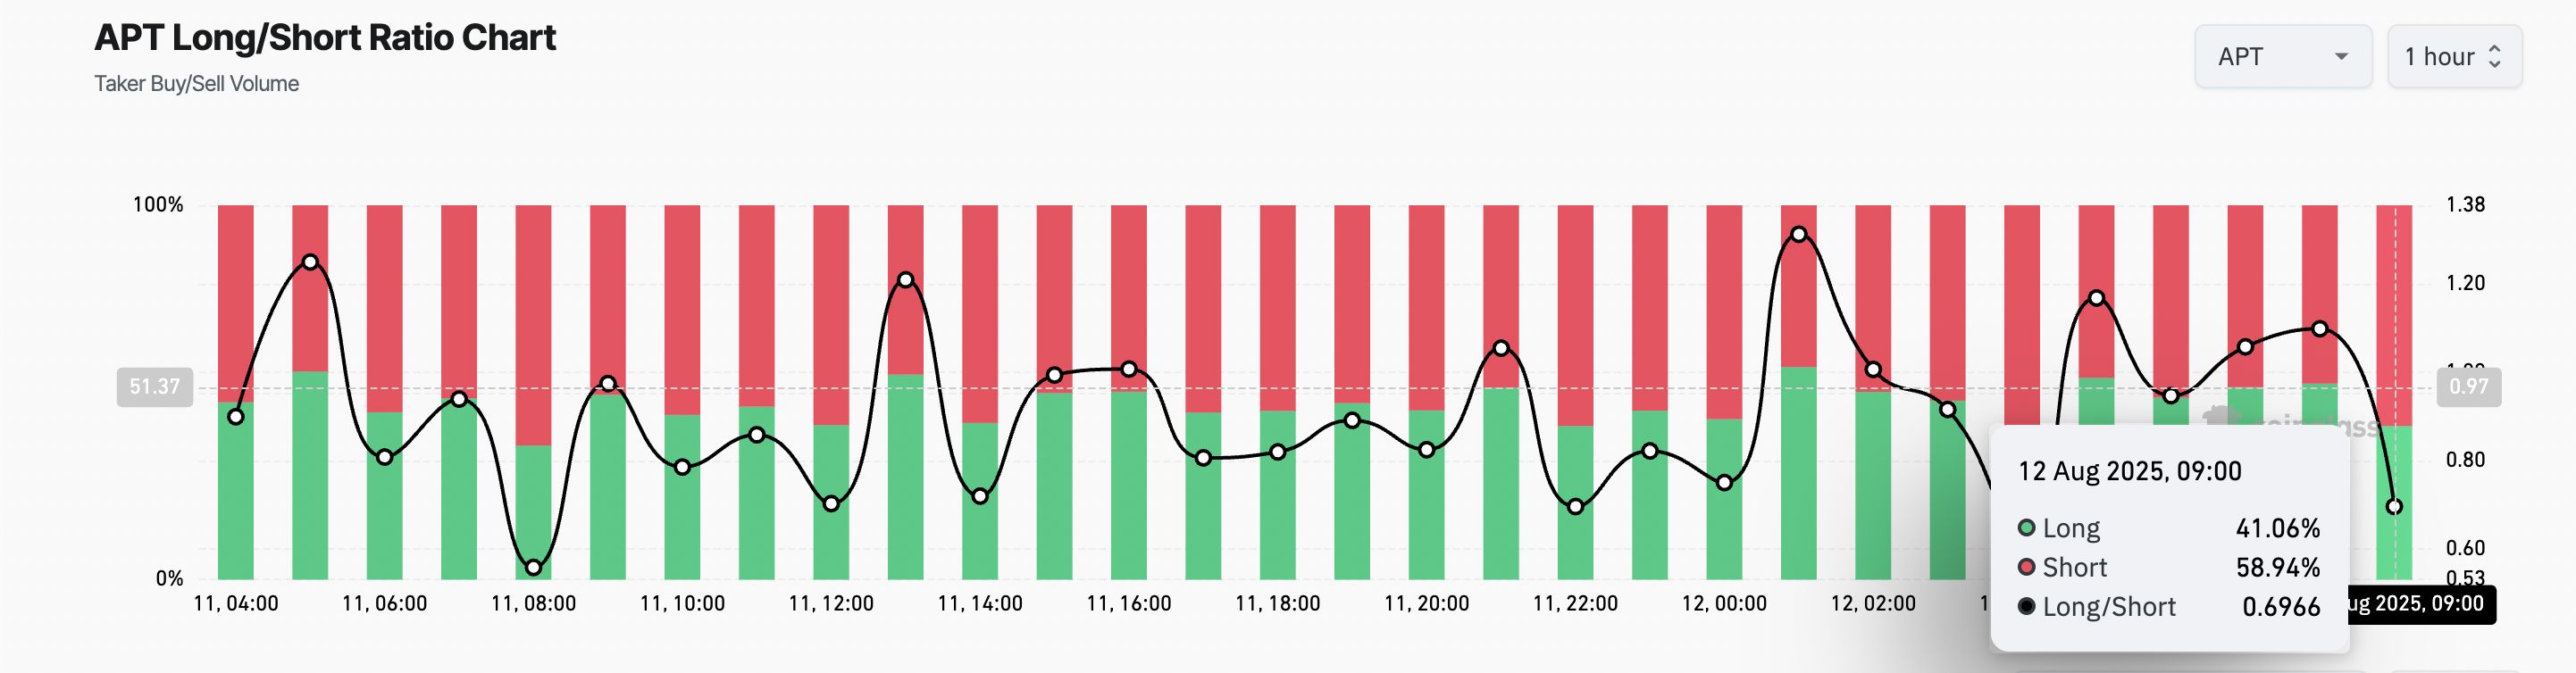
In addition, the coin’s falling long/short ratio supports this bearish outlook. Observed on an hourly chart, this sits at 0.69 at press time.
 APT Futures Open Interest. Source:
The long/short metric measures the proportion of long bets to short ones in an asset’s futures market. A ratio above one signals more long positions than short ones. This indicates a bullish sentiment, as most traders expect the asset’s value to rise.
On the other hand, a long/short ratio below 1 means that more traders are betting on the asset’s price to decline than those expecting it to rise.
APT’s long/short ratio indicates increasing demand for short positions, as traders position themselves to capitalize on the growing downward pressure.
Can Aptos Hold the Line?
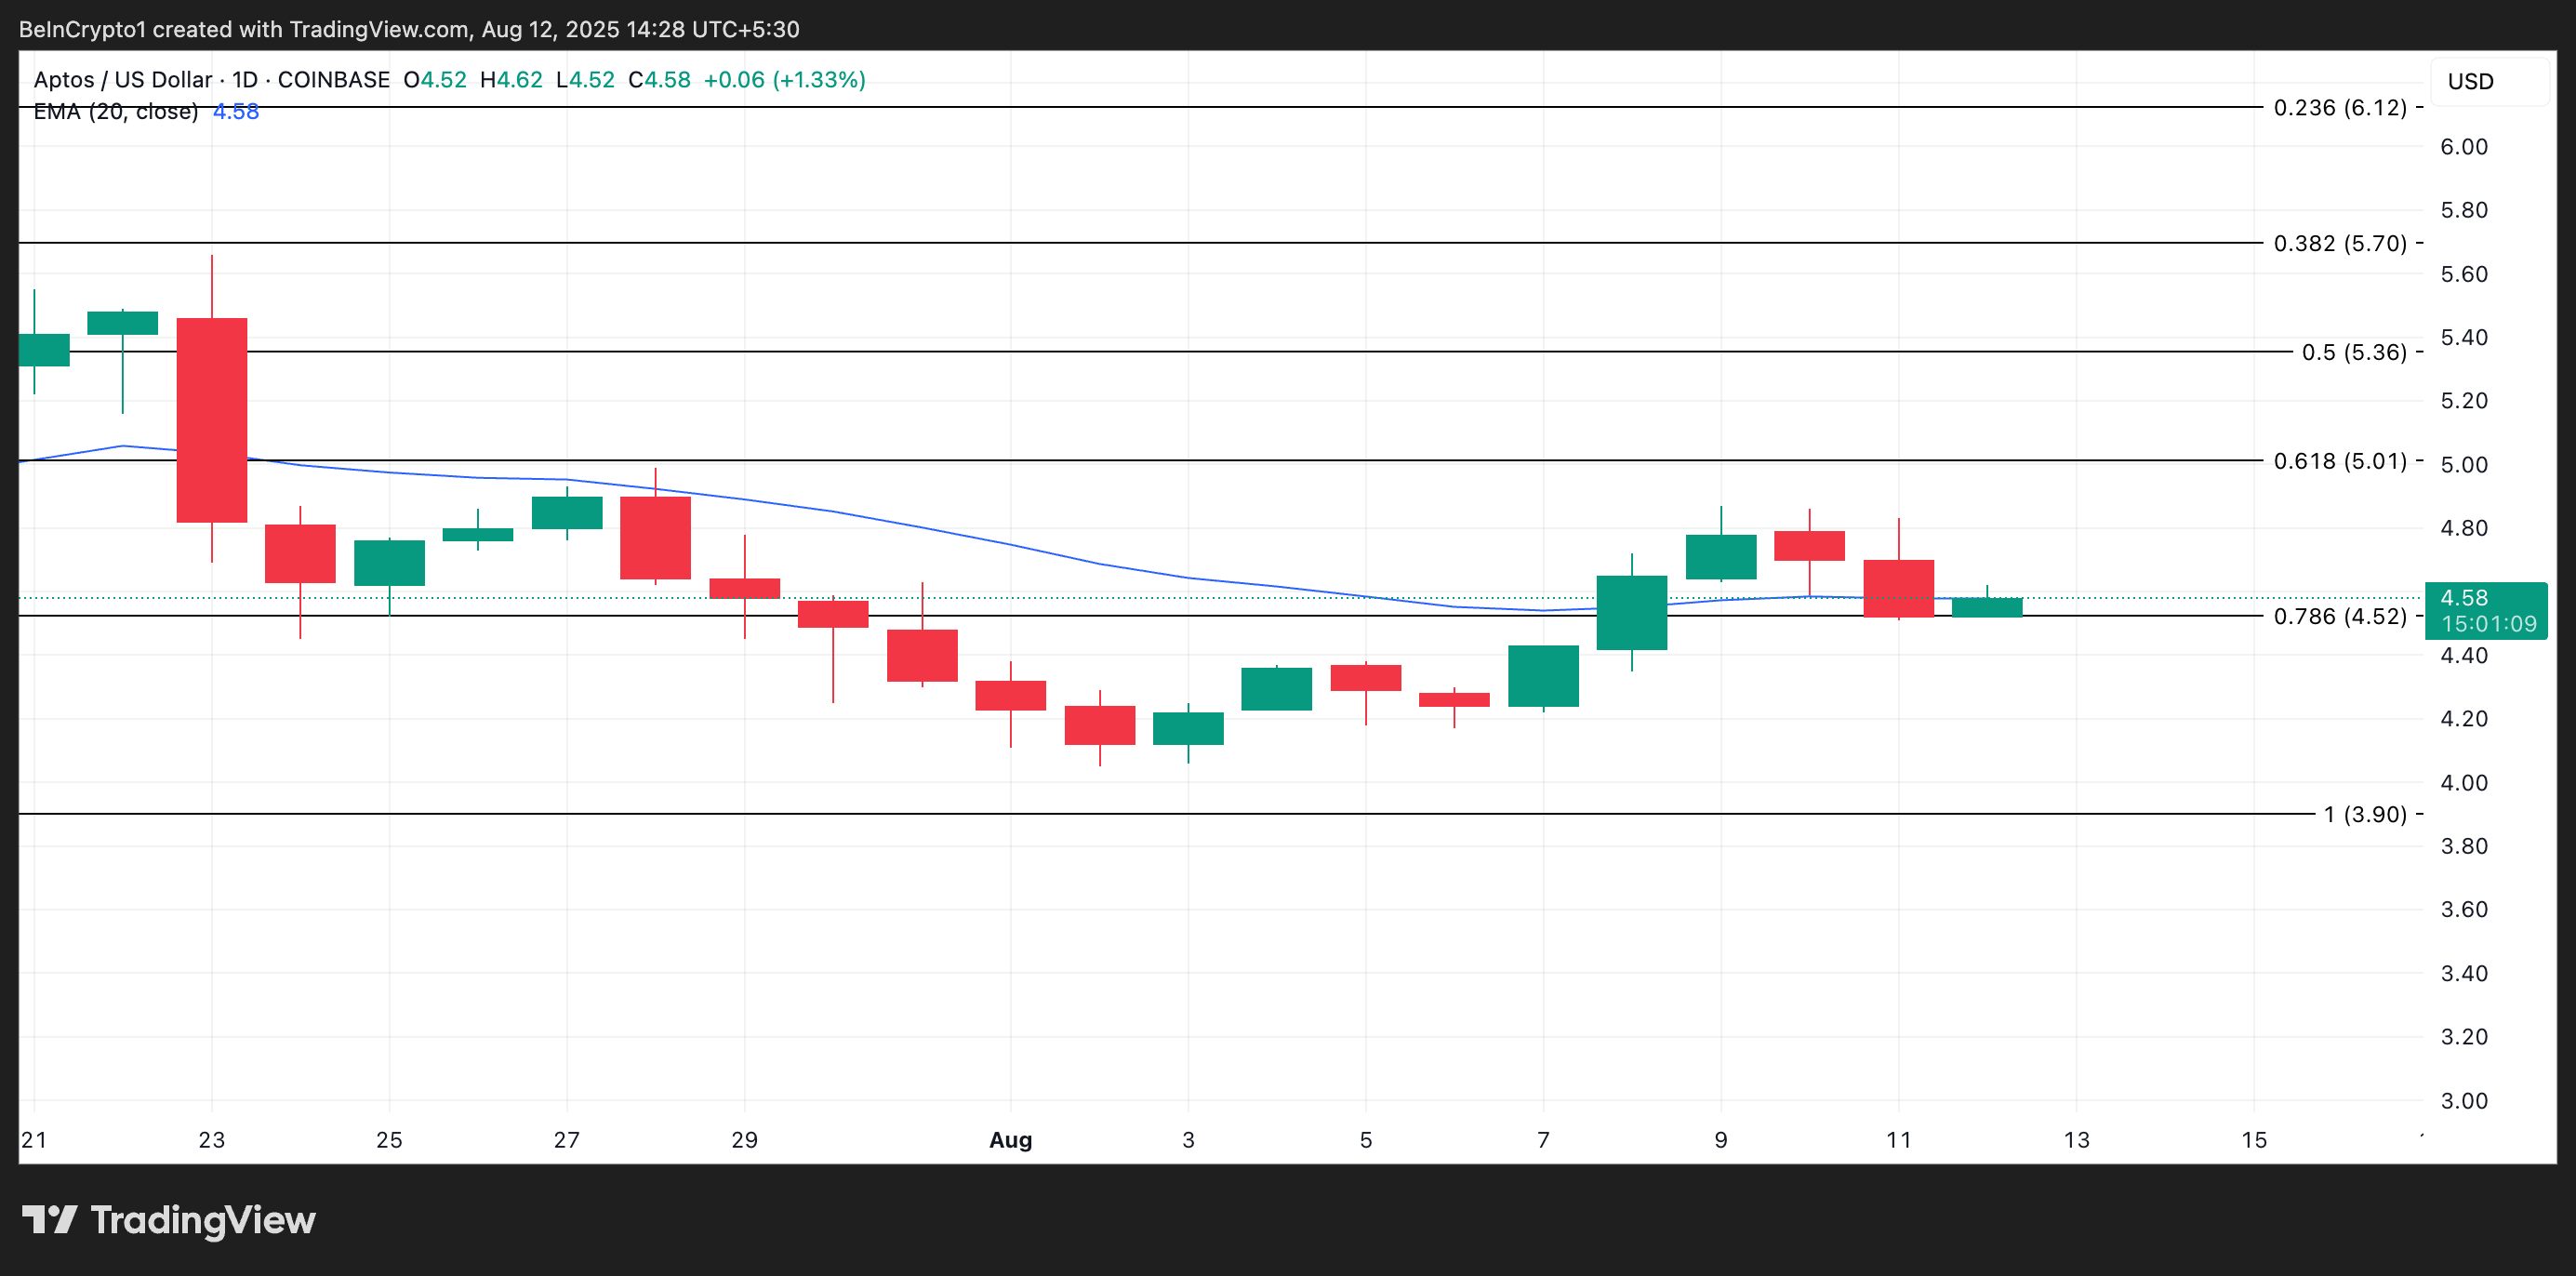
On the daily chart, APT currently trades at its 20-day Exponential Moving Average (EMA). This puts the altcoin at significant risk, where the direction it takes next could set the tone for its near-term price action.
The 20-day EMA measures an asset’s average price over the past 20 trading days, giving weight to recent prices. When an asset climbs above it, it signals strengthening momentum and a potential uptrend, indicating that buyers are gaining control.
Conversely, falling below this level suggests weakening momentum and a possible shift toward bearish sentiment, with sellers taking the lead.
If APT’s price breaks decisively below the 20-day EMA, it would confirm that the bears have regained full market control. Such a move could trigger further selling pressure, pushing APT’s price down under $4.52.
 APT Price Analysis. Source:
Conversely, if the 20-day EMA holds firm as a support floor, it could provide the foundation for a price rebound. Buyers stepping in at this level may drive APT’s price above $5.01.
Disclaimer: The content of this article solely reflects the author's opinion and does not represent the platform in any capacity. This article is not intended to serve as a reference for making investment decisions.
You may also like
Boosted by AI boom, TSMC (TSM.US) is expected to achieve record profits for the sixth consecutive quarter in Q3, with the options market pricing in nearly 4% earnings volatility ahead of the financial report
The world's largest advanced semiconductor foundry, TSMC, will announce its third-quarter financial report on Thursday.

Anthropic’s performance is “good but not good enough”: under “adjusted profitability,” revenue growth sharply brakes!
Anthropic's third-quarter revenue reached $16.8 billion, an increase of nearly 50% quarter-over-quarter, and achieved "adjusted profitability"—but the market remains unconvinced. The main concern lies in monthly growth slowing sharply from 33% to single digits, leaving a gap of several billion dollars short of the year-end $100 billion target. Token prices have hit historic lows, with the disconnect between volume and price becoming increasingly prominent. Whether this "good but not good enough" performance can support a $2 trillion IPO valuation remains uncertain.
CoreWeave Drops 15%, AI Computing Power Business Faces Financing Test
CoreWeave bonds have fallen below 80% of face value, with yields surpassing 15% and a default probability exceeding 50% within five years. The company’s CEO attempted to reassure the market by citing an order backlog of over $100 billion, but analysts pointed out that orders do not equate to cash: “If borrowing costs are 9% but project returns are only 5%, the larger the scale, the greater the value destruction.” AI infrastructure-related stocks such as Oracle have also seen significant declines, with concerns spreading across the entire high-yield bond market. Musk sighed: "Oh dear!"
XRP, Chainlink and Zcash hover at key support levels as volume dries up
Crypto prices
More


