
Shiba Inu Price Breaks Bullish Pattern as Exchange Supply Falls 1%

Shiba Inu price rallies nearly 15% over 7 days, breaking out of a bullish symmetrical triangle. Exchange reserves hit monthly lows, but Spent Coin Age Bands signal possible selling pressure ahead.
While Bitcoin has been setting new all-time highs, Shiba Inu still appears to be warming up its rally. Over the past 24 hours, the Shiba Inu price has climbed nearly 4%, joining the broader market push. The 7-day gains are even more impressive, at around 15%.
But if you’re looking for deeper upside, it might not be wise to discount SHIB yet — the token has just broken out of a bullish symmetrical triangle. Still, two on-chain metrics are sending conflicting signals, suggesting that prices could swing either way depending on which side gains the upper hand.
Exchange Supply Shrinks, Giving Bulls More Room
Whenever an asset breaks out of a bullish pattern, one of the first metrics to watch is exchange reserves — because they show how much supply could be sold instantly.
In SHIB’s case, July 31 balances were 122.54 trillion tokens, dropping to 121.31 trillion by August 11 — a nearly 1% decline. This signals reduced sell pressure, creating favorable conditions for bulls to extend the Shiba Inu price rally.
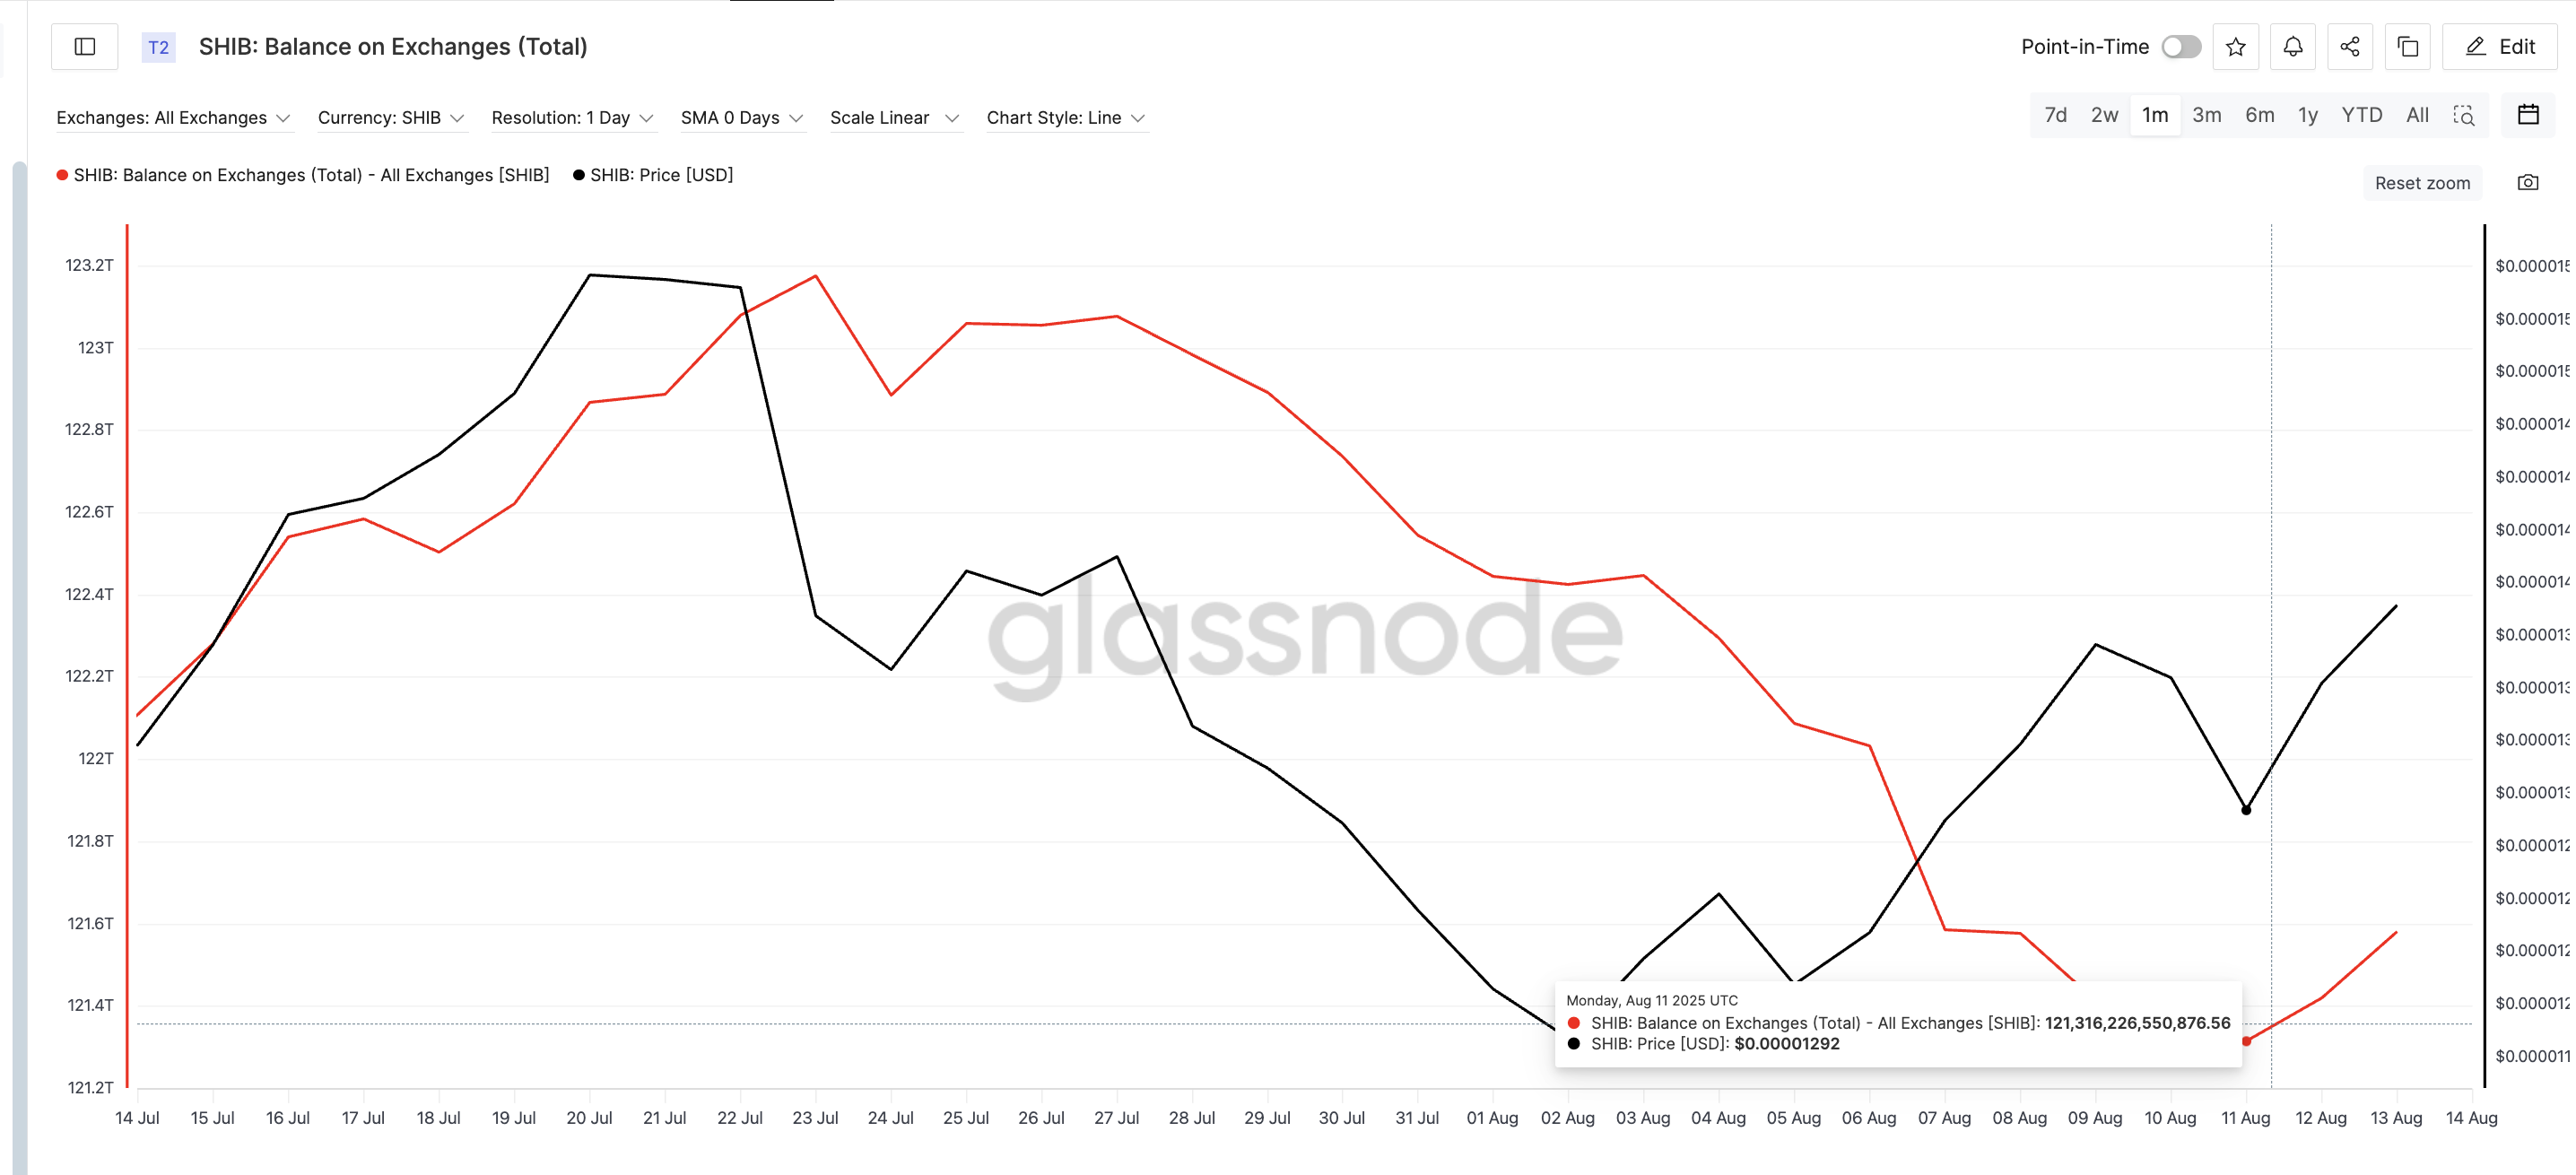 Shiba Inu price and a drop in exchange supply:
What’s worth mentioning is that post the August 11 exchange supply dip to the monthly lows, the Shiba Inu (SHIB) price started surging. Similar supply-led price moves were seen earlier this month: July 24 and August 6.
However, as the price rose, the exchange supply increased slightly from the August lows. Hence, traders should closely monitor SHIB’s balance on exchanges.
For token TA and market updates: Want more token insights like this? Sign up for Editor Harsh Notariya’s Daily Crypto Newsletter
Spent Coin Age Bands Flash Warning: The One Risk To Rally?
While shrinking exchange reserves are bullish, the rise in Spent Coin Age Bands could counter that momentum. This metric shows when older, previously dormant coins are being moved — often a sign of long-term holders taking profits.
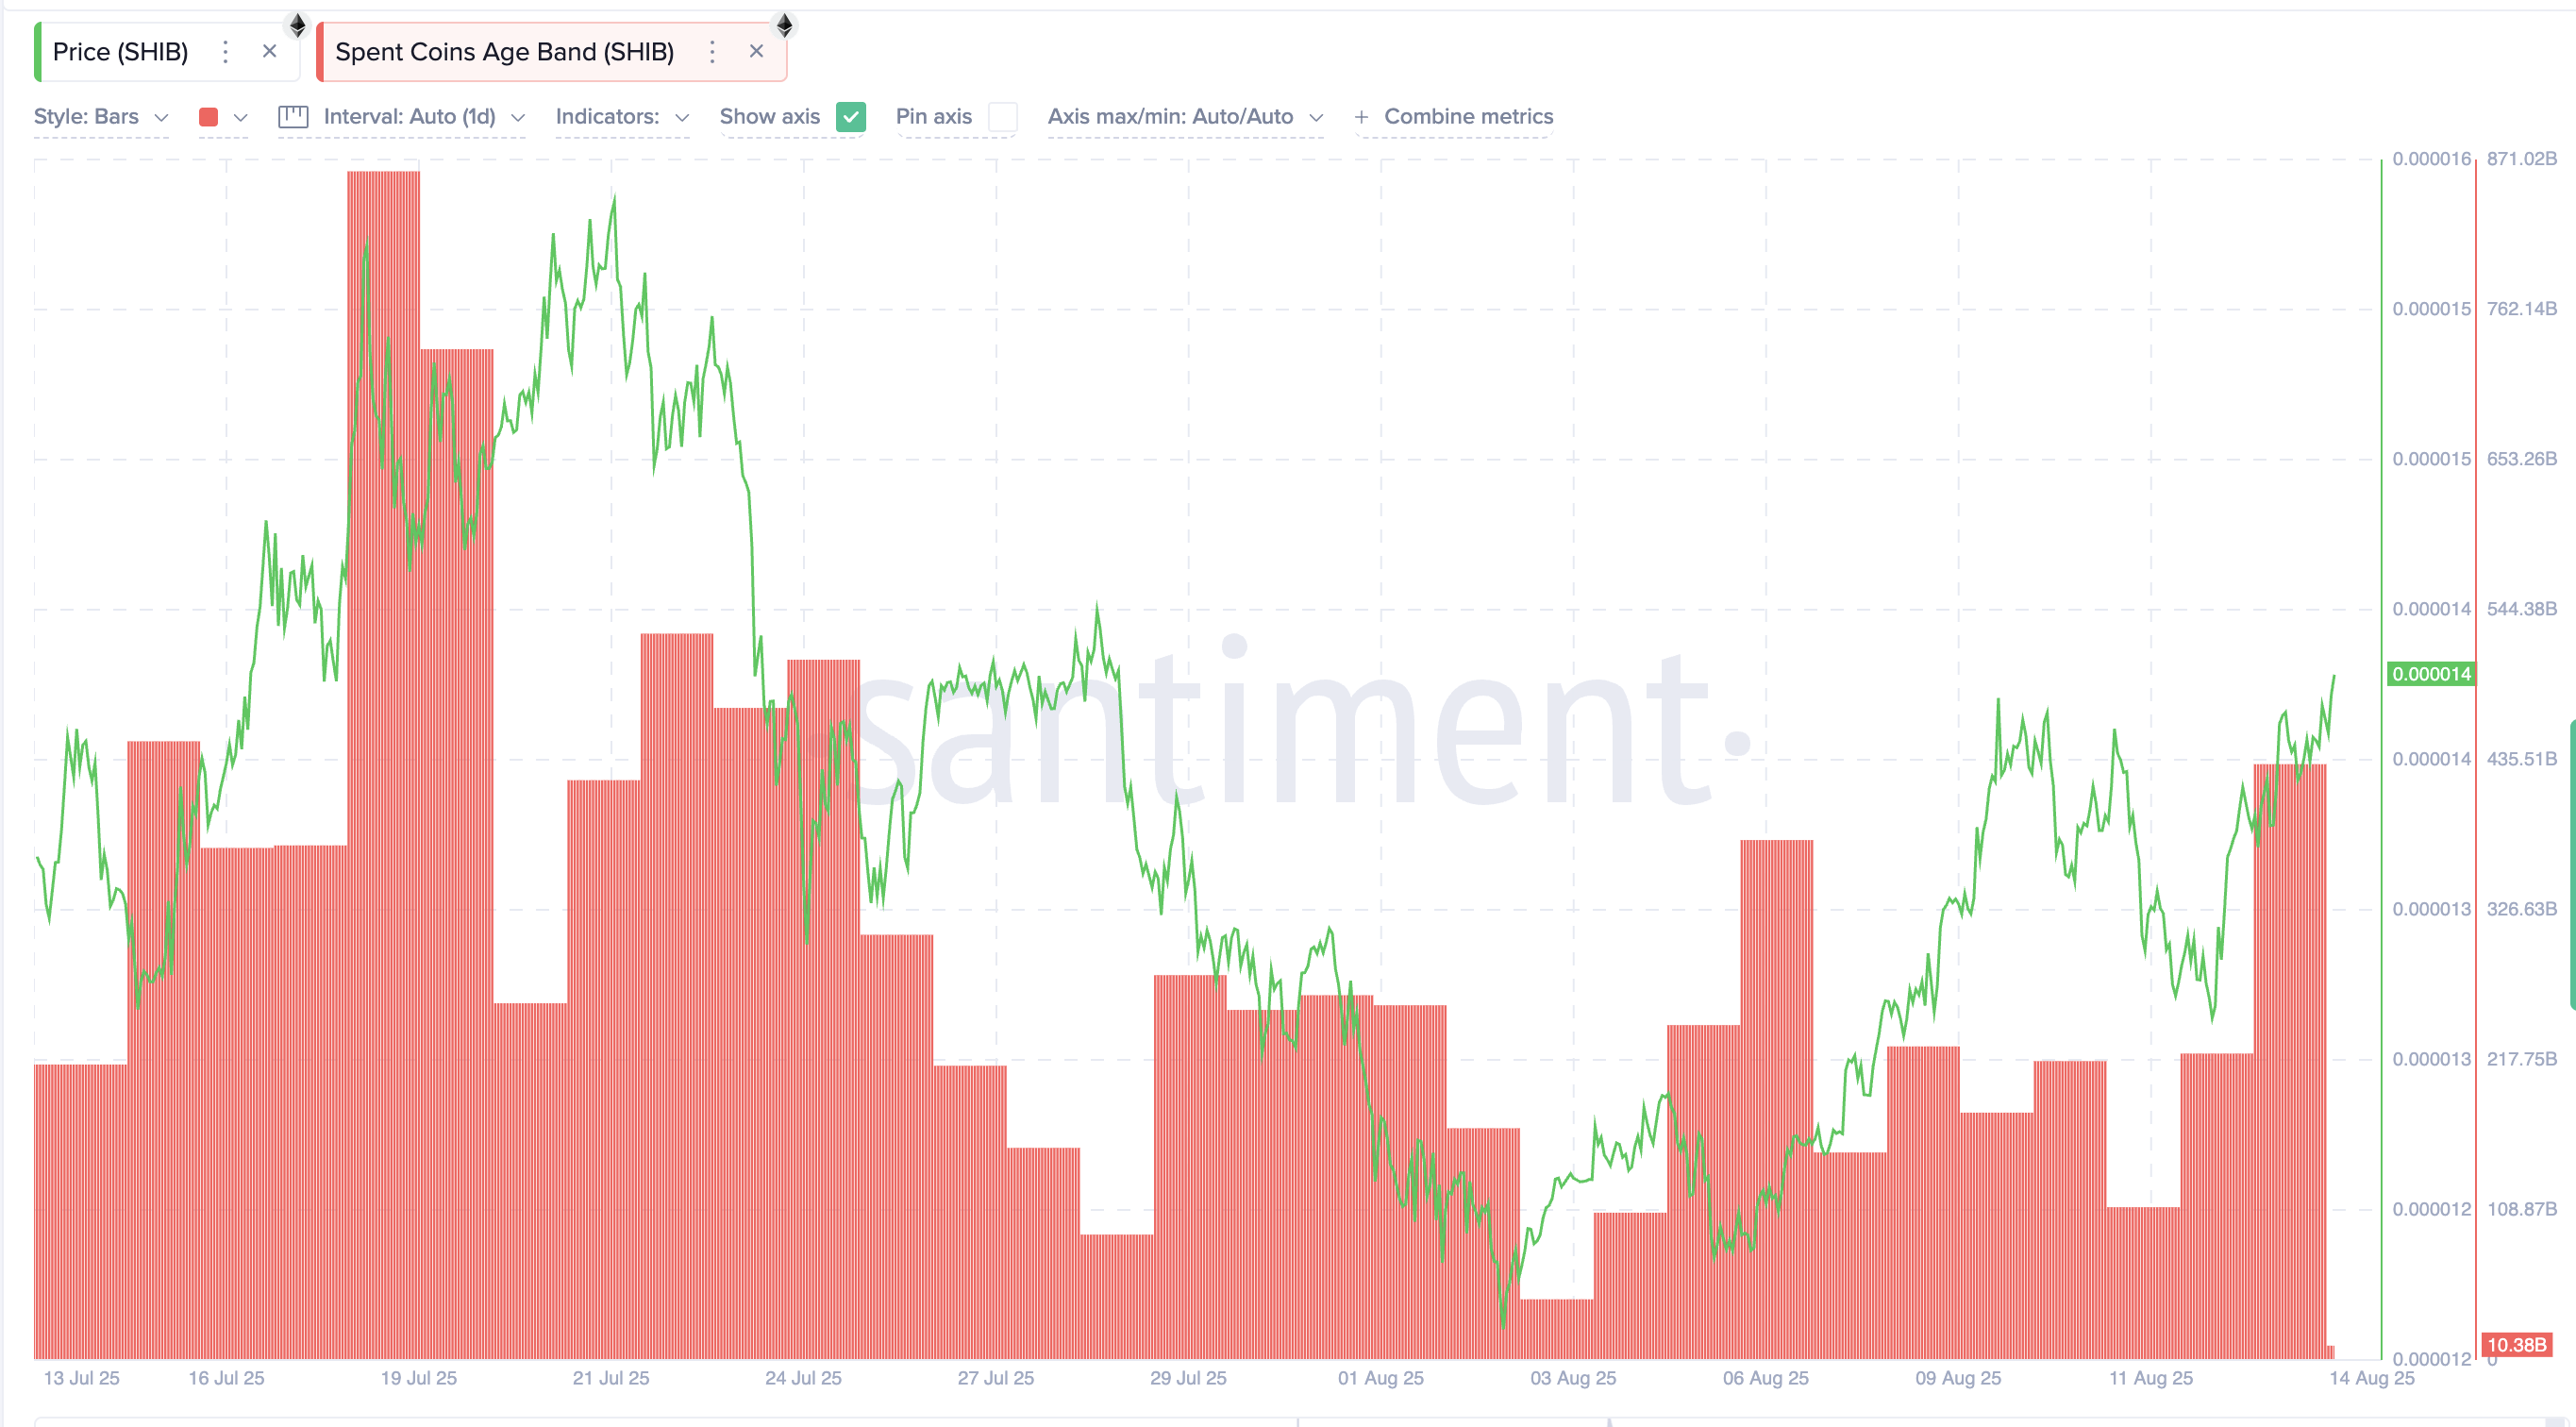 Increasing Spent Coin Age Band:
In early August, it hit multi-week lows, but has now climbed to levels last seen on July 24, right before a correction. This uptick could reintroduce supply into the market, offsetting the benefits of low exchange balances.
The chart shows that whenever the Spent Coins Age Band metrics made a local high, a SHIB price correction followed. That’s the current risk to the rally that traders should be mindful of.
Shiba Inu Price Action Balances Bullish Setup and Risk
Price levels now become the battleground where these opposing forces meet. With SHIB trading above $0.00001368, the breakout is intact. The most heartening thing about the SHIB price action is that it is breaking out of the symmetrical triangle. A push past $0.00001438 would lend more strength to the breakout.
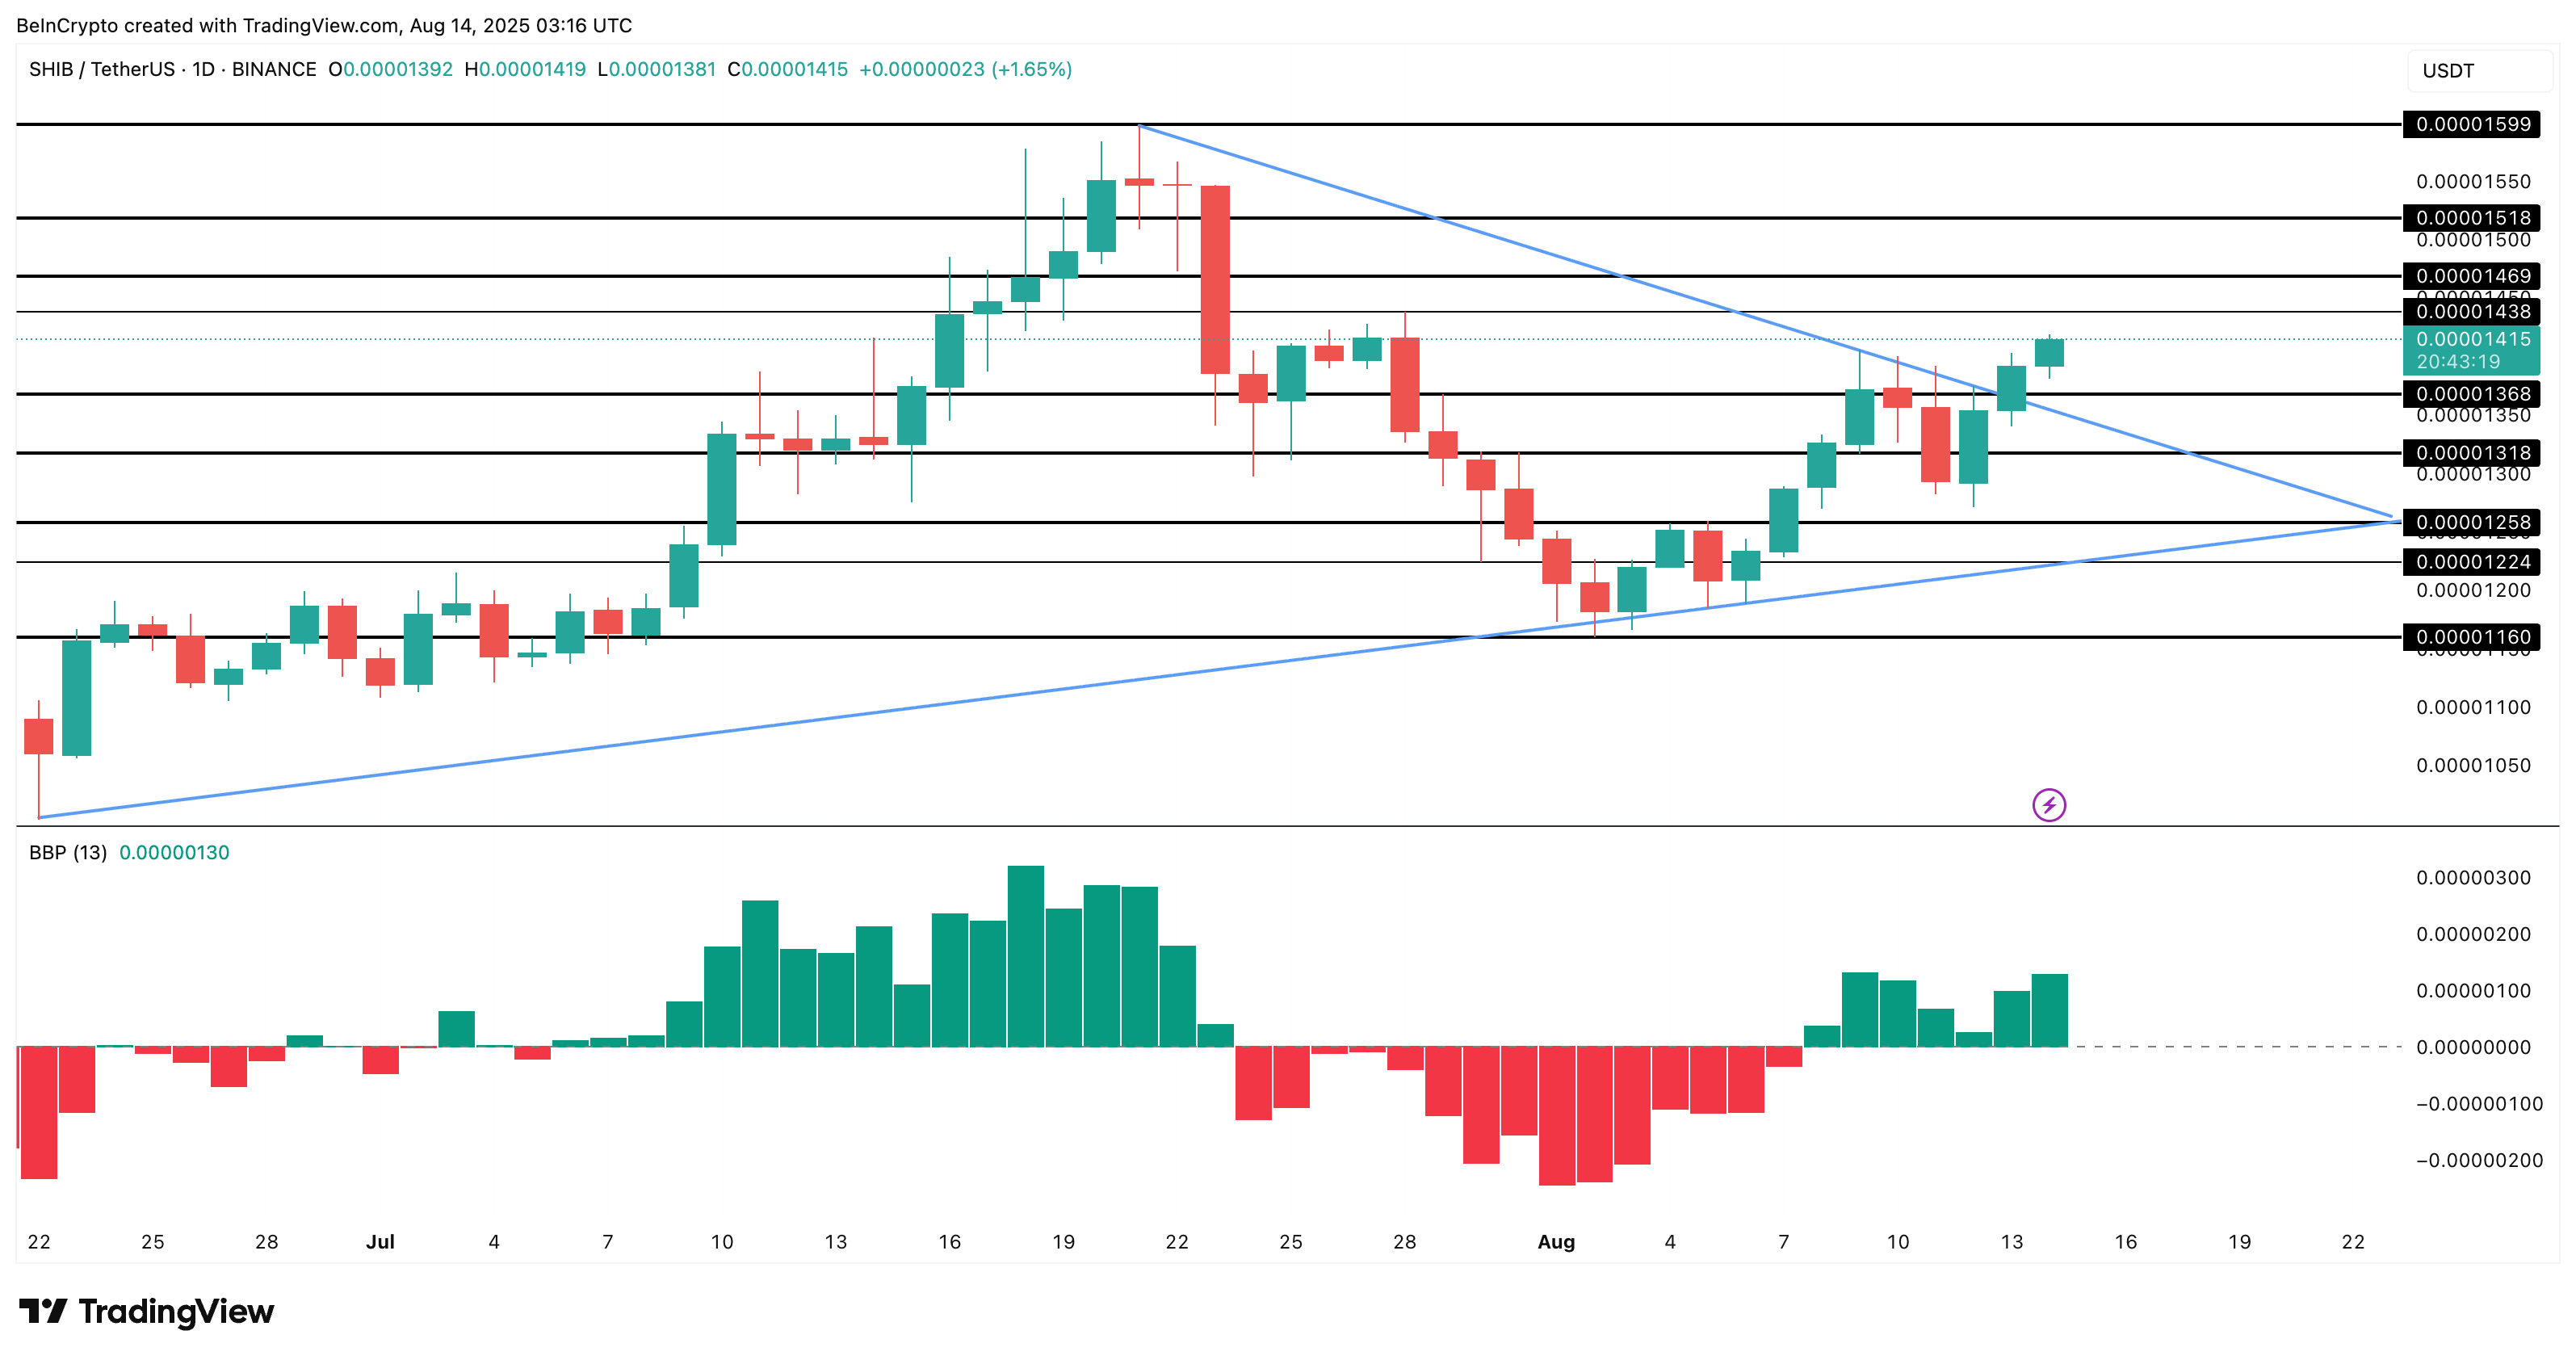 Shiba Inu price analysis:
Next resistance levels lie at $0.00001469 and $0.00001518, with a potential run to $0.00001599 if momentum holds. And even though the Spent Coins and Exchange Supply metrics are at loggerheads, the increase in the bullish power, courtesy of the Bull-Bear Indicator, might validate the possibility of an upmove.
The invalidation zone is between $0.00001318 and $0.00001224. A drop below this level could allow bears to regain control.
Disclaimer: The content of this article solely reflects the author's opinion and does not represent the platform in any capacity. This article is not intended to serve as a reference for making investment decisions.
You may also like
US CPI Heats Up Across the Board, Triggering "Inflation Spiral" Alert; October Rate Hike Odds Once Hit 50%. "New Fed News Agency": Watch Waller's Speech This Week
After the CPI was released, the market-implied rate hike probability first rose to 50% before falling back to 40%. Wall Street generally believes that whether action will be taken in October still depends on how the Federal Reserve assesses inflation trends. "The New Fed News Agency" noted that, unlike in August when price increases were concentrated in certain items, the stronger-than-expected performance of September's core CPI was more broad-based, further reinforcing the case for a December rate hike. The speech by Waller on Friday morning Beijing time is his last public statement before the Fed's blackout period ahead of this month's meeting. Economists are warning about an "inflation spiral," with real purchasing power and midterm election pressures interweaving.
The calm period in the US stock market is over! The S&P 500 ends its record of 53 consecutive trading days without a drop of over 1%. AI stock sell-off intensifies market concerns.
The S&P 500 Index fell by 1.1%, ending a streak of 53 consecutive trading days without a drop of 1% or more. This was the longest period of calm since January 2020.
Federal Reserve Beige Book: U.S. economy expands moderately but inflationary pressures intensify; AI boosts productivity curbing some corporate hiring demand
The latest Beige Book released by the Federal Reserve on Wednesday shows that overall economic activity in the United States continues to grow, but performance varies across regions. Consumer spending remains generally weak, and there has been little change in the labor market.
Overnight US Stocks | September Inflation Remains High, Major Indexes Decline, Coreweave (CRWV.US) Drops Over 15%
At the close, the Dow Jones Industrial Average fell by 47.96 points, or 0.09%, to 51,622.14 points; the S&P 500 Index dropped by 85.95 points, or 1.10%, to 7,719.50 points; and the Nasdaq Composite Index declined by 511.51 points, or 1.88%, to 26,692.87 points.
Crypto prices
More


