Bitget App
Trade smarter
Buy cryptoMarketsTradeFuturesStocksEarnInstitutionAI & More
Starknet (STRK) To Rise Higher? Key Harmonic Pattern Signals Potential Upside Move

Starknet (STRK) To Rise Higher? Key Harmonic Pattern Signals Potential Upside Move

CoinsProbeCoinsProbe2025/08/14 15:55
By:Nilesh Hembade

Date: Thu, Aug 14, 2025 | 08:50 AM GMT

The cryptocurrency market is in full bullish swing as Bitcoin (BTC) hits a new all-time high of $124,000 today, while Ethereum (ETH) has broken above the $4,700 mark for the first time since 2021, surging over 27% this week. This wave of bullishness has boosted sentiment across the major altcoins , including Starknet (STRK).

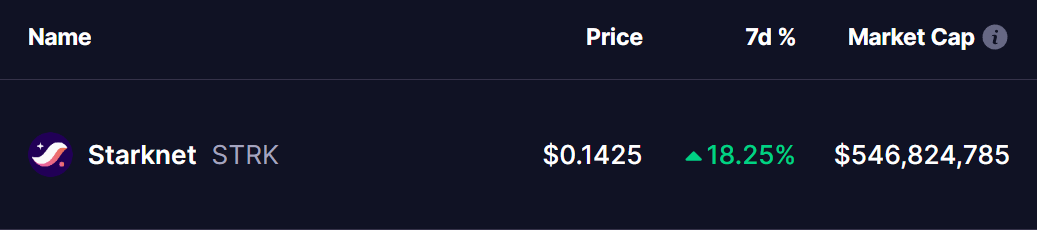
This Layer 2 token has recorded an impressive 18% gain over the past week. More importantly, its latest price structure reveals a key harmonic pattern pointing toward further upside potential in the near term.
Starknet (STRK) To Rise Higher? Key Harmonic Pattern Signals Potential Upside Move image 0 Source: Coinmarketcap

Harmonic Pattern Hints at Bullish Continuation

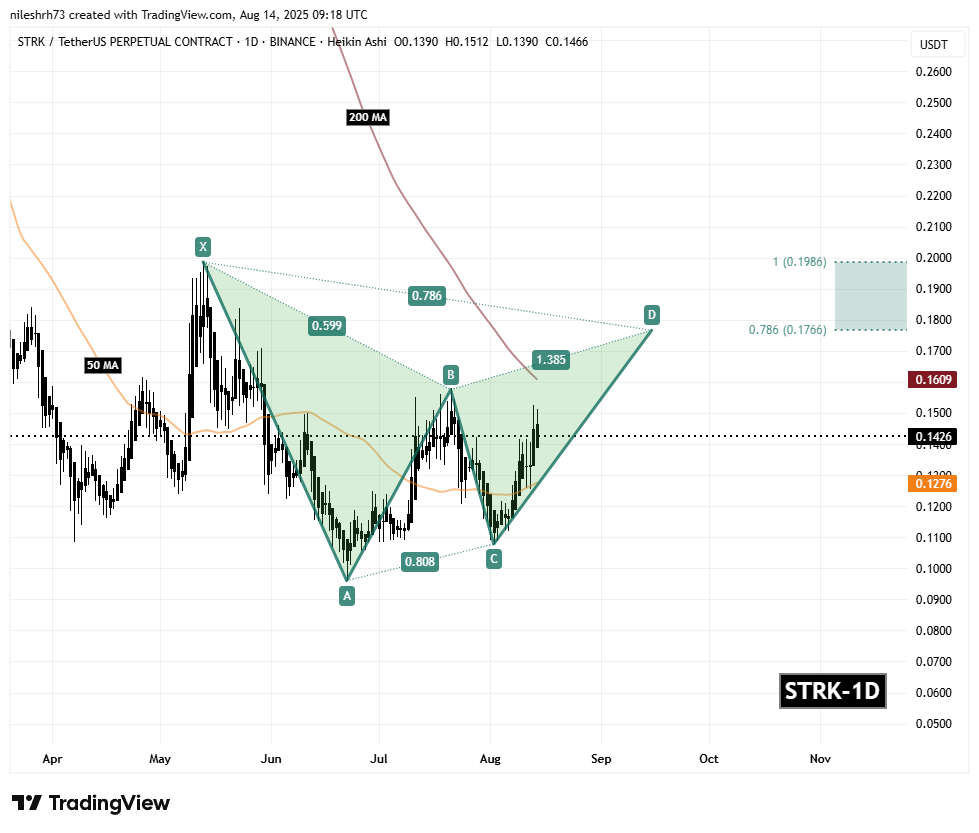
On the daily chart, STRK is forming a Bearish Gartley harmonic pattern. Despite the “bearish” label, this formation often precedes strong rallies during the CD leg — typically the most impulsive stage of the move.

The pattern began at point X near $0.1986, fell to point A, retraced to point B, and then declined again to point C around $0.1078. Since then, STRK has rebounded sharply, now trading near $0.1431, reclaiming key price levels and building bullish momentum.
Starknet (STRK) To Rise Higher? Key Harmonic Pattern Signals Potential Upside Move image 1 Starknet (STRK) Daily Chart/Coinsprobe (Source: Tradingview)

The immediate challenge for bulls lies at the 200-day moving average ($0.1609) — a major technical barrier that has consistently capped upside attempts in recent months.

What’s Next for STRK?

If buyers can break through the 200-day MA with strong volume, STRK could target its Potential Reversal Zone (PRZ) between $0.1766 and $0.1986. These levels correspond to the 0.786 and 1.0 Fibonacci extensions, where Gartley patterns typically complete before a possible pullback. From the current price, this implies up to 39% potential upside.

0
0

Disclaimer: The content of this article solely reflects the author's opinion and does not represent the platform in any capacity. This article is not intended to serve as a reference for making investment decisions.

Understand the market, then trade.
Bitget offers one-stop trading for cryptocurrencies, stocks, and gold.
Trade now!

You may also like

US CPI Heats Up Across the Board, Triggering "Inflation Spiral" Alert; October Rate Hike Odds Once Hit 50%. "New Fed News Agency": Watch Waller's Speech This Week

After the CPI was released, the market-implied rate hike probability first rose to 50% before falling back to 40%. Wall Street generally believes that whether action will be taken in October still depends on how the Federal Reserve assesses inflation trends. "The New Fed News Agency" noted that, unlike in August when price increases were concentrated in certain items, the stronger-than-expected performance of September's core CPI was more broad-based, further reinforcing the case for a December rate hike. The speech by Waller on Friday morning Beijing time is his last public statement before the Fed's blackout period ahead of this month's meeting. Economists are warning about an "inflation spiral," with real purchasing power and midterm election pressures interweaving.

华尔街见闻•2026/10/14 23:02

The calm period in the US stock market is over! The S&P 500 ends its record of 53 consecutive trading days without a drop of over 1%. AI stock sell-off intensifies market concerns.

The S&P 500 Index fell by 1.1%, ending a streak of 53 consecutive trading days without a drop of 1% or more. This was the longest period of calm since January 2020.

智通财经•2026/10/14 22:37

Federal Reserve Beige Book: U.S. economy expands moderately but inflationary pressures intensify; AI boosts productivity curbing some corporate hiring demand

The latest Beige Book released by the Federal Reserve on Wednesday shows that overall economic activity in the United States continues to grow, but performance varies across regions. Consumer spending remains generally weak, and there has been little change in the labor market.

智通财经•2026/10/14 22:36

Overnight US Stocks | September Inflation Remains High, Major Indexes Decline, Coreweave (CRWV.US) Drops Over 15%

At the close, the Dow Jones Industrial Average fell by 47.96 points, or 0.09%, to 51,622.14 points; the S&P 500 Index dropped by 85.95 points, or 1.10%, to 7,719.50 points; and the Nasdaq Composite Index declined by 511.51 points, or 1.88%, to 26,692.87 points.

智通财经•2026/10/14 22:36