Bitget App
Trade smarter
Buy cryptoMarketsTradeFuturesStocksEarnInstitutionAI & More
FUNToken Rebounds from Support as Volume Skyrockets 626% to $102M

FUNToken Rebounds from Support as Volume Skyrockets 626% to $102M

CryptonewslandCryptonewsland2025/08/14 16:15
By:by Francis E
  • FUNToken surged 626.95% in 24-hour trading volume, reaching $102 million and a 103.29% volume-to-market-cap ratio.
  • Price rebounded from a major daily support zone, confirming a breakout from a descending trendline.
  • The token holds a $99.28 million market cap with 10.8 billion FUN in circulation and 103.28K holders.

FUNToken (FUN) has rebounded sharply from a major daily support level, showing a marked increase in trading activity. The token’s price is currently near $0.009259, reflecting a 1.93% decline over the last 24 hours. Market data shows its 24-hour trading volume has soared by 626.95%, reaching $102 million. 
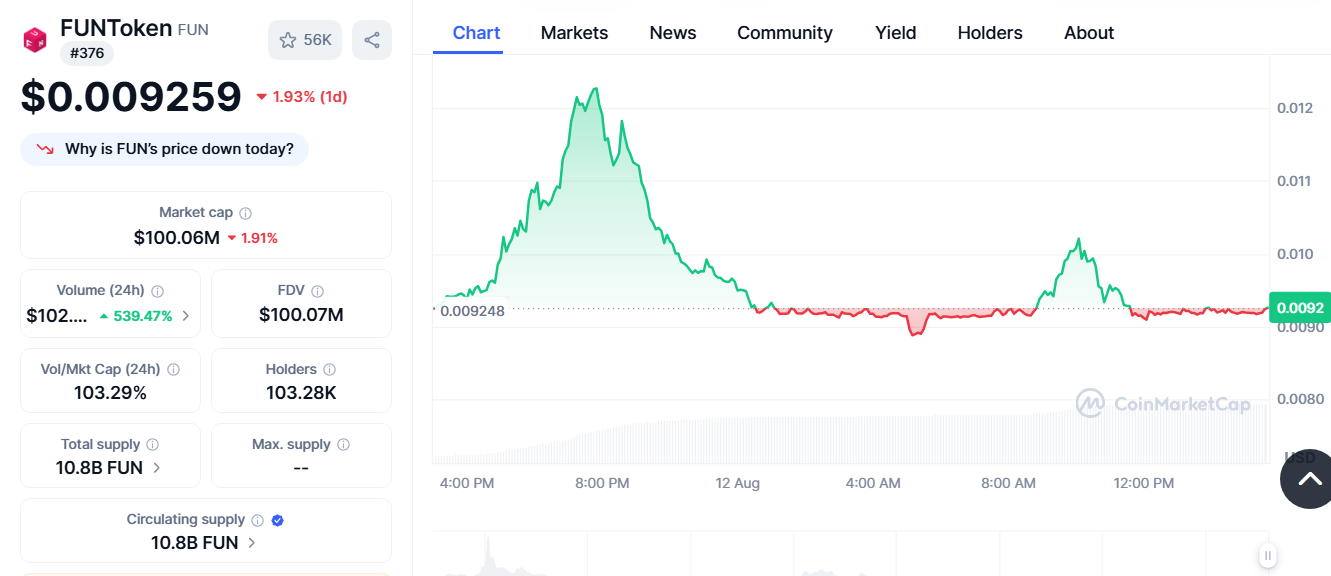
FUNToken Rebounds from Support as Volume Skyrockets 626% to $102M image 0 FUNToken Rebounds from Support as Volume Skyrockets 626% to $102M image 1 Source: CoinMarketCap

This surge has pushed the volume-to-market-cap ratio to 103.29%, indicating strong market participation. The total market capitalization remains at approximately $99.28 million, with 10.8 billion FUN in circulating supply.

Breakout Structure Forms on the 4-Hour Chart

Chart analysis reveals a notable cup-and-handle formation that has developed over recent weeks. FUNToken’s price action broke through a descending trendline, confirming a short-term breakout structure. The chart illustrates a continued decrease since July peaks of up to $0.02500 to lows in early August of around $0.00900. But this weakness was corrected when the price rebounded off support, leading to new buying activity.

From support to liftoff $FUN is making its move

Bouncing hard off a major daily support zone with volume surging and momentum building fast. #FUNUSDT is looking primed for the next big wave stay sharp pic.twitter.com/AHVw3WQxuI

Remarkably, the build became evident since breakout came along with a lift in the volume, indicating a higher level of trading activity around the breakout region. The next significant resistance level appears near the $0.01500 range based on historical price action.

Daily Support Zone Holds Firm

The token’s rebound began after multiple tests of a strong daily support area, which has held since early August. Price consolidation around this level provided a base for the current move upward. The bounce from support aligned with a notable increase in buy-side pressure. This development coincided with a surge in market activity, as reflected in the sharp volume increase.

With this higher participation, short-term traders appear to be targeting previous resistance points. While the market remains volatile, this volume-driven lift-off marks one of FUNToken’s most active sessions in recent weeks.

Market Activity Strengthens Momentum

The combined market cap of $99.28 million and a fully diluted valuation matching that figure reflects the token’s fixed supply metrics. The number of holders stands at 103.28K, which shows the token’s broad distribution. Increased volume has now placed FUNToken among the day’s more actively traded mid-cap assets.

With momentum building and trading volume remaining high, the market structure shows a clear shift in activity levels. These developments position the token for continued market attention as traders monitor key levels ahead.

0
0

Disclaimer: The content of this article solely reflects the author's opinion and does not represent the platform in any capacity. This article is not intended to serve as a reference for making investment decisions.

Understand the market, then trade.
Bitget offers one-stop trading for cryptocurrencies, stocks, and gold.
Trade now!

You may also like

US CPI Heats Up Across the Board, Triggering "Inflation Spiral" Alert; October Rate Hike Odds Once Hit 50%. "New Fed News Agency": Watch Waller's Speech This Week

After the CPI was released, the market-implied rate hike probability first rose to 50% before falling back to 40%. Wall Street generally believes that whether action will be taken in October still depends on how the Federal Reserve assesses inflation trends. "The New Fed News Agency" noted that, unlike in August when price increases were concentrated in certain items, the stronger-than-expected performance of September's core CPI was more broad-based, further reinforcing the case for a December rate hike. The speech by Waller on Friday morning Beijing time is his last public statement before the Fed's blackout period ahead of this month's meeting. Economists are warning about an "inflation spiral," with real purchasing power and midterm election pressures interweaving.

华尔街见闻•2026/10/14 23:02

The calm period in the US stock market is over! The S&P 500 ends its record of 53 consecutive trading days without a drop of over 1%. AI stock sell-off intensifies market concerns.

The S&P 500 Index fell by 1.1%, ending a streak of 53 consecutive trading days without a drop of 1% or more. This was the longest period of calm since January 2020.

智通财经•2026/10/14 22:37

Federal Reserve Beige Book: U.S. economy expands moderately but inflationary pressures intensify; AI boosts productivity curbing some corporate hiring demand

The latest Beige Book released by the Federal Reserve on Wednesday shows that overall economic activity in the United States continues to grow, but performance varies across regions. Consumer spending remains generally weak, and there has been little change in the labor market.

智通财经•2026/10/14 22:36

Overnight US Stocks | September Inflation Remains High, Major Indexes Decline, Coreweave (CRWV.US) Drops Over 15%

At the close, the Dow Jones Industrial Average fell by 47.96 points, or 0.09%, to 51,622.14 points; the S&P 500 Index dropped by 85.95 points, or 1.10%, to 7,719.50 points; and the Nasdaq Composite Index declined by 511.51 points, or 1.88%, to 26,692.87 points.

智通财经•2026/10/14 22:36