
Arbitrum TVL Hits YTD High as Rising Ethereum Activity Fuels Layer-2 Demand

Arbitrum’s TVL hits $3.39 billion, fueled by Ethereum’s surge. ARB price rises 12%, backed by strong trading volume and bullish MACD.
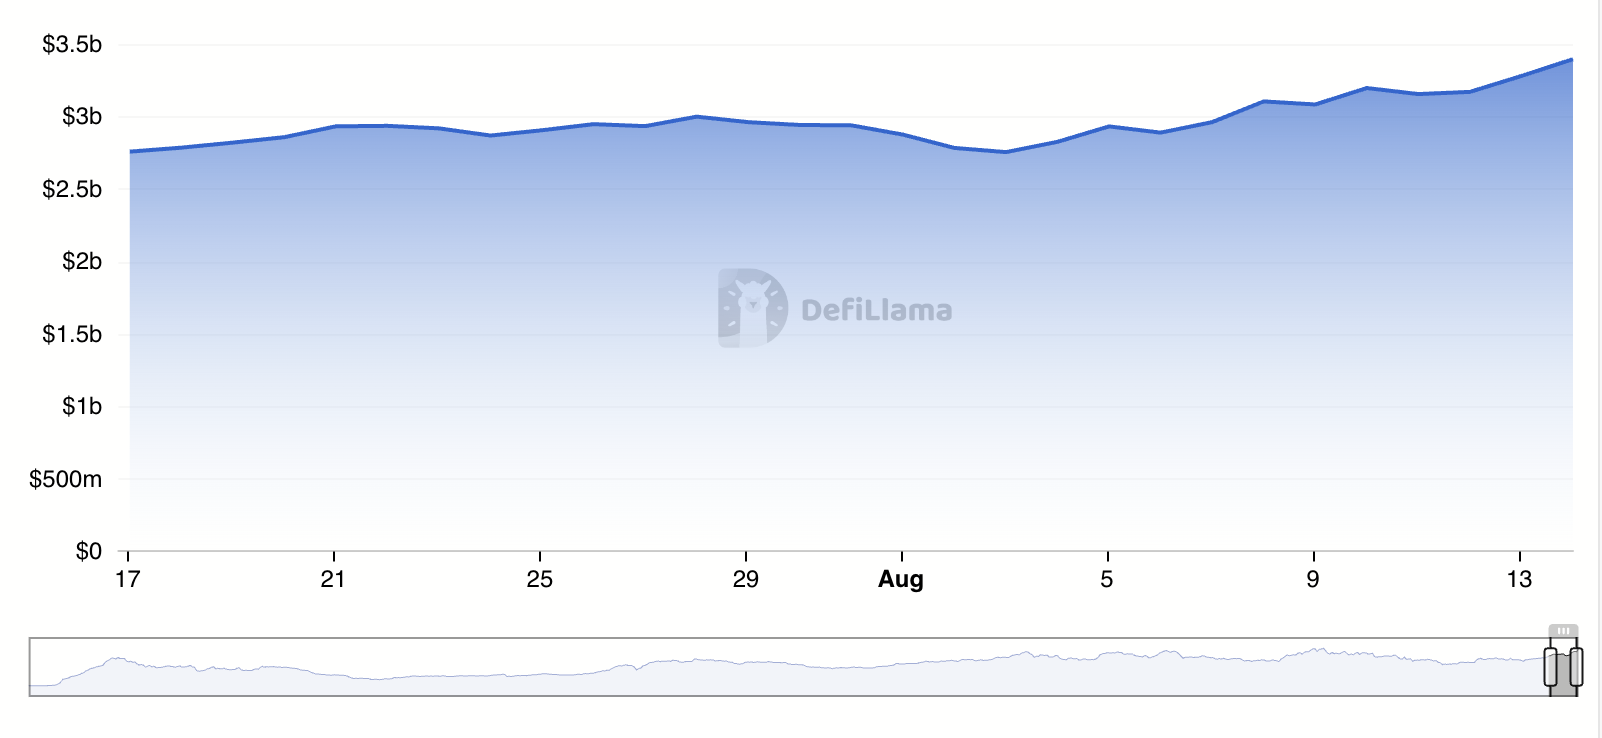
Arbitrum’s decentralized finance (DeFi) total value locked (TVL) has reached a year-to-date high of $3.39 billion.
The growth comes as increased activity on the Ethereum network—fueled by rising trading activity—spills over to Layer-2 solutions (L2s) like Arbitrum.
Arbitrum Sees Record Liquidity Amid Ethereum Network Uptick
According to DeFiLlama, Arbitrum’s TVL has reached a year-to-date high of $3.39 billion, climbing steadily over the past four weeks.
For token TA and market updates: Want more token insights like this? Sign up for Editor Harsh Notariya’s Daily Crypto Newsletter
 Arbitrum TVL. Source:
Arbitrum TVL. Source:
Arbitrum TVL. Source:
A rising TVL indicates greater liquidity and usage on a network. It suggests that more capital is being locked into smart contracts for trading, lending, or other decentralized finance activities.
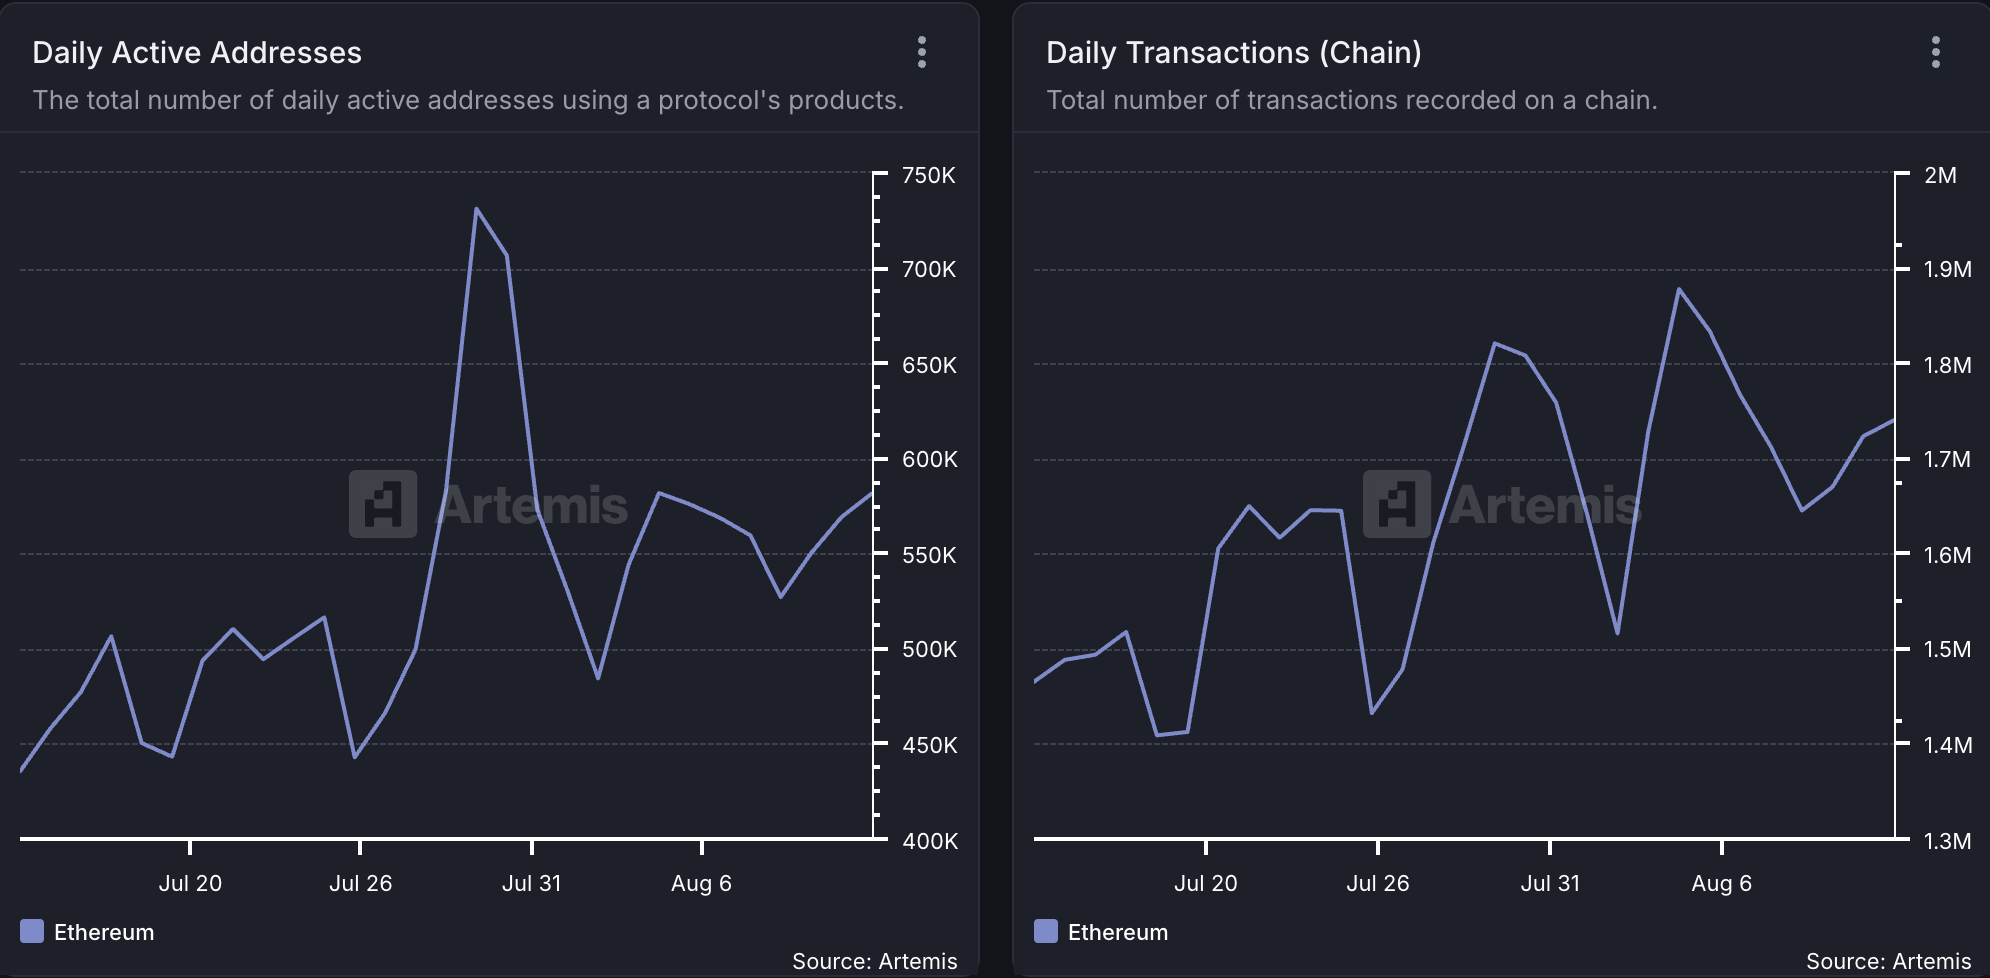
For Arbitrum, its rising user demand mirrors Ethereum’s recent network activity. According to Artemis, Ethereum’s daily active address count has surged 33% over the past few weeks, with transaction volume up 10%.
 Ethereum Network Activity. Source:
Ethereum Network Activity. Source:
Ethereum Network Activity. Source:
When Ethereum experiences a rise in user demand like this, much of the activity spills into L2s. These networks provide faster transaction times and lower fees, attracting users who want to avoid congestion on the main Ethereum chain.
As a result, L2s like Arbitrum often see increased liquidity and engagement whenever Ethereum experiences heightened activity.
ARB Rockets as Market Interest Heats Up
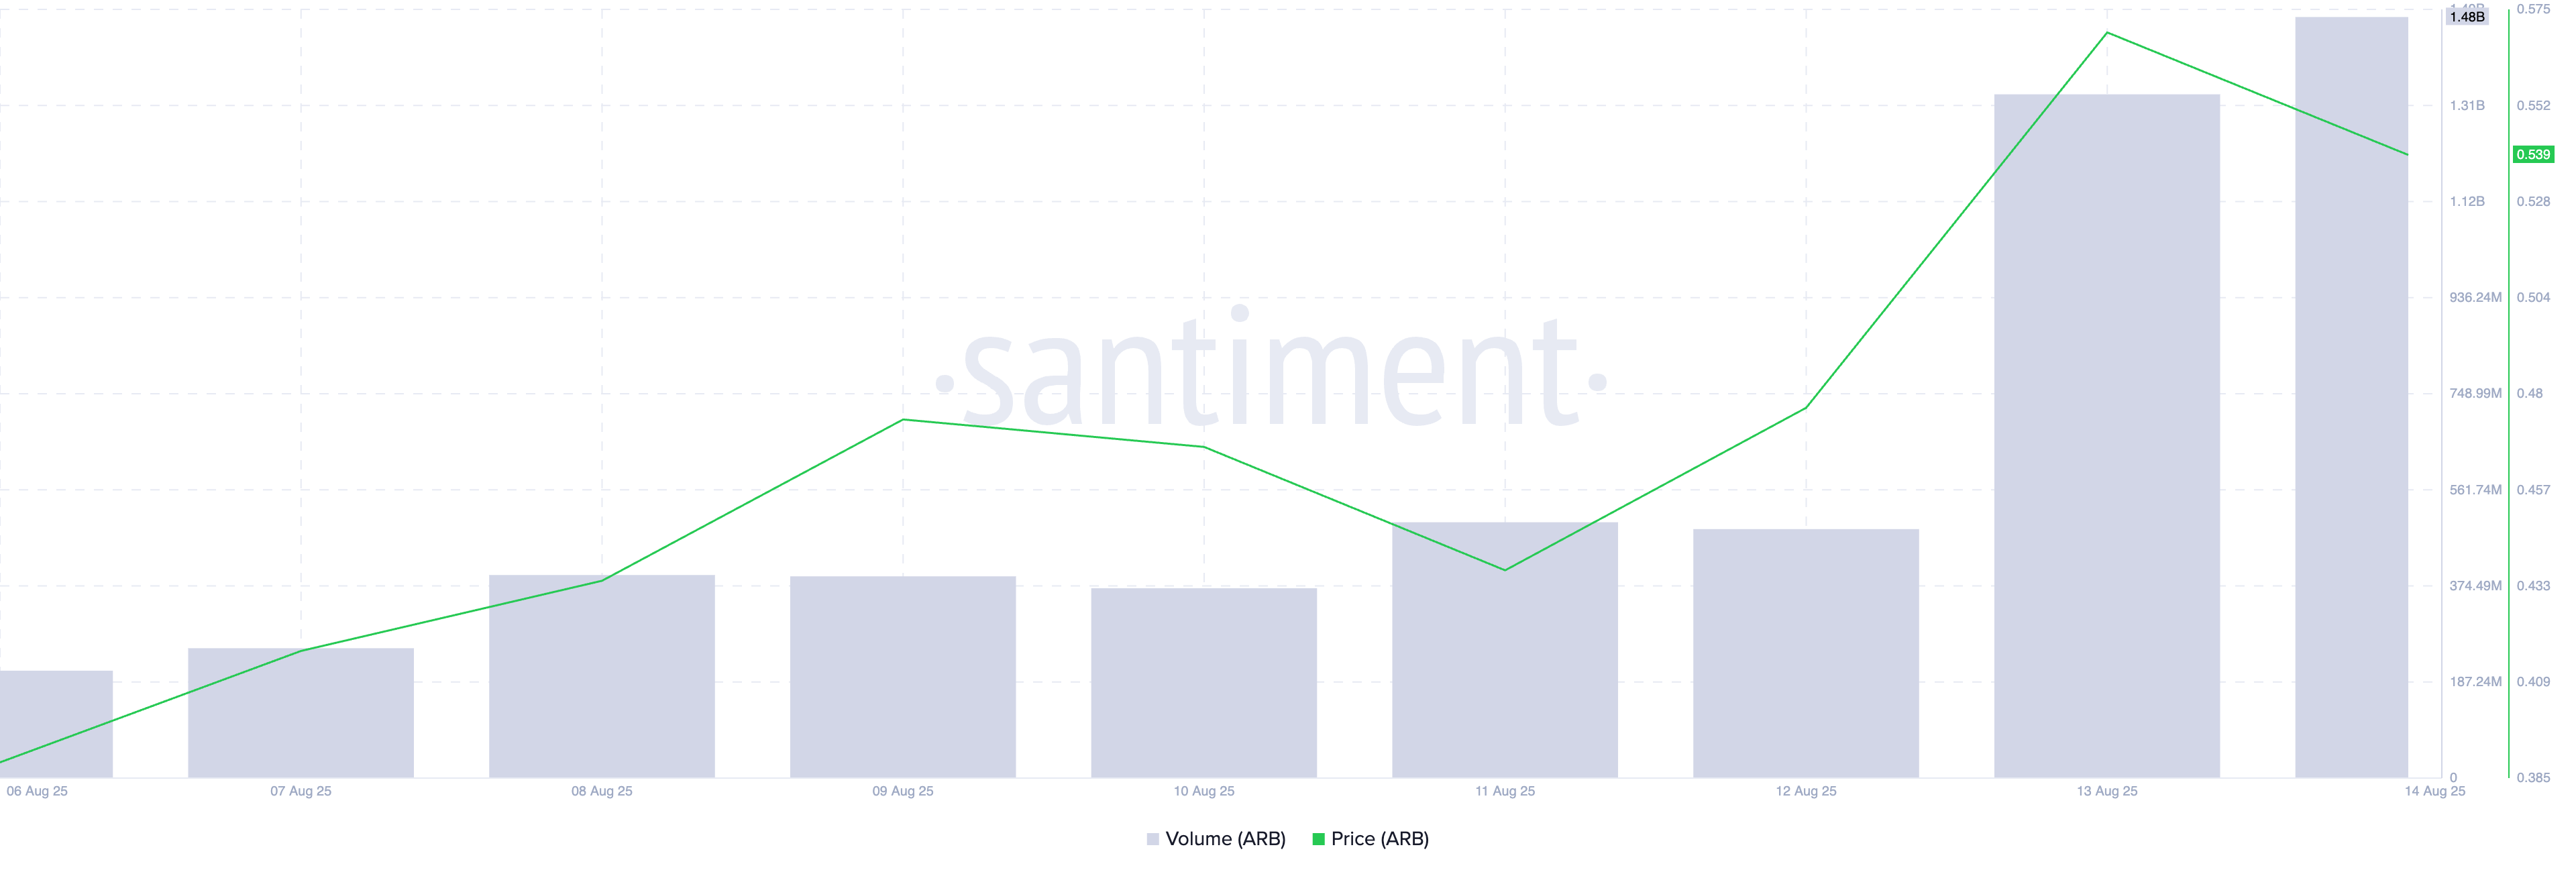
At press time, ARB trades at $0.54, climbing by 12% in the past 24 hours. During that period, its trading volume is up by 155% and currently totals $1.48 billion.
 ARB Price and Trading Volume. Source:
ARB Price and Trading Volume. Source:
ARB Price and Trading Volume. Source:
When an asset’s price and trading volume climb simultaneously, it signals strong market interest and bullish sentiment.
ARB’s rising price shows that demand outpaces supply, while its high trading volume confirms that the movement is backed by significant participation rather than thin liquidity. This trend often attracts more traders and investors, and could drive further gains for ARB in the short term.
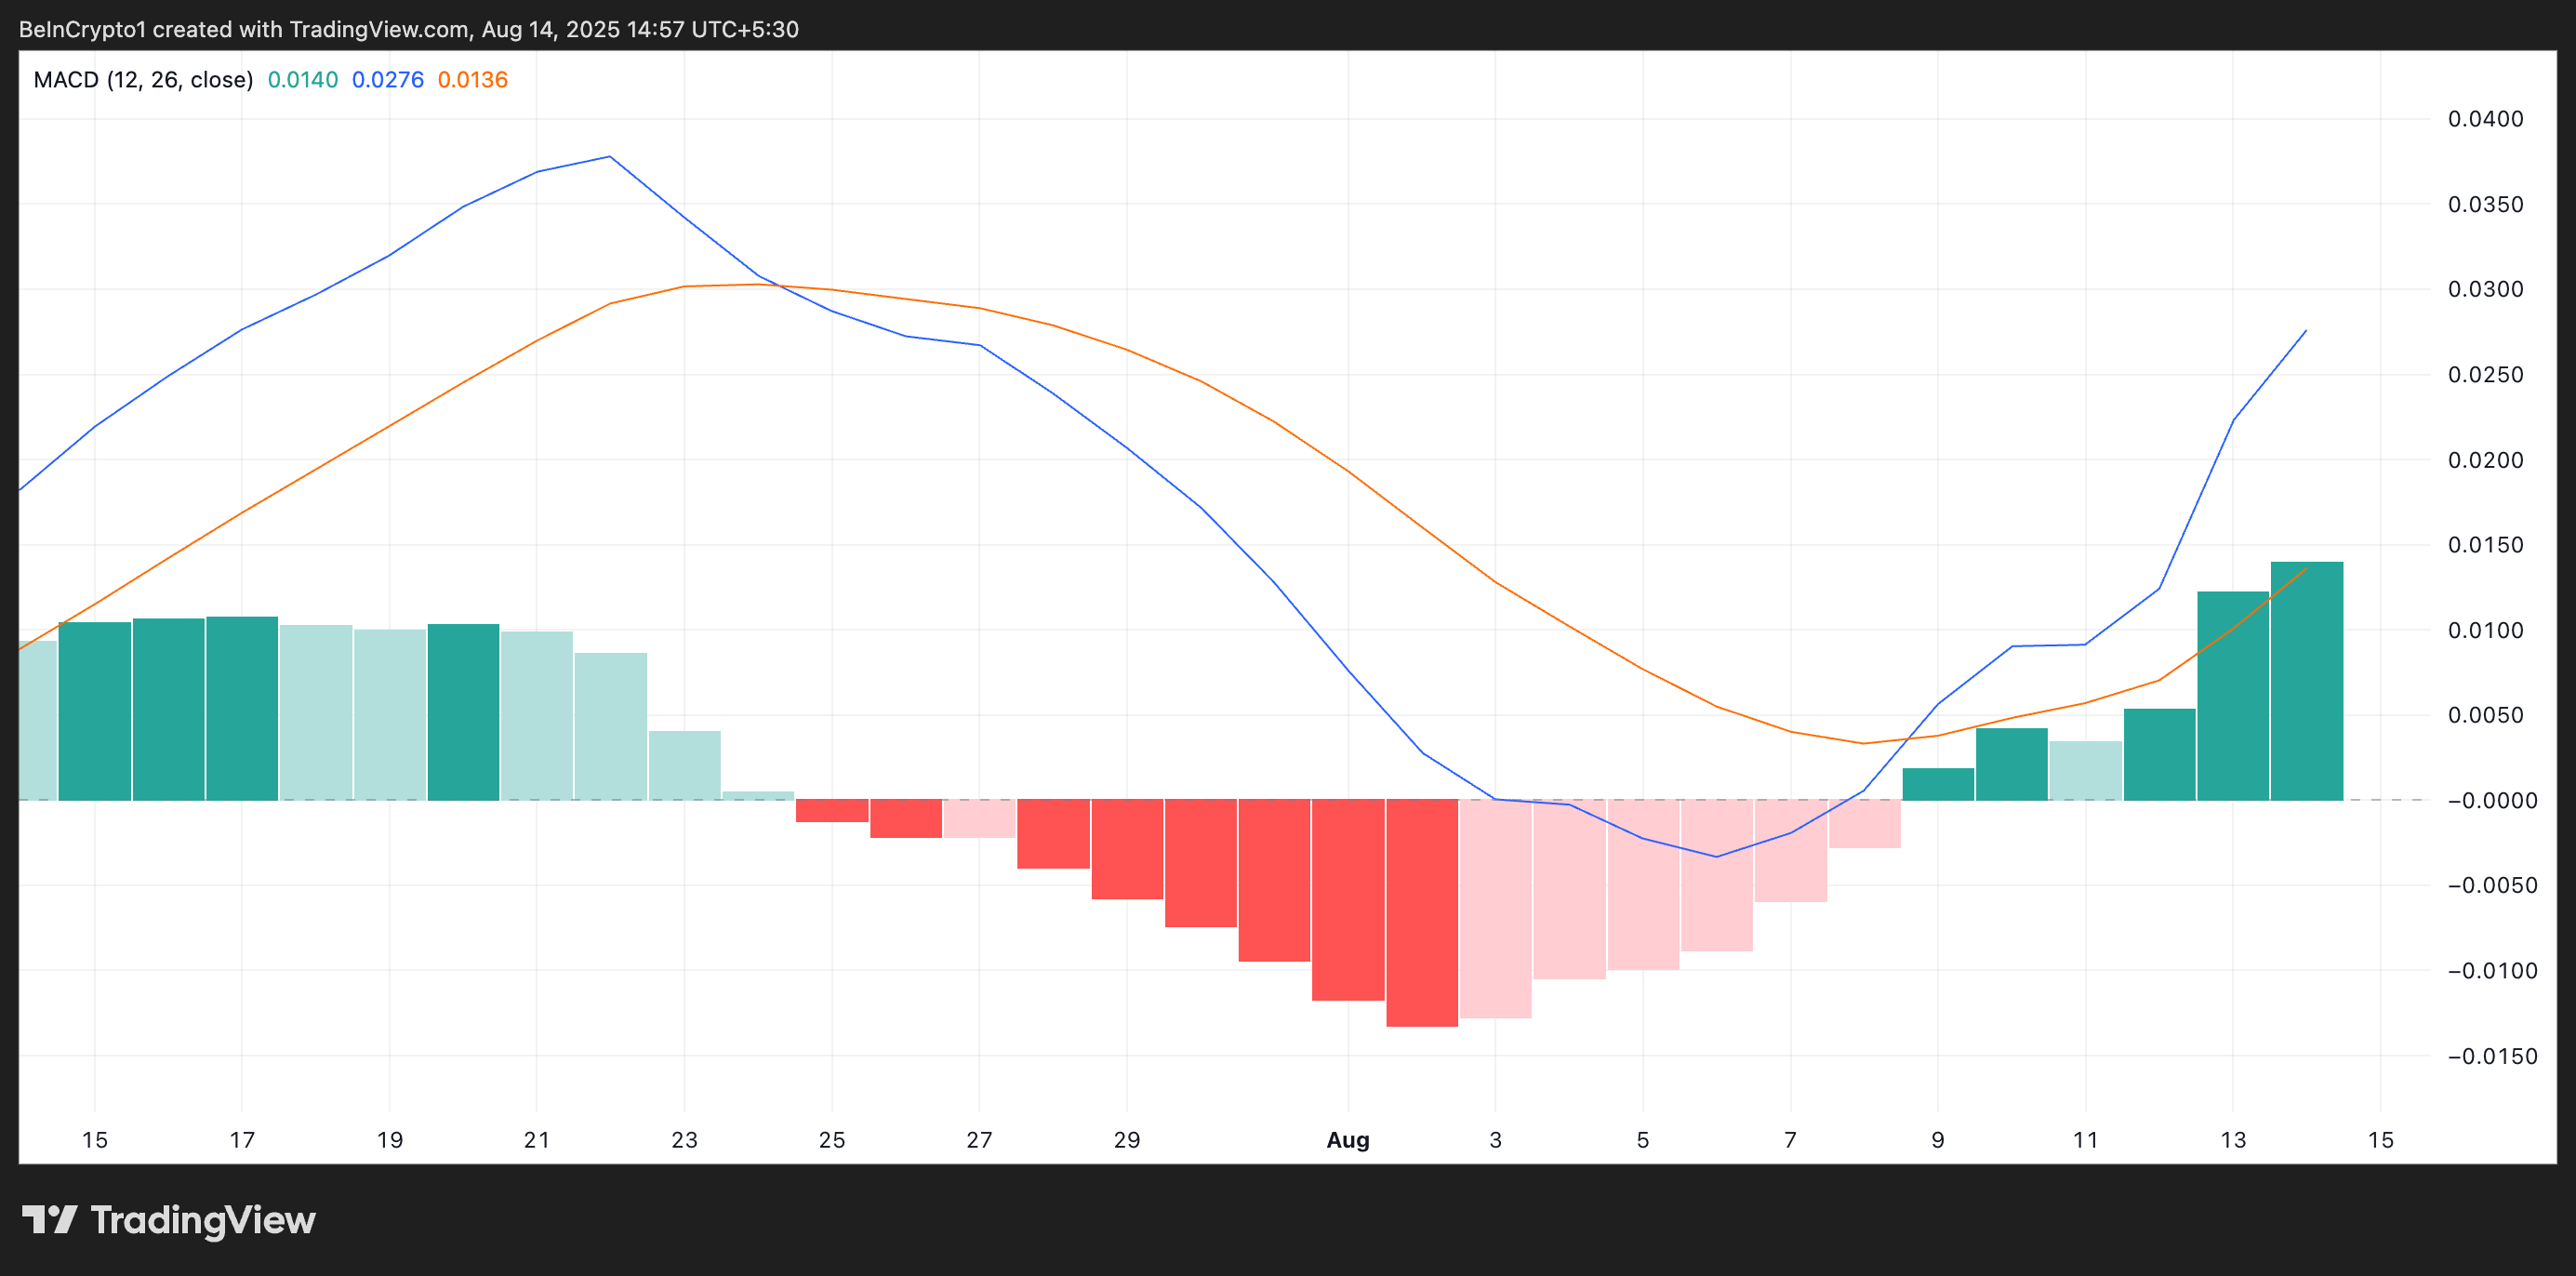
Further, the bullish crossover of ARB’s Moving Average Convergence Divergence (MACD) setup supports this bullish outlook. As of this writing, the token’s MACD line (blue) rests above its signal line (orange), confirming the buy-side pressure.
 ARB MACD. Source:
ARB MACD. Source:
ARB MACD. Source:
Moreover, the histogram bars that make up the MACD indicator have been gradually growing since August 6, with the green bars expanding in size. When this happens, it suggests that the upward trend is gaining strength.
Can Bulls Push ARB Toward $0.74?
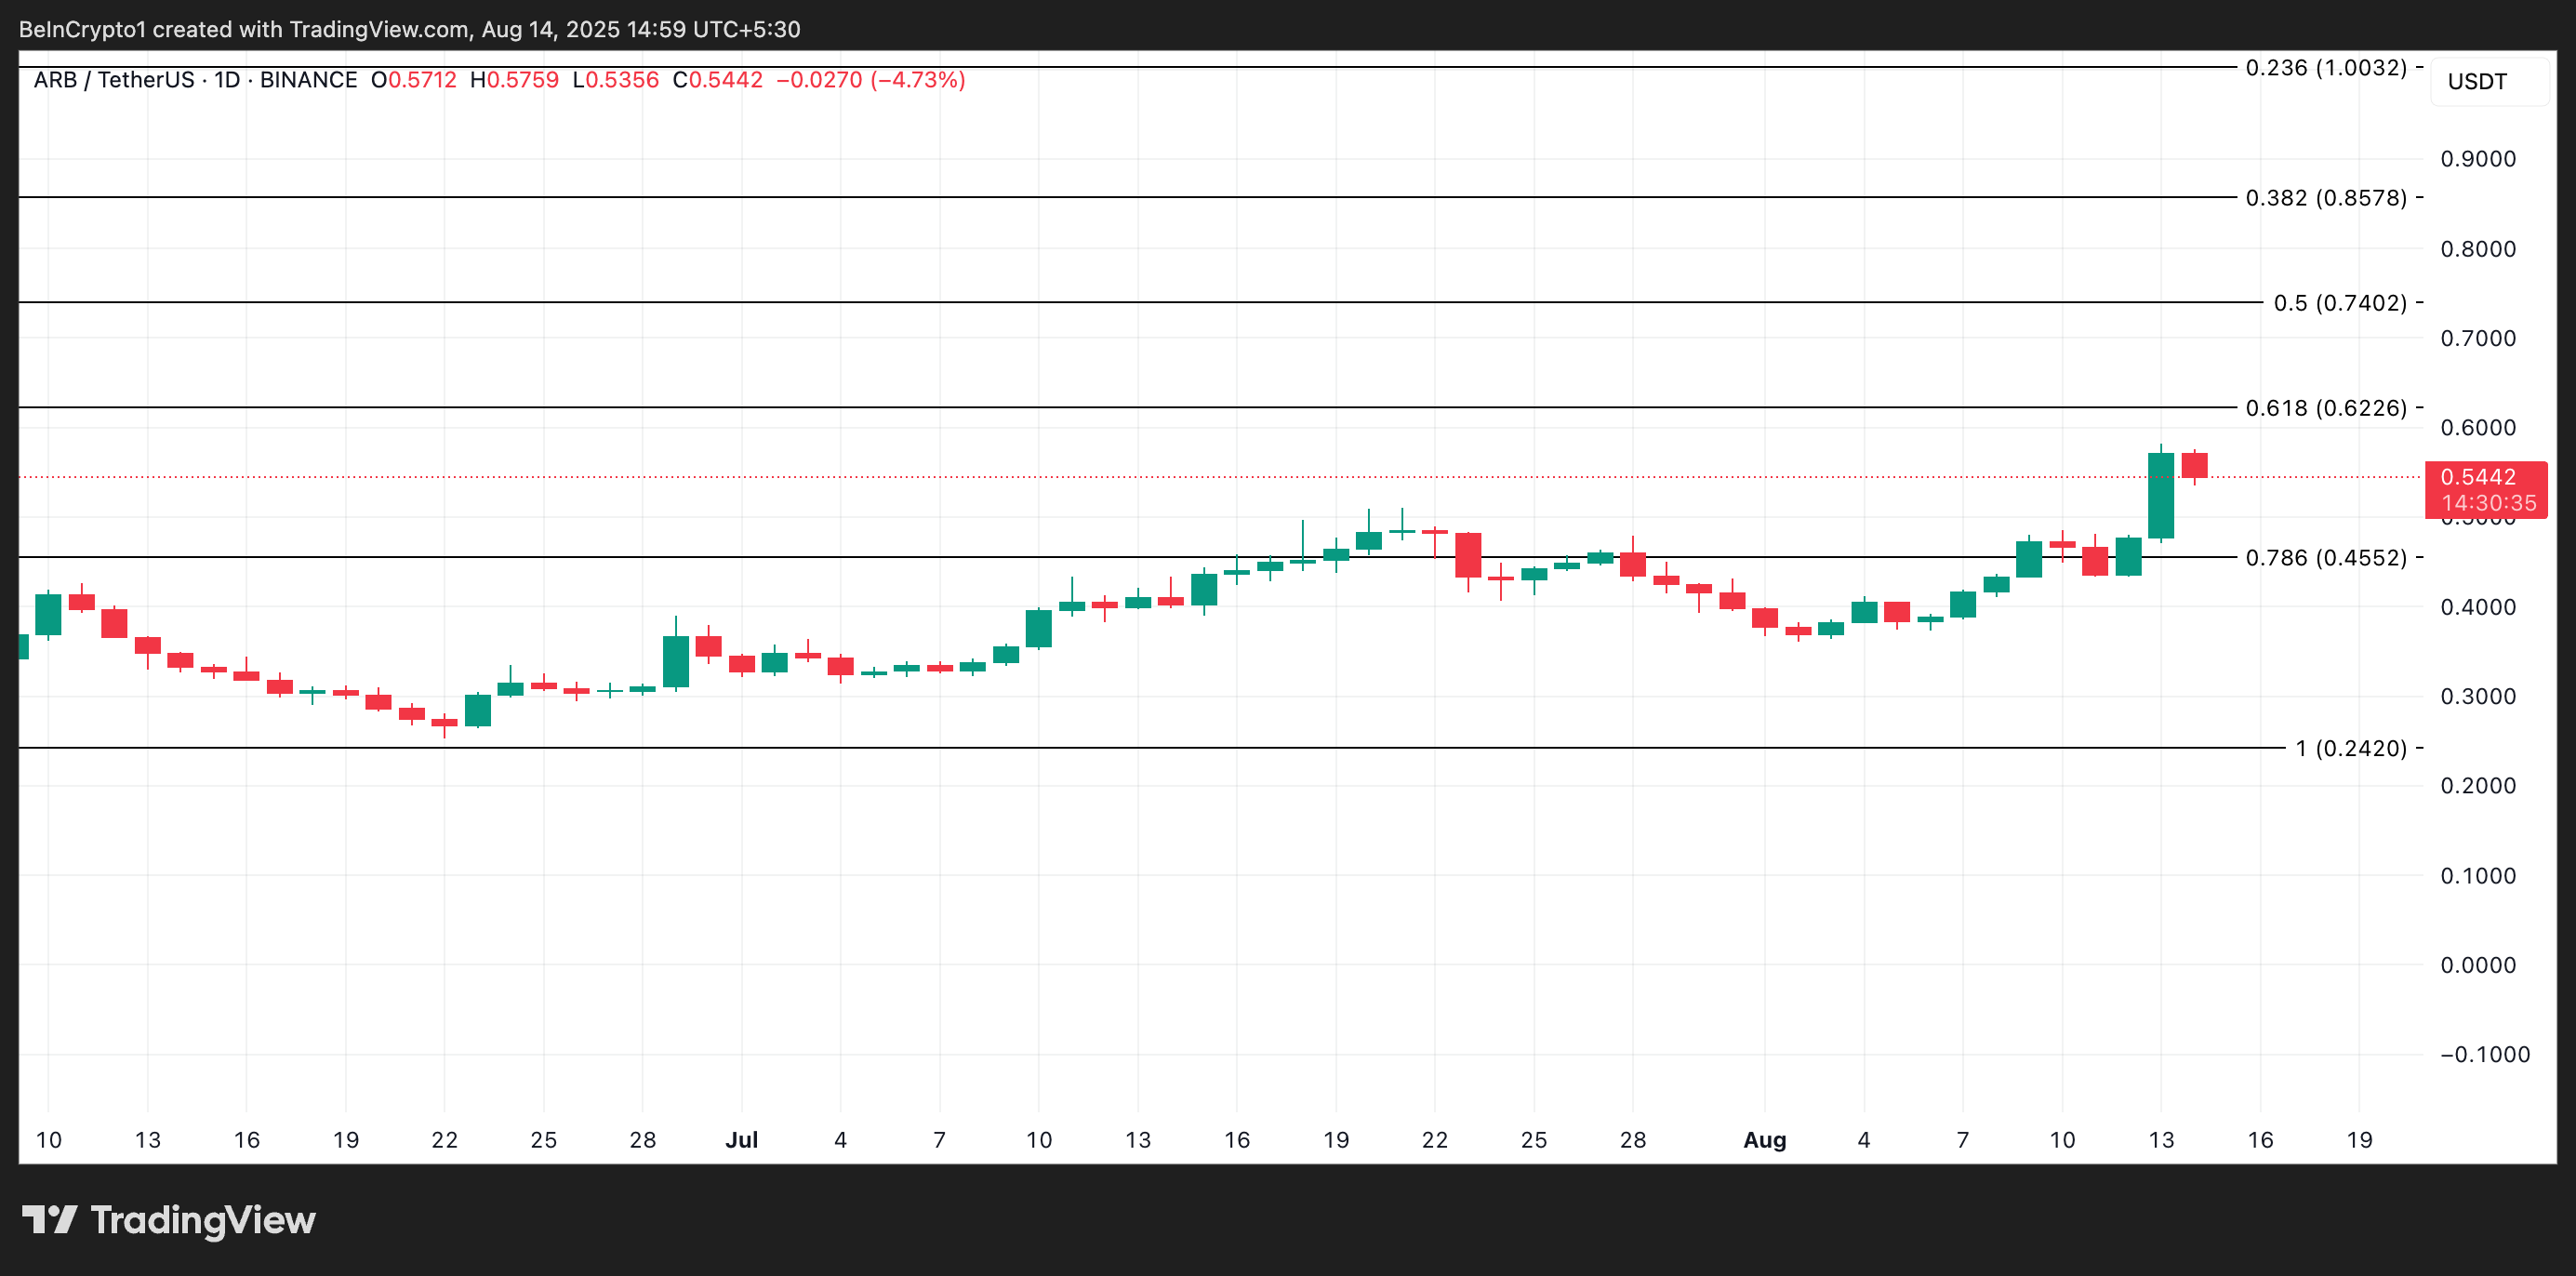
Sustained ARB accumulation could drive its price toward $0.62. A successful breach of this resistance level could propel ARB’s price toward $0.74, a high it last reached in January.
 ARB Price Analysis. Source:
ARB Price Analysis. Source:
ARB Price Analysis. Source:
However, if selloffs begin, the altcoin’s price risks plunging to $0.45.
Disclaimer: The content of this article solely reflects the author's opinion and does not represent the platform in any capacity. This article is not intended to serve as a reference for making investment decisions.
You may also like
US CPI Heats Up Across the Board, Triggering "Inflation Spiral" Alert; October Rate Hike Odds Once Hit 50%. "New Fed News Agency": Watch Waller's Speech This Week
After the CPI was released, the market-implied rate hike probability first rose to 50% before falling back to 40%. Wall Street generally believes that whether action will be taken in October still depends on how the Federal Reserve assesses inflation trends. "The New Fed News Agency" noted that, unlike in August when price increases were concentrated in certain items, the stronger-than-expected performance of September's core CPI was more broad-based, further reinforcing the case for a December rate hike. The speech by Waller on Friday morning Beijing time is his last public statement before the Fed's blackout period ahead of this month's meeting. Economists are warning about an "inflation spiral," with real purchasing power and midterm election pressures interweaving.
The calm period in the US stock market is over! The S&P 500 ends its record of 53 consecutive trading days without a drop of over 1%. AI stock sell-off intensifies market concerns.
The S&P 500 Index fell by 1.1%, ending a streak of 53 consecutive trading days without a drop of 1% or more. This was the longest period of calm since January 2020.
Federal Reserve Beige Book: U.S. economy expands moderately but inflationary pressures intensify; AI boosts productivity curbing some corporate hiring demand
The latest Beige Book released by the Federal Reserve on Wednesday shows that overall economic activity in the United States continues to grow, but performance varies across regions. Consumer spending remains generally weak, and there has been little change in the labor market.
Overnight US Stocks | September Inflation Remains High, Major Indexes Decline, Coreweave (CRWV.US) Drops Over 15%
At the close, the Dow Jones Industrial Average fell by 47.96 points, or 0.09%, to 51,622.14 points; the S&P 500 Index dropped by 85.95 points, or 1.10%, to 7,719.50 points; and the Nasdaq Composite Index declined by 511.51 points, or 1.88%, to 26,692.87 points.
Crypto prices
More


