Bitcoin price is trading at $111,130 with short-term bullish momentum; resistance sits near $112,000 while support ranges $106,000–$108,000. Hourly and weekly charts (CoinStats, TradingView) suggest a possible correction if key levels break, otherwise a move toward $112,000 is likely.
-
BTC short-term resistance: $112,000 — support: $106,000–$108,000.
-
Hourly momentum shows BTC mid-channel; weekly candle close will confirm trend direction.
-
All top 10 coins are in the green, per CoinStats; monitor weekly structure for persistent moves.
Bitcoin price update: BTC trading at $111,130 with resistance near $112,000 — monitor $106k–$108k support for correction risk. Read analysis and key levels now.
What is the Bitcoin price outlook today?
Bitcoin price is trading at $111,130 and shows mild upward momentum, with immediate resistance around $112,000 and support between $106,000 and $108,000. Short-term charts place BTC in a local channel; the weekly candle close will determine whether the bullish retracement continues or a correction resumes.
How could Bitcoin reach $112,000 and what would invalidate that move?
Price could test $112,000 if the daily bar closes near current resistance and buying volume increases. A decisive breakout requires follow-through on the hourly and daily frames. Conversely, a daily close below $109,283 and failure to hold $106,000–$108,000 would invalidate the bullish scenario.
All top coins from the top 10 list are again in the green zone, according to CoinStats.
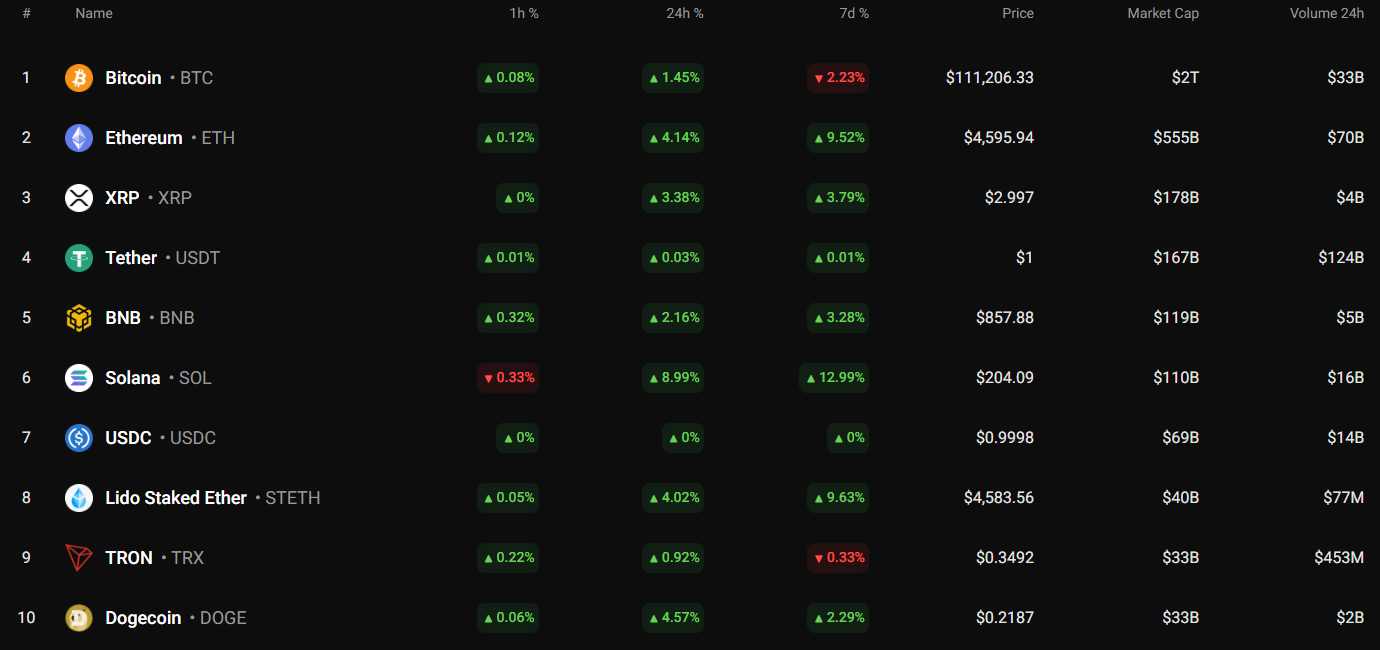
Top coins by CoinStats
How is BTC/USD trading on short and long time frames?
On the hourly chart, the BTC rate sits mid-channel, suggesting limited immediate directional conviction. From the daily and weekly perspectives, a false breakout of the $109,283 support has occurred and price has not recovered strongly, signalling caution for bulls.
What are the technical scenarios traders should watch?
Watch these key levels and signals:
- Resistance: $112,000 — daily close above this level supports near-term continuation.
- Support band: $106,000–$108,000 — a break may trigger deeper correction.
- Weekly close: below the prior bar’s low increases probability of decline toward $105,000.
The price of Bitcoin (BTC) has risen by 1.45% since yesterday.
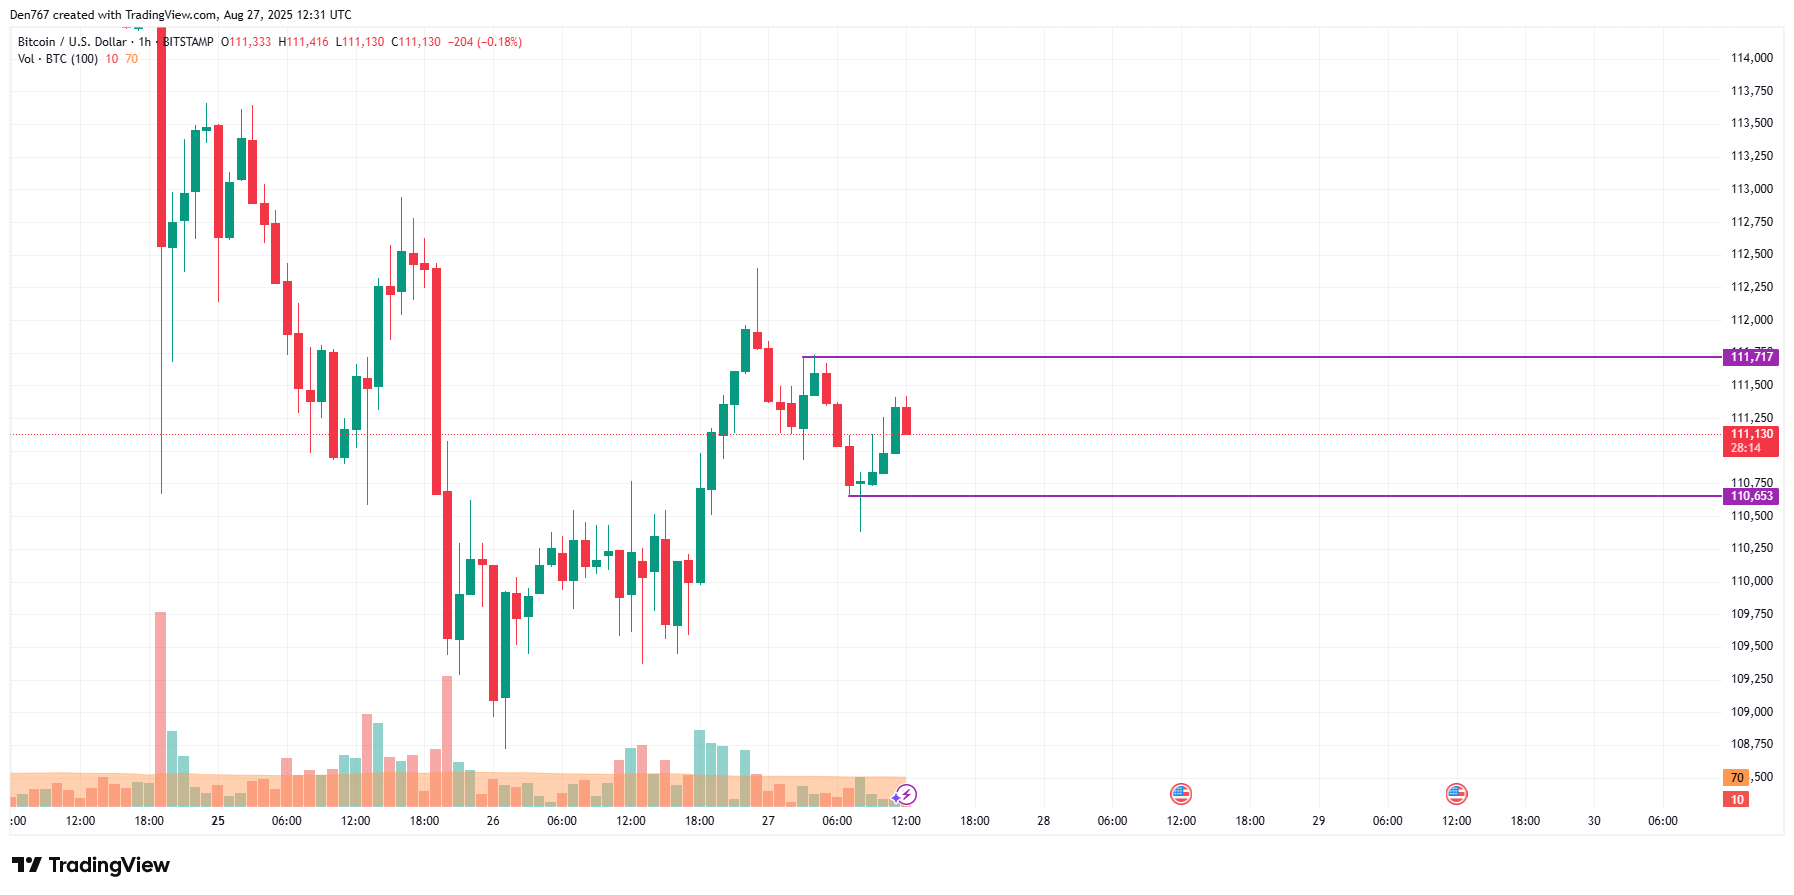
Image by TradingView
From the intraday view, momentum indicators align with a neutral-to-bullish bias while volatility remains elevated. Traders using stop-based risk management should size positions around the $106k–$108k support range.
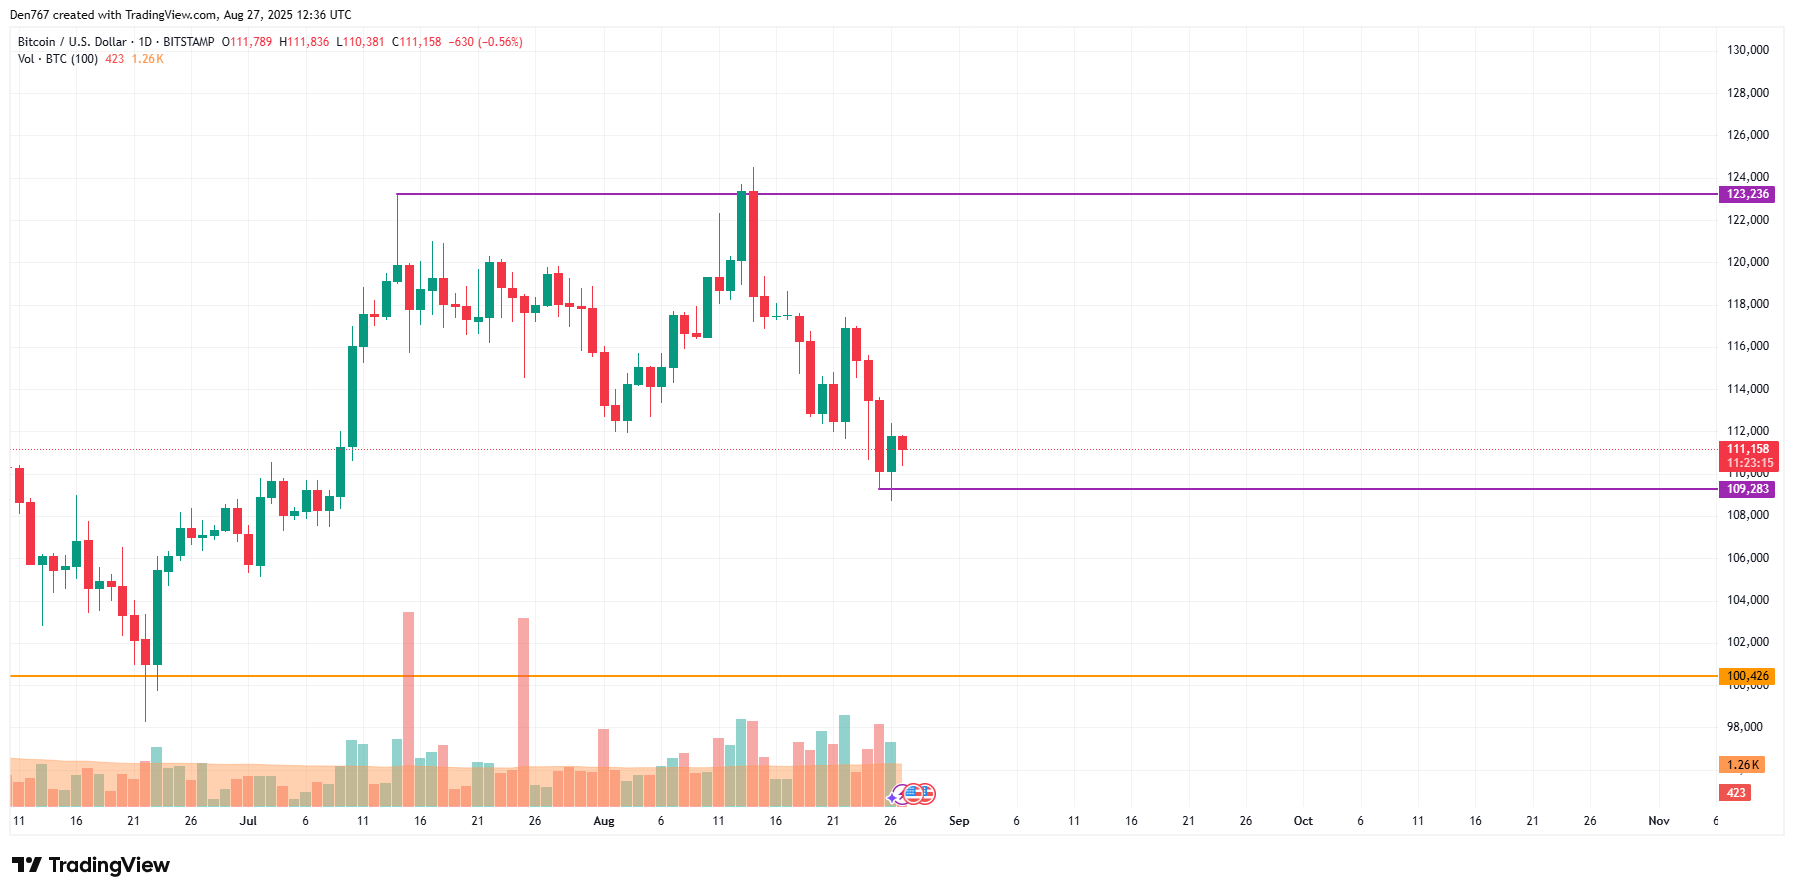
Image by TradingView
On the longer time frame, the price of the main crypto has not bounced back too far after a false breakout of the support of $109,283. If price fails to reclaim and hold above this area, the path of least resistance could be lower.
If the situation does not change, there is a chance to see an ongoing correction to the $106,000-$108,000 zone.
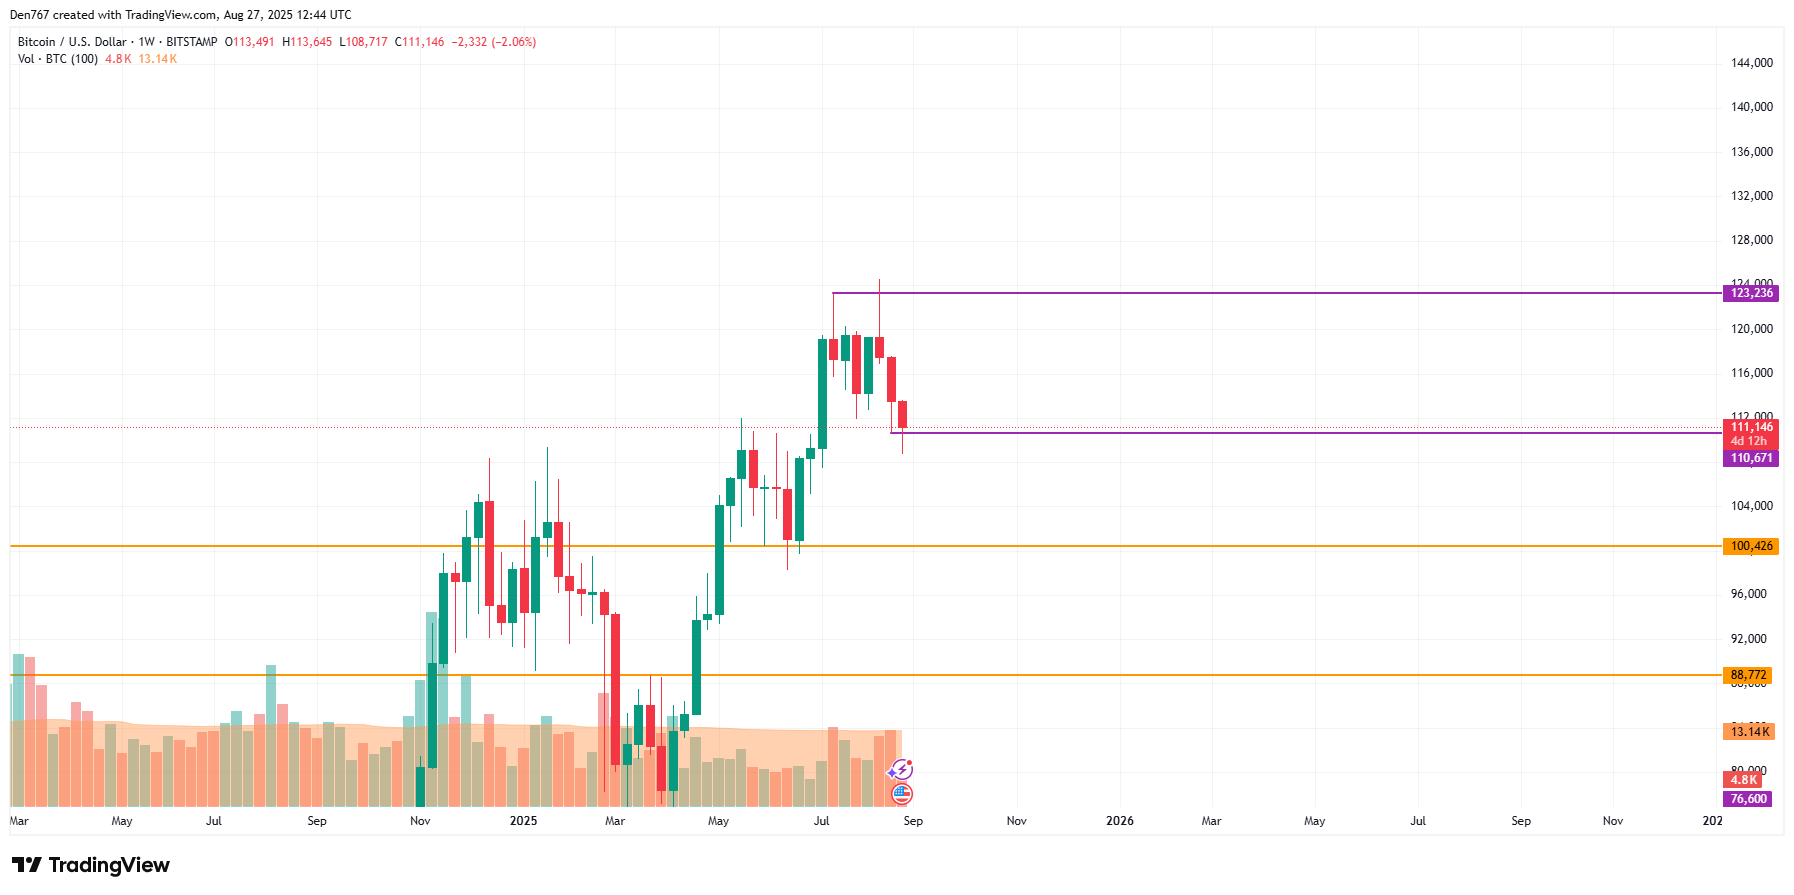
Image by TradingView
From the midterm point of view, one should pay attention to the weekly candle’s closure in terms of the previous bar’s low. If its breakout happens, the decline is likely to continue to the $105,000 mark.
Bitcoin is trading at $111,130 at press time. Market data sources referenced in this report: CoinStats and TradingView (mentioned as plain text).
Frequently Asked Questions
What levels should traders watch for Bitcoin support and resistance?
Traders should monitor resistance near $112,000 and support between $106,000–$108,000. A weekly close below the prior bar’s low increases the probability of a deeper move to about $105,000.
How likely is a correction in BTC this week?
If BTC fails to sustain above $109,283 and the weekly close breaches the previous bar low, a correction toward $106,000–$108,000 is likely. Watch daily volume and momentum for confirmation.
Key Takeaways
- Short-term bias: Mildly bullish if BTC breaks above $112,000; otherwise neutral-to-bearish.
- Critical support: $106,000–$108,000 — key for risk management and stop placement.
- Action: Monitor daily and weekly closes plus on-chain and exchange flow data for confirmation before adding exposure.
Conclusion
This update synthesizes CoinStats and TradingView data to assess the current Bitcoin price outlook. Bitcoin price action between $106k and $112k will determine near-term direction. Traders and investors should use defined risk parameters and follow confirmed daily or weekly breaks before adjusting positions. For continued coverage, monitor market updates and weekly structure.