Bitget App
Trade smarter
Buy cryptoMarketsTradeFuturesStocksEarnInstitutionAI & More
Is Solana (SOL) Ready to Shine? Price Analysis and Outlook

Is Solana (SOL) Ready to Shine? Price Analysis and Outlook

CryptodailyCryptodaily2025/08/26 16:00
By:Laurie Dunn

Ethereum (ETH) has led the way over the last few months in the crypto market, but is it time for Solana (SOL) to have its own time in the sun now?

Beautiful uptrend for $SOL
Is Solana (SOL) Ready to Shine? Price Analysis and Outlook image 0

Source: TradingView

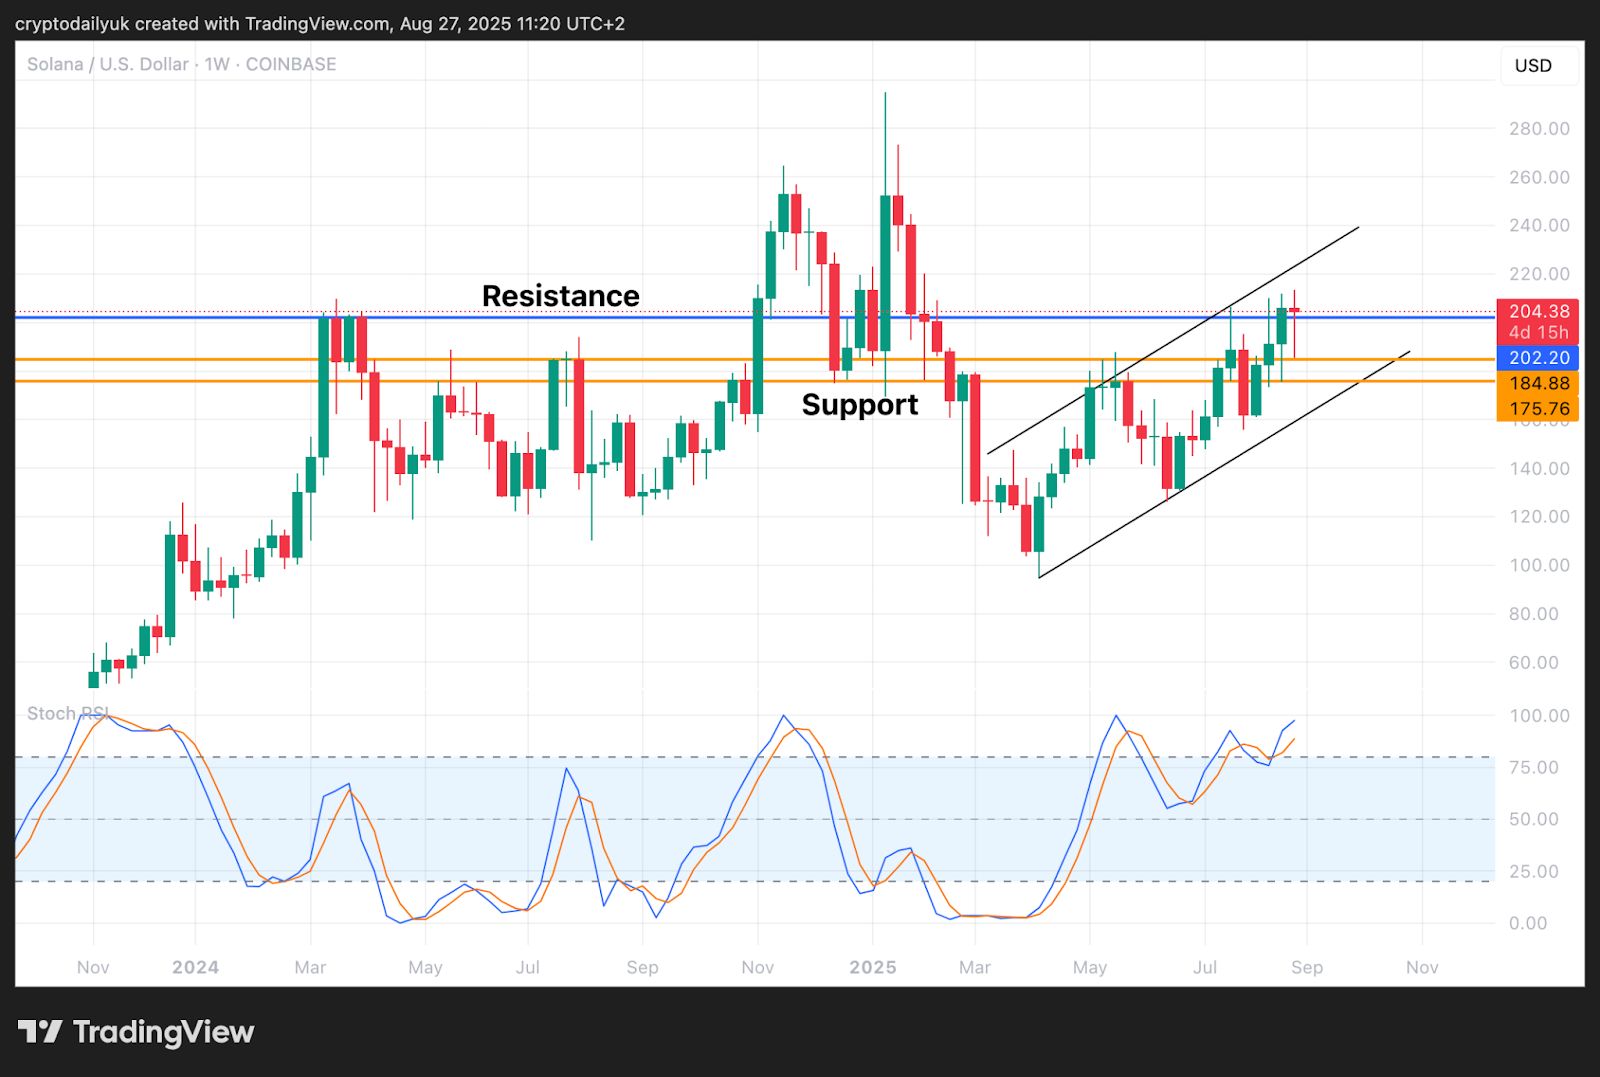
The weekly chart for the $SOL price reveals a beautiful uptrend taking place. Not only that, but this week’s price action puts $SOL just above the major $202 resistance. Obviously we are only half way through the week so things could still change. However, the crypto market is due a solid bounce soon, and so a weekly close above this major level would be an excellent achievement for the $SOL bulls.

Once this last big resistance is held above, the route to the all-time high at $295 would be open. To get there, the price will need to break through the top of the ascending channel. This would in its turn be extremely bullish, and could add the momentum needed to get to the all-time high.

At the bottom of the chart, the Stochastic RSI indicators will need to bounce along the top of the range for long enough to also provide that upside price momentum.

SOL/ETH about to change trend
Is Solana (SOL) Ready to Shine? Price Analysis and Outlook image 1

Source: TradingView

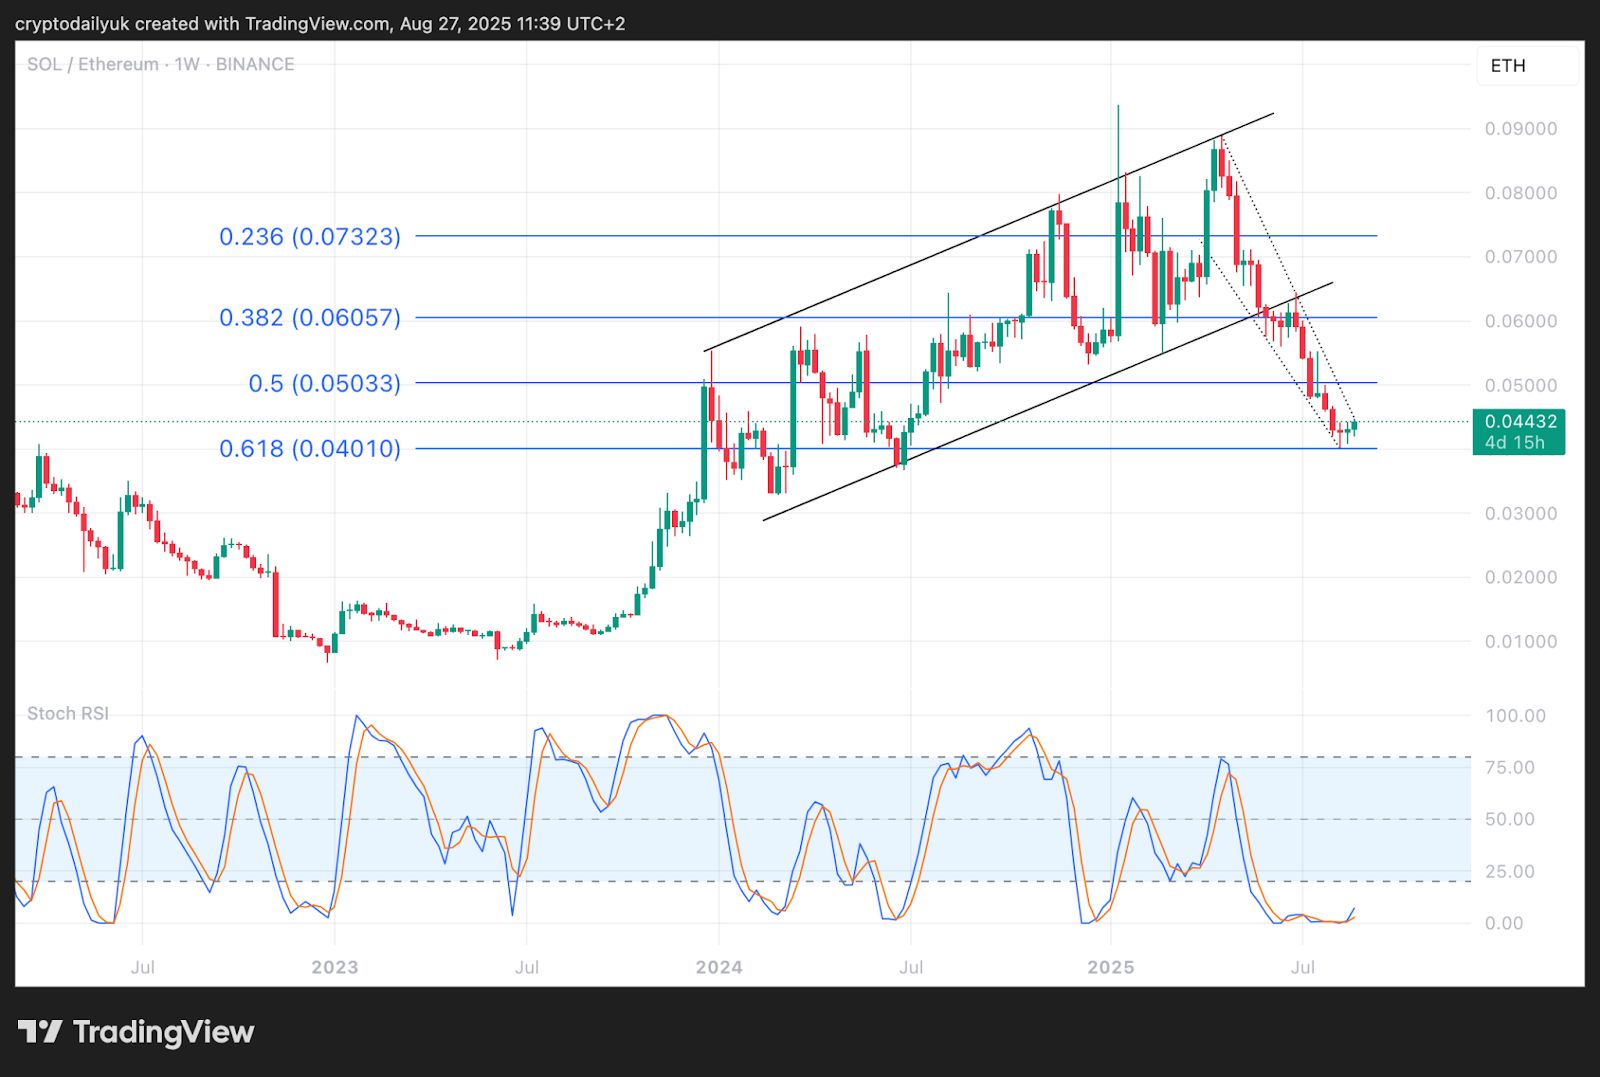
So how do we know that $SOL is going to take over the reins from $ETH , which has had such an amazing ride over these last few months? The answer is as clear as daylight in the above weekly chart for SOL/ETH. 

It can be observed that $SOL was in a strong uptrend against $ETH from the beginning of 2024 and just into the second quarter of 2025. Nonetheless, it was at this point that it all changed. $ETH started on its rocketship rally that not only left $SOL behind, but also helped it to gain around 125% against the mother ship Bitcoin.

Looking at the chart above, it can be noted that SOL/ETH fell out of its ascending channel and went into a spiral in a descending wedge pattern. A perfect touch of the 0.618 Fibonacci arrested the slide, and it now looks as though SOL/ETH could break out of this descending wedge and head back to the ascending channel above.

At the bottom of the chart, the Stochastic RSI indicators have been dragging along the bottom for a while and look as though they are just about to angle back up, bringing momentum back in favour of $SOL.

$SOL at major resistance against $BTC
Is Solana (SOL) Ready to Shine? Price Analysis and Outlook image 2

Source: TradingView

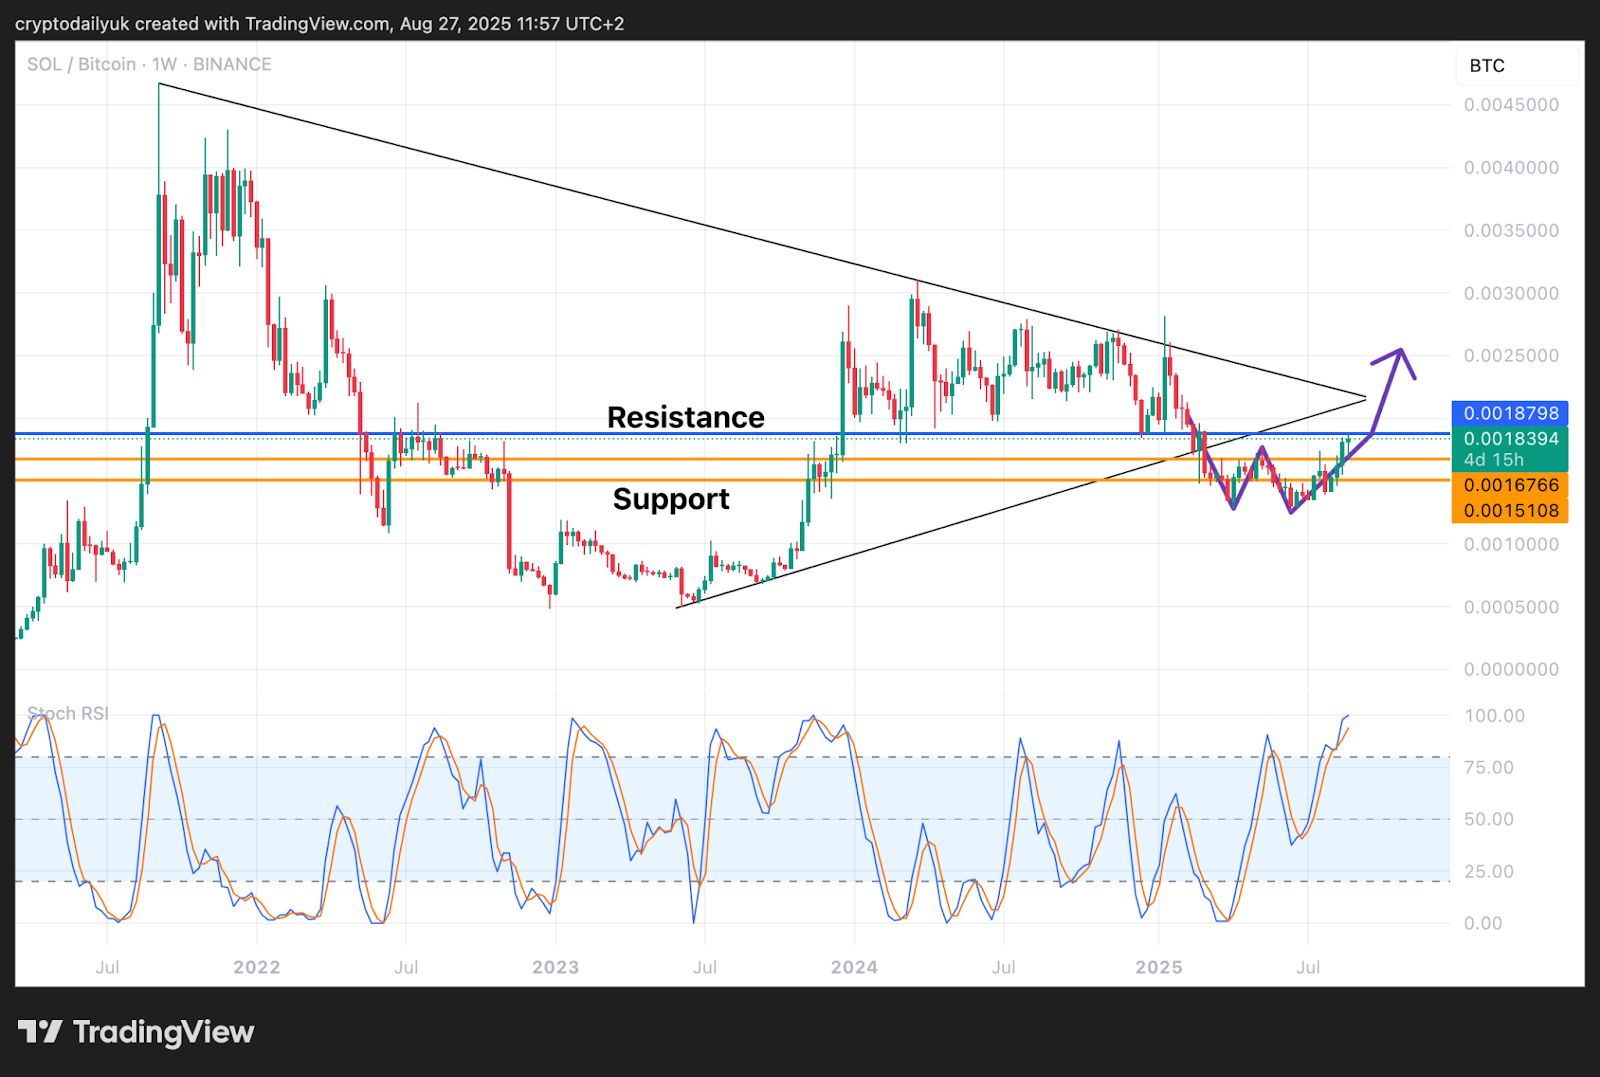
The above SOL/BTC chart is one that was published by Crypto Daily around a month ago. It showed $SOL breaking trend against $BTC at a price of 0.0014 BTC. Since then, $SOL has moved through two of the resistances, and is now up against the major 0.0018 resistance. 

This would be a major price structure breakthrough and could lead to $SOL breaking above the descending trendline of the triangle. Surpassing the eventual target of 0.003 BTC would be the most incredible achievement for $SOL bulls, allowing them to push on to the all-time high for SOL/BTC at 0.0046 BTC.

0
0

Disclaimer: The content of this article solely reflects the author's opinion and does not represent the platform in any capacity. This article is not intended to serve as a reference for making investment decisions.

Understand the market, then trade.
Bitget offers one-stop trading for cryptocurrencies, stocks, and gold.
Trade now!

You may also like

As tech stocks plummet, Goldman Sachs issued a bullish report on US stocks, but after reading it, people became even more worried...

Goldman Sachs strategist Tony Pasquariello released a bullish report, stating that market breadth is "not as bad as reported." However, the report references the internet bubble twice for comparison. Behind the tactical bullishness lie multiple concerns such as slowing profits, a surge in stock supply, and quarterly crowded positions among the "Magnificent Seven."

华尔街见闻•2026/10/14 02:06

Apple (AAPL.US) launches wall-mounted hub HomeView to enter the smart home market; analysts: may generate new income for the services segment

Apple launches a wall-mounted hub to enter the smart home market. Analysts say it may bring new revenue to the services segment, and a paid Siri AI is on the horizon.

智通财经•2026/10/14 01:31

U.S. IPO Preview|Primagrove: Soaring Performance with a 17-Fold Increase, but the $17,000 Cash Pool Raises Concerns

From software outsourcing to integrated software and hardware.

智通财经•2026/10/14 01:17

60% of stocks have fallen into a bear market, the seven tech giants are holding up the S&P alone! BTIG: US stocks may be just a "gentle push" away from collapsing

The S&P 500 is just one step away from its all-time high, but under the surface, turbulence is brewing: 60% of its components have already entered a technical bear market, and only 30% have outperformed the index, the lowest since 1991. All of this is being supported solely by the seven major tech giants—which is, in fact, the biggest risk. With crowded positions and the semiconductor sector mirroring the path of the 2000 bubble burst, an accelerated decline could be triggered during the upcoming earnings season at the end of the month. When the market is standing on just one final leg, it doesn't take much force to topple it.

华尔街见闻•2026/10/14 01:06
60% of stocks have fallen into a bear market, the seven tech giants are holding up the S&P alone! BTIG: US stocks may be just a "gentle push" away from collapsing