
Pi Coin’s Charts Hint at a Turnaround—Here’s Why a 40% Rally Could Be Close

Pi Coin price has been in a long downtrend, but technical charts are flashing early signs of a potential rebound. A bullish divergence on RSI, strong money flow, and easing bearish pressure hint at a possible 40% rally if key support holds.
The Pi Coin price has struggled to impress traders lately. The token traded flat over the last 24 hours and was down about 3.4% over the past week. On a one-year scale, Pi Coin’s performance has been even weaker, with losses of more than 61%.
The steady downtrend makes the latest technical signals stand out even more. Indicators on the charts suggest that a potential reversal might be forming, hinting at a rally if buying pressure builds.
RSI Divergence Hints at Reversal
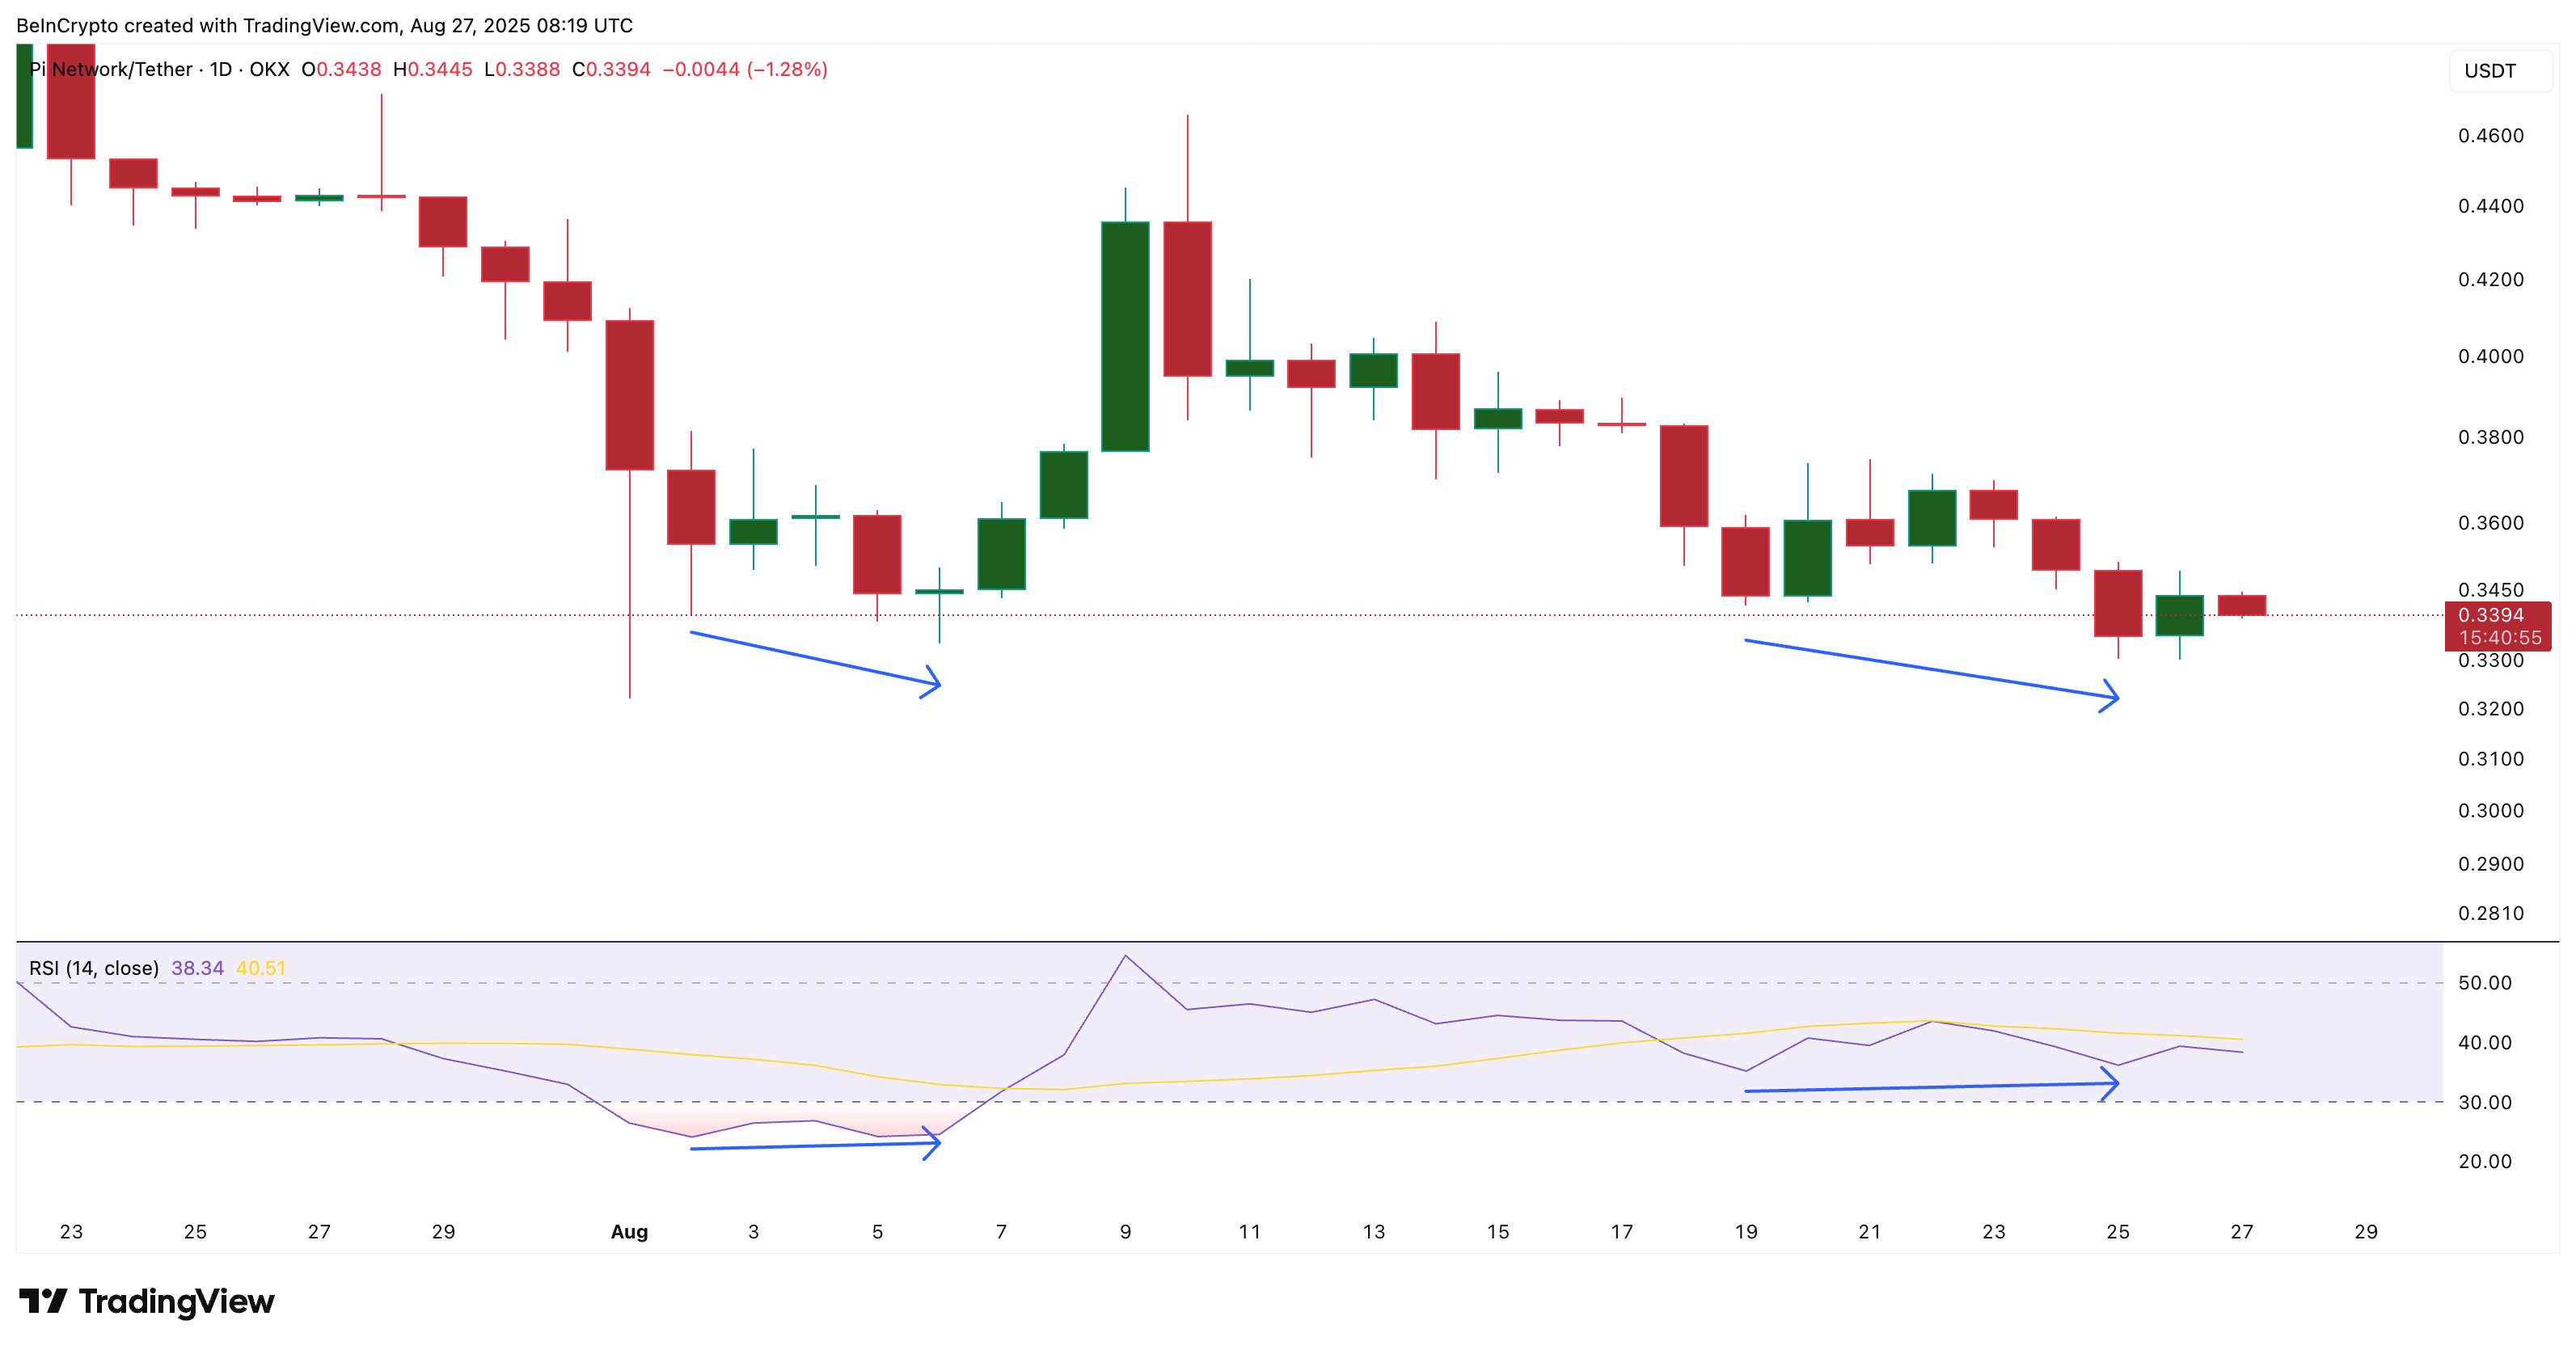
The first key signal is a bullish divergence on the daily Relative Strength Index (RSI). Normally, when the price makes a new low, RSI also makes a new low.
But in Pi Coin’s case, between August 19 and August 25, the price made a lower low, while RSI created a higher low. This mismatch is called a bullish divergence.
 Pi Coin RSI Divergence:
TradingView
Pi Coin RSI Divergence:
TradingView
Bullish divergence is often read as a sign that selling momentum is weakening even while prices continue to fall.
It can mark a turning point where buyers quietly begin to take control. This exact setup also appeared earlier in August. At that time, a similar divergence preceded a 39% rally in Pi Coin’s price, from $0.33 to $0.46. The repeat of this pattern suggests that the token could be setting up for another upward move.
For token TA and market updates: Want more token insights like this? Sign up for Editor Harsh Notariya’s Daily Crypto Newsletter.
MFI and Bull/Bear Power Back the Bullish Signal
The bullish case, exhibited by the RSI, is reinforced by two more indicators.
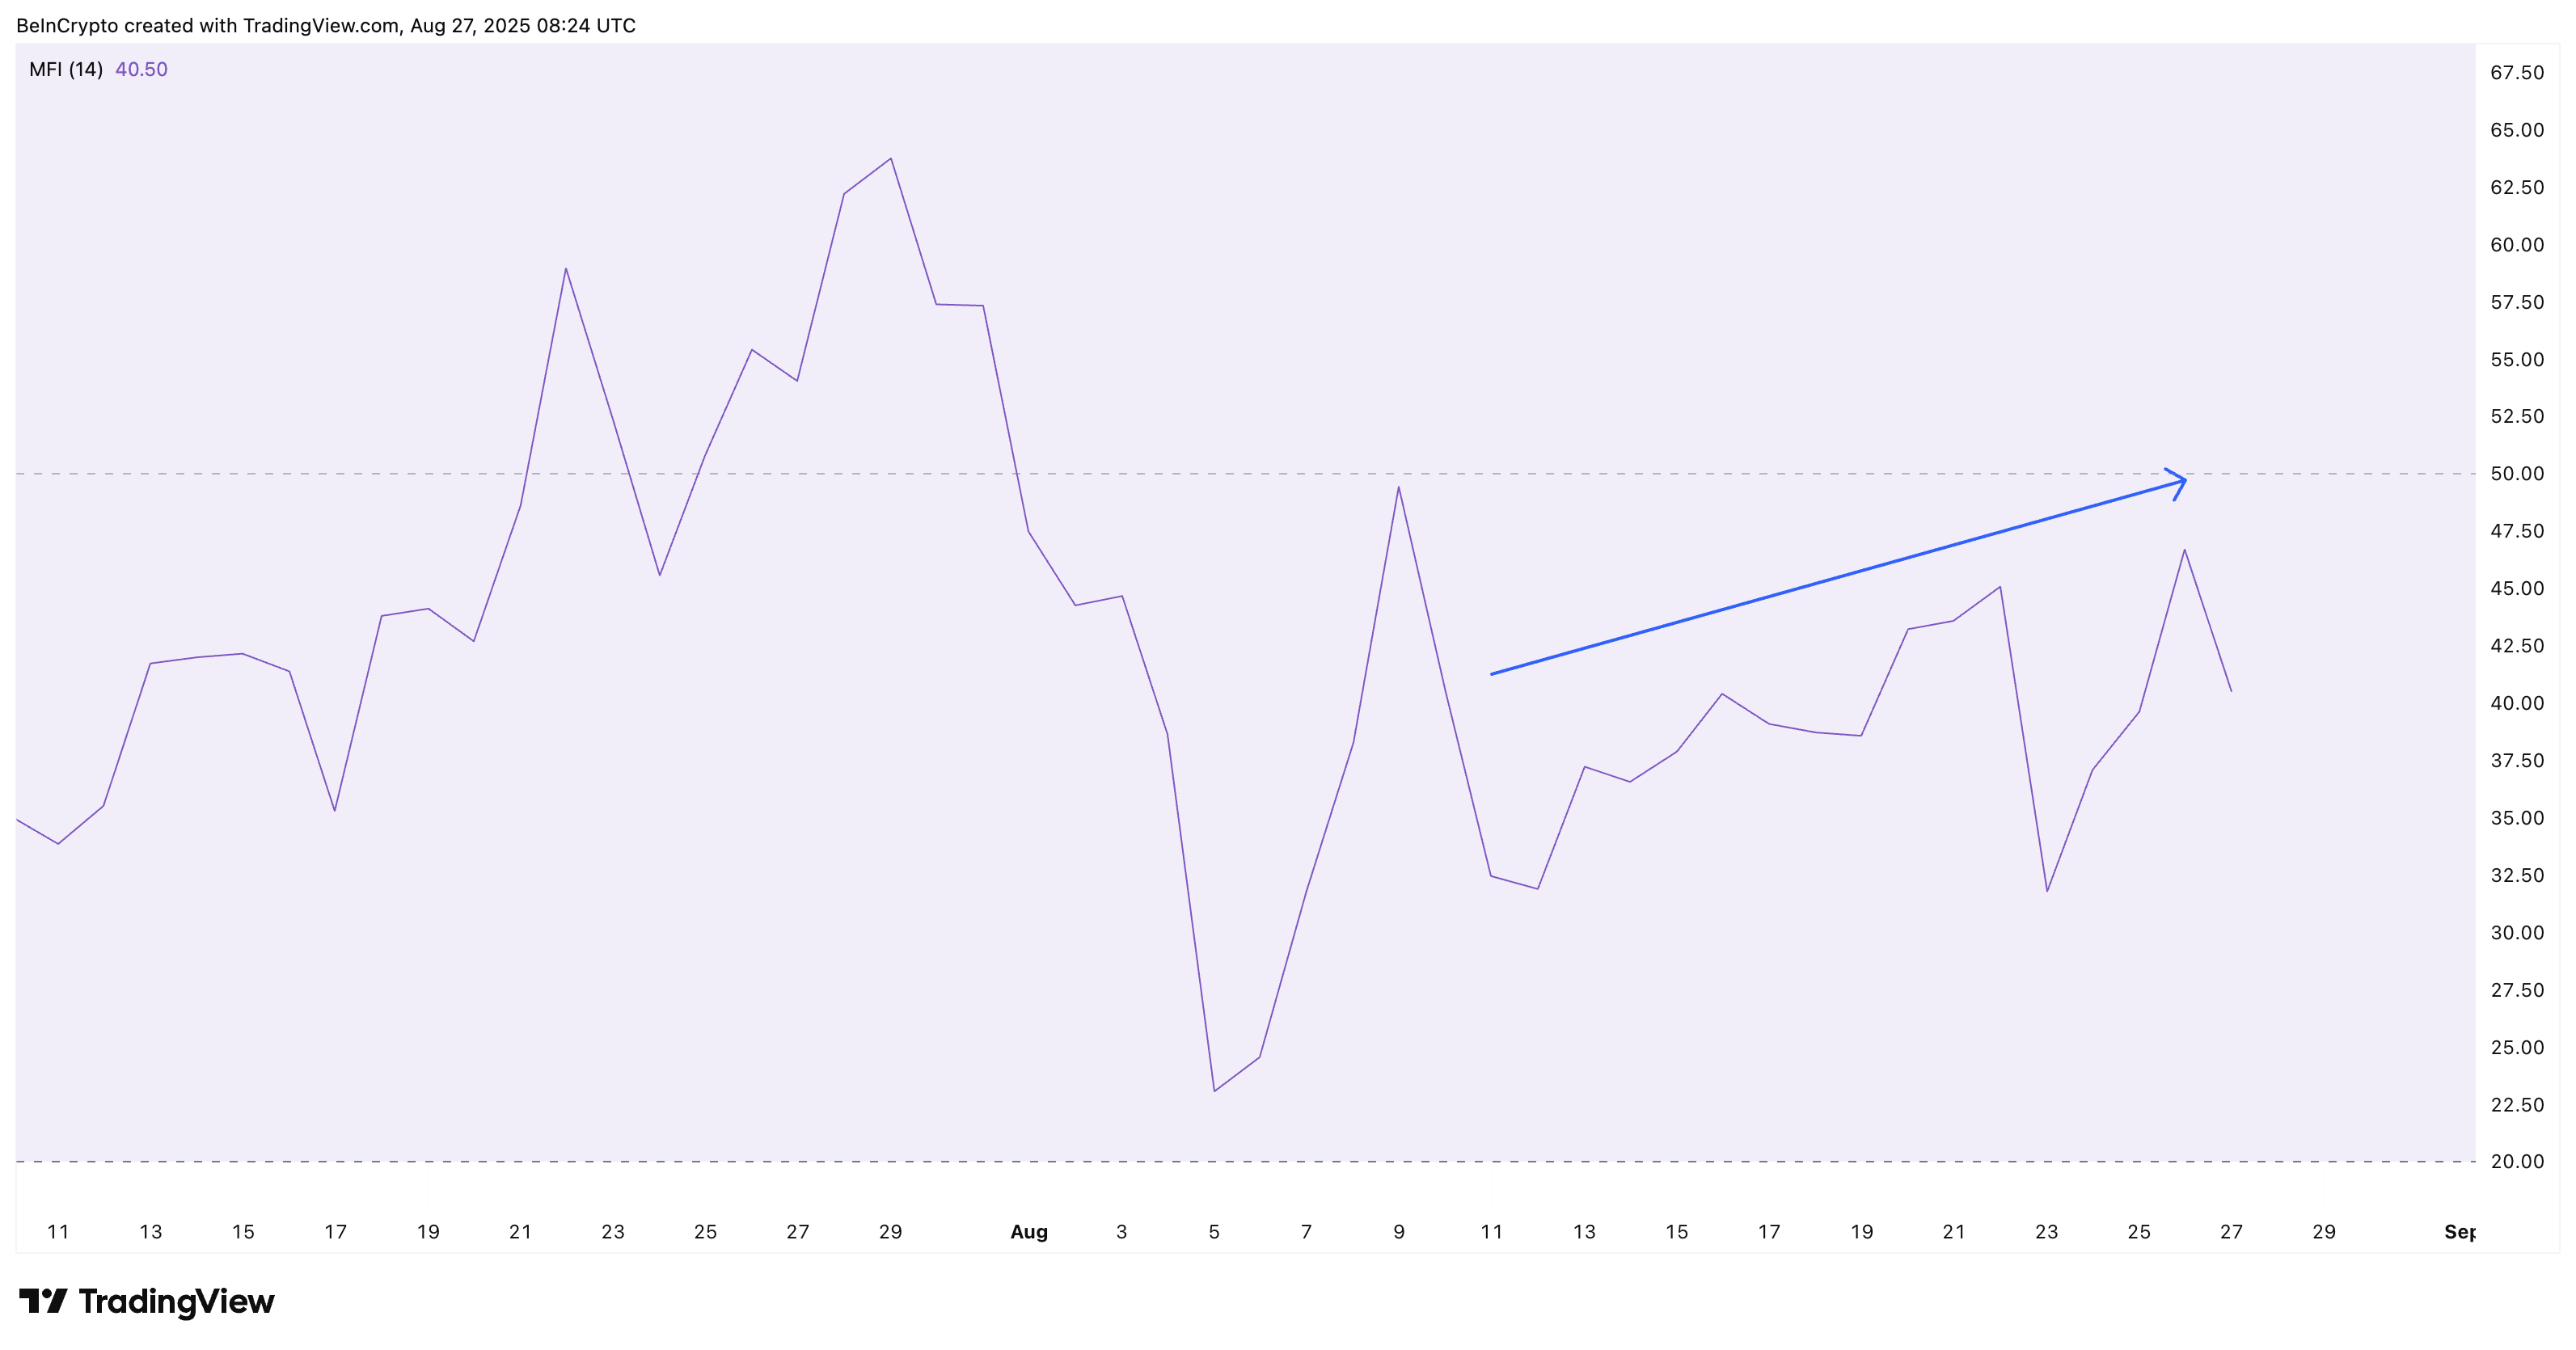
The Money Flow Index (MFI), which measures buying and selling pressure by combining price and volume, has been making higher highs since mid-August. This means that even as the price drifted lower, buyers kept putting in fresh capital — a sign of dip-buying activity.
 Pi Coin Buyers Continue To Buy The Dip:
TradingView
Pi Coin Buyers Continue To Buy The Dip:
TradingView
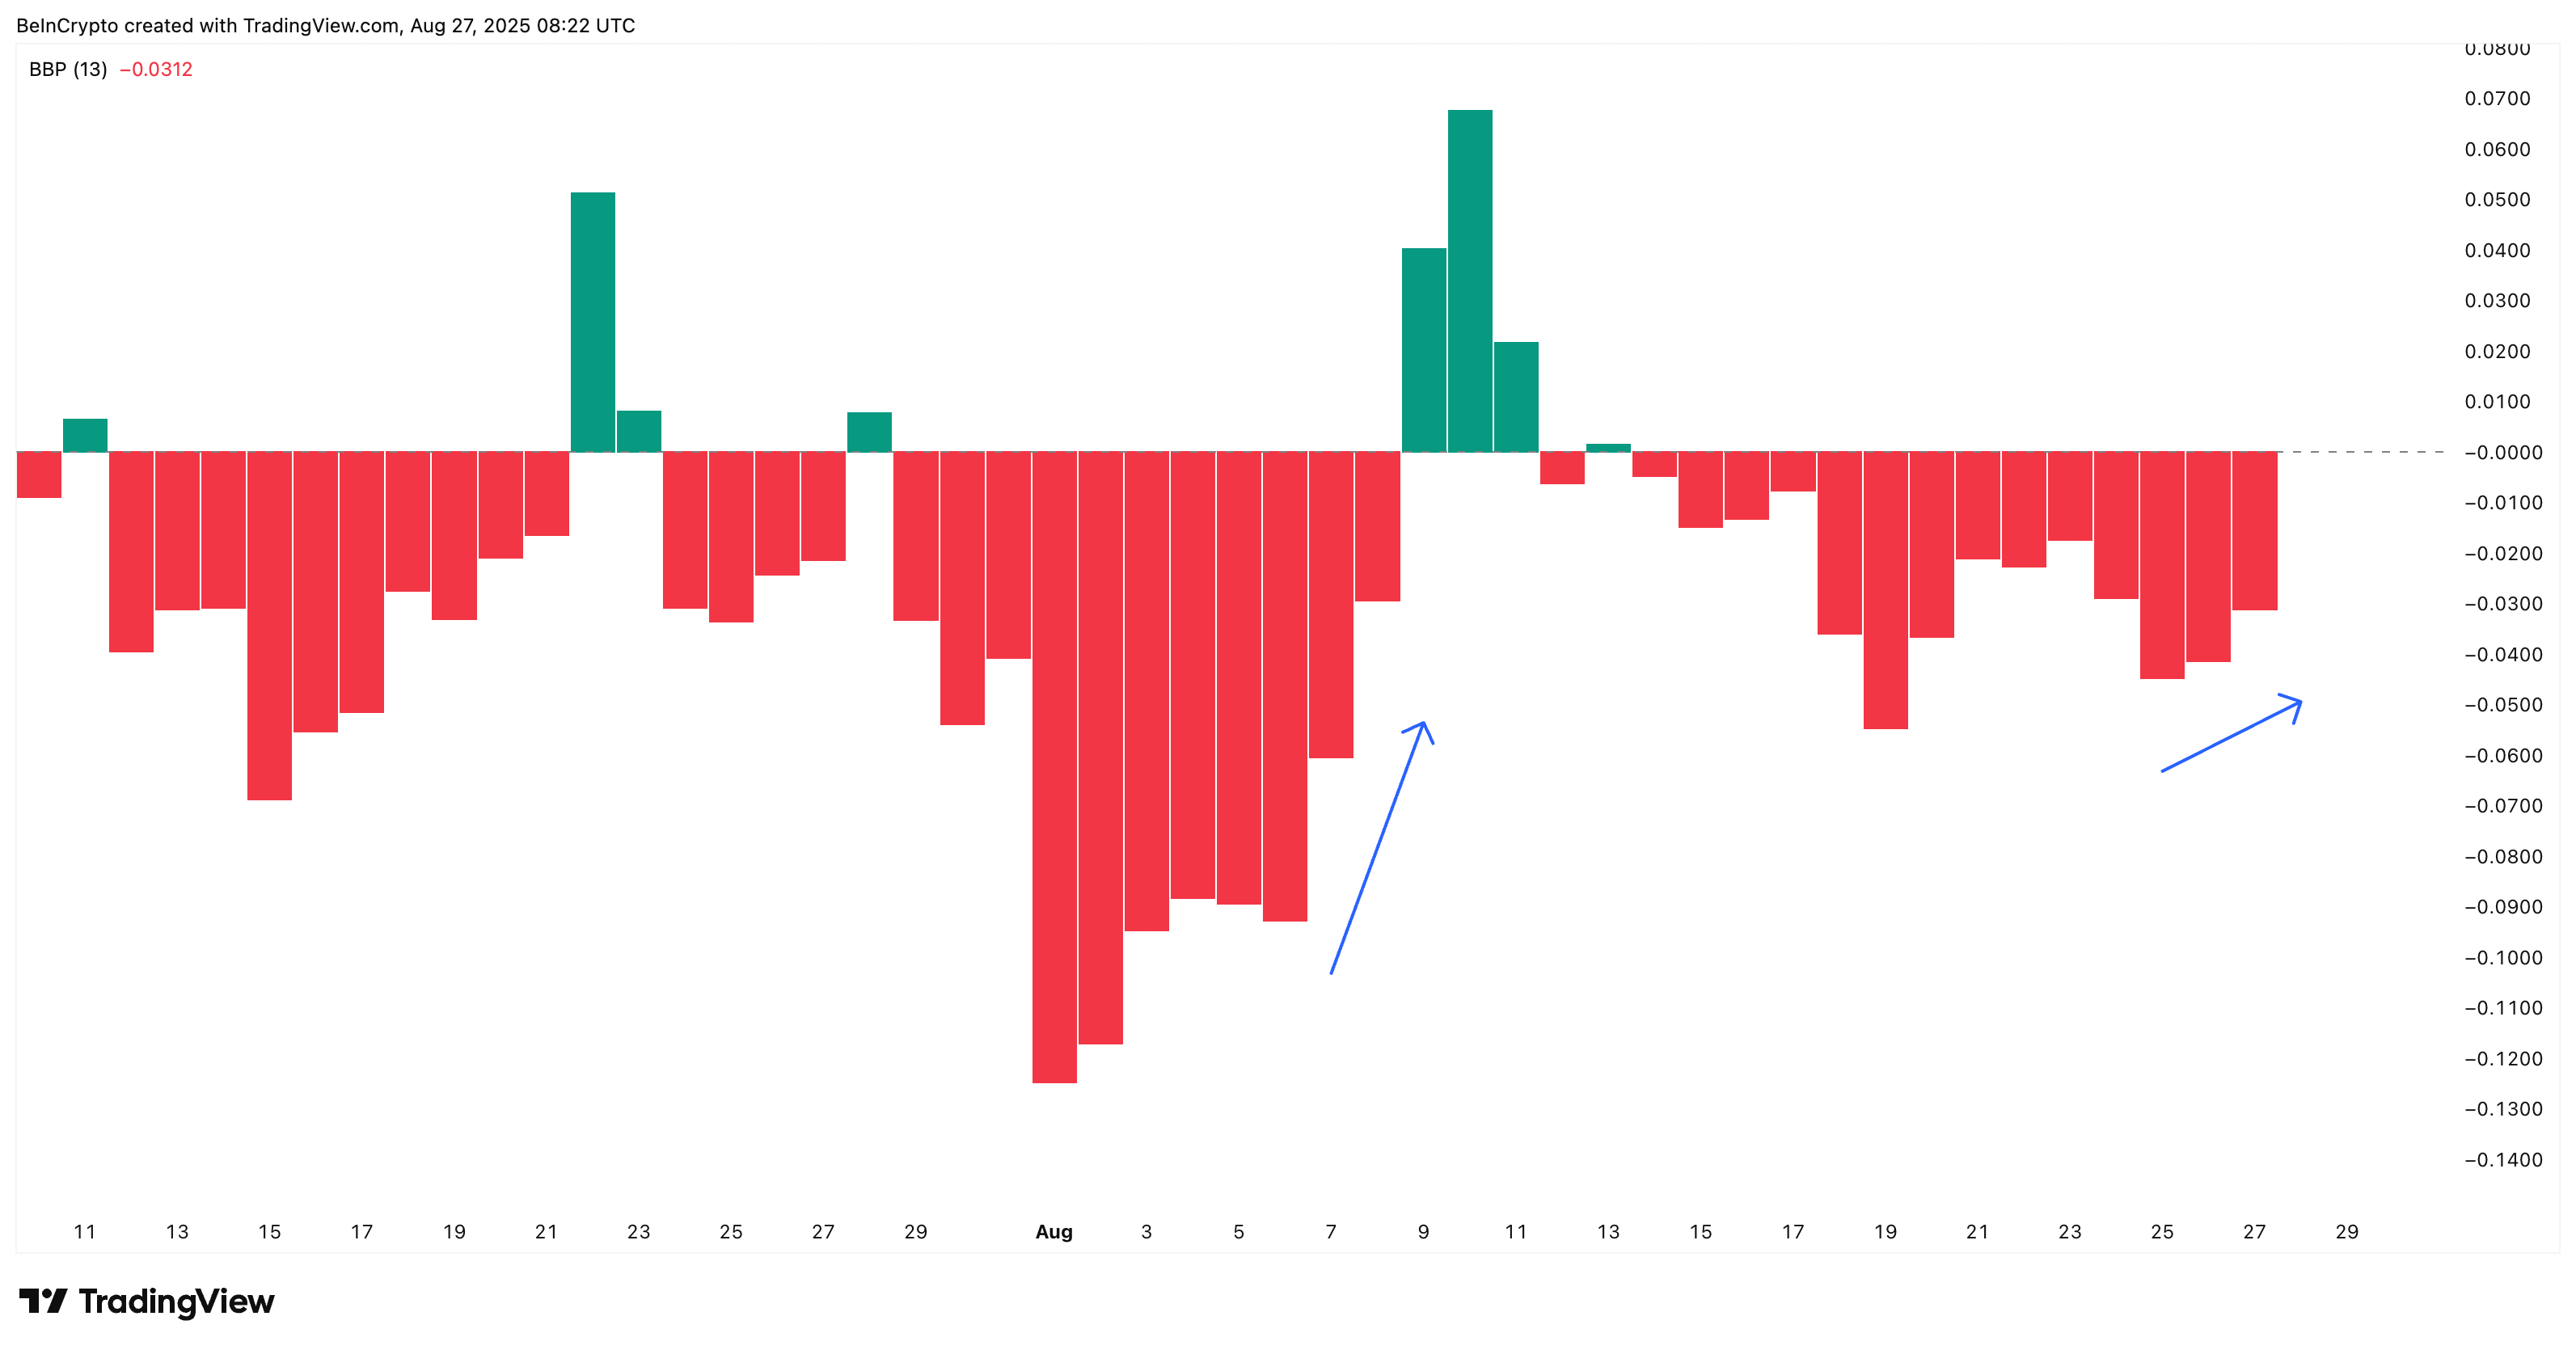
At the same time, the Bull/Bear Power index, which compares current price levels to moving averages, shows that bearish momentum has been fading.
 Fading Bearish Strength:
TradingView
Fading Bearish Strength:
TradingView
A similar drop in bearish strength earlier this month, during the RSI divergence phase, was followed by a short-lived but sharp rally to $0.46. Together, MFI and Bull/Bear Power add weight to the RSI divergence, pointing to a shift toward accumulation.
Key Levels to Watch for Pi Coin Price
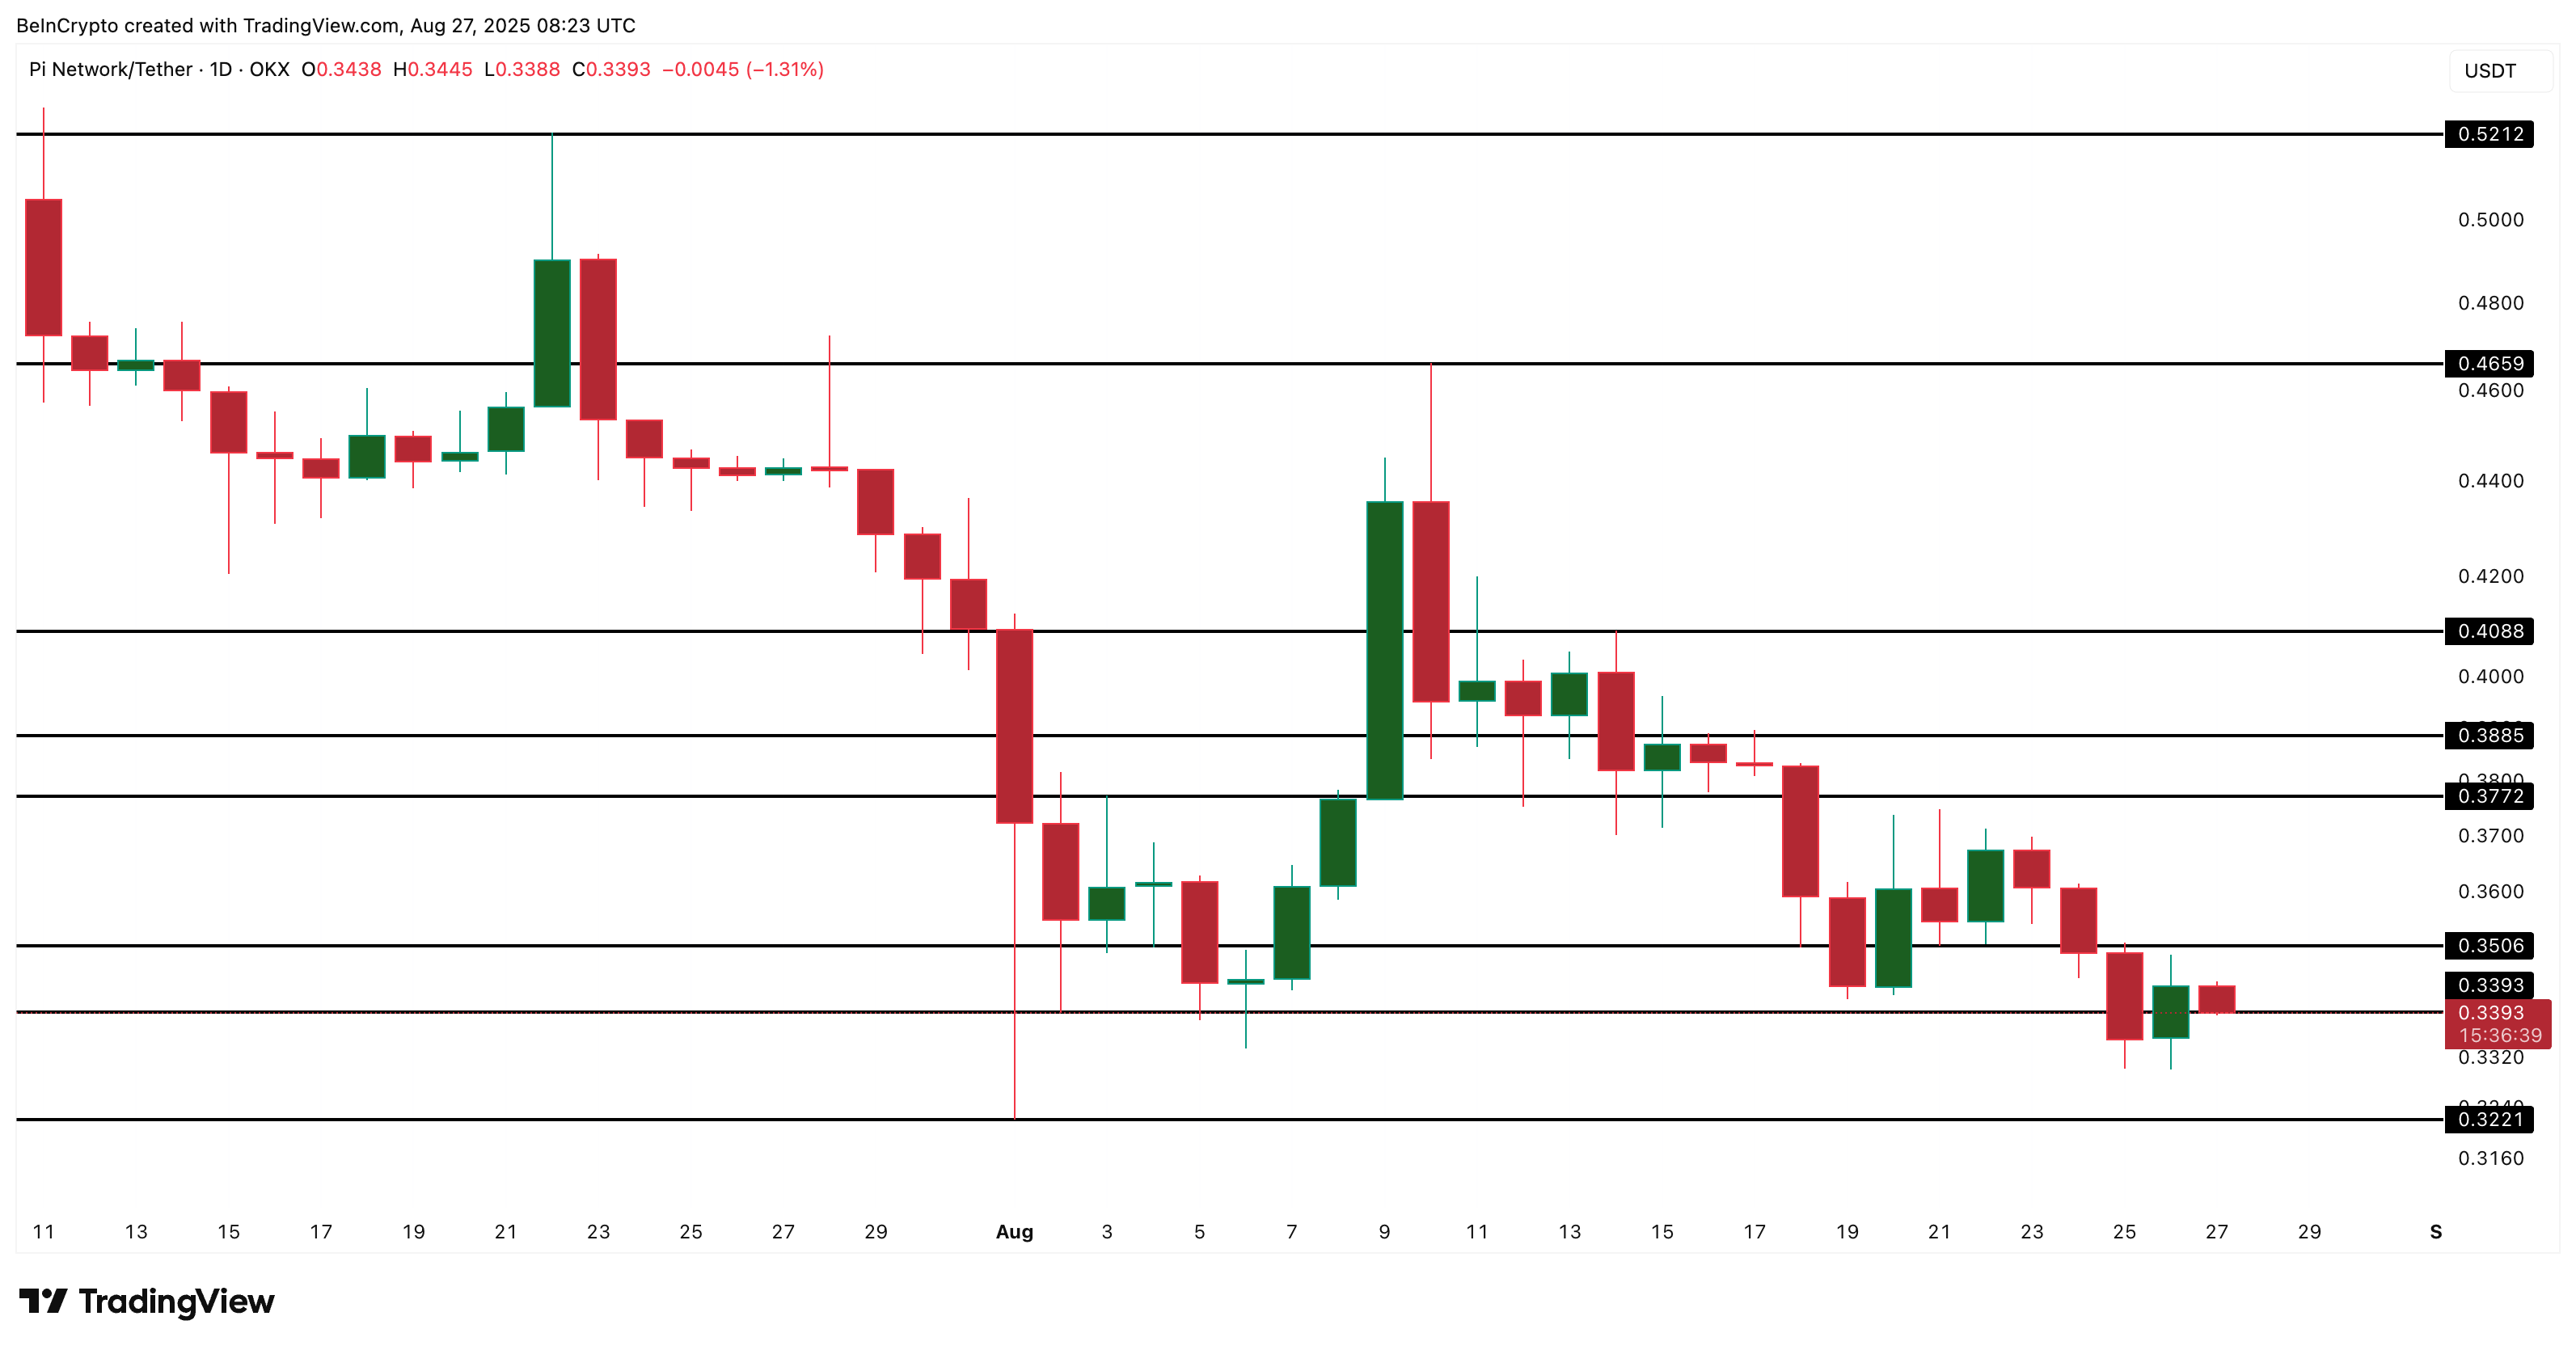
The PI price action also reflects this cautious optimism. Pi Coin recently held firm at $0.33, a key support area. If the bullish divergence plays out, the first major upside target sits at $0.46 — a level tested during the last divergence-driven rally. That would mark a gain of about 40% from current levels.
 Pi Coin Price Analysis:
TradingView
Pi Coin Price Analysis:
TradingView
However, some key short-term resistance levels, including $0.37 and $0.40, need to be scaled first.
If momentum stays strong, a stretch move toward $0.52 could also come into play, provided $0.46 is reclaimed. However, if Pi Coin falls under $0.32, the bullish setup would be invalidated, and the risks of fresh lows would rise.
Disclaimer: The content of this article solely reflects the author's opinion and does not represent the platform in any capacity. This article is not intended to serve as a reference for making investment decisions.
You may also like
As tech stocks plummet, Goldman Sachs issued a bullish report on US stocks, but after reading it, people became even more worried...
Goldman Sachs strategist Tony Pasquariello released a bullish report, stating that market breadth is "not as bad as reported." However, the report references the internet bubble twice for comparison. Behind the tactical bullishness lie multiple concerns such as slowing profits, a surge in stock supply, and quarterly crowded positions among the "Magnificent Seven."
Apple (AAPL.US) launches wall-mounted hub HomeView to enter the smart home market; analysts: may generate new income for the services segment
Apple launches a wall-mounted hub to enter the smart home market. Analysts say it may bring new revenue to the services segment, and a paid Siri AI is on the horizon.
U.S. IPO Preview|Primagrove: Soaring Performance with a 17-Fold Increase, but the $17,000 Cash Pool Raises Concerns
From software outsourcing to integrated software and hardware.
60% of stocks have fallen into a bear market, the seven tech giants are holding up the S&P alone! BTIG: US stocks may be just a "gentle push" away from collapsing
The S&P 500 is just one step away from its all-time high, but under the surface, turbulence is brewing: 60% of its components have already entered a technical bear market, and only 30% have outperformed the index, the lowest since 1991. All of this is being supported solely by the seven major tech giants—which is, in fact, the biggest risk. With crowded positions and the semiconductor sector mirroring the path of the 2000 bubble burst, an accelerated decline could be triggered during the upcoming earnings season at the end of the month. When the market is standing on just one final leg, it doesn't take much force to topple it.

Crypto prices
More


