Stellar (XLM) is consolidating around $0.37–$0.40 with $0.33 as a key accumulation support; a confirmed break above the $0.49747 neckline could target $0.62–$0.95 and possibly $1.29 if momentum continues.
-
$0.33 identified as the primary accumulation zone ahead of a potential breakout.
-
Inverse head-and-shoulders pattern sets a $0.49747 neckline; Fibonacci targets at $0.62, $0.75, $0.82 and extended to $0.95.
-
Analyst levels: $0.681 and $1.29 named as near- and extended-resistance; breakdown under $0.33 risks declines to $0.30–$0.26.
Stellar (XLM) price outlook: consolidation near $0.37–$0.40 with $0.33 support; watch $0.49747 neckline for breakout—read the analysis and trade levels.
Stellar (XLM) consolidates near $0.37–$0.40 as analysts note $0.33 support and targets stretching up to $1.29 in 2025.
- Analysts identify $0.33 as a key accumulation zone for Stellar before a possible breakout toward $1 and beyond.
- An inverse head and shoulders pattern sets $0.49747 as the neckline, with Fibonacci targets reaching $0.95.
- Javon Marks notes $0.681 and $1.29 as resistance levels, confirming Stellar’s structural change from its long bearish trend.
What is the current Stellar (XLM) price outlook?
Stellar (XLM) is trading near $0.37–$0.40, consolidating after earlier gains. Technical setups point to $0.33 as critical support and a $0.49747 neckline as the decisive breakout level; successful confirmation could push XLM toward $0.62–$0.95, with extended resistance at $1.29.
How is the inverse head-and-shoulders pattern shaping XLM’s targets?
The inverse head-and-shoulders began forming in late December 2024, with the head hitting its low in April–May 2025. The neckline at $0.49747 defines a clear breakout threshold. Fibonacci projections from the recovery mark $0.62, $0.75, $0.82 and an extended target near $0.95 if momentum persists.
Why is $0.33 considered the buy-the-dip level?
Multiple analysts highlight $0.33 as aligning with the 0.618 Fibonacci retracement and prior demand zones at $0.30131 and $0.33158. This cluster of support levels provides a technically significant accumulation area that could underwrite a renewed attempt at the neckline should buying interest re-emerge.
When would the neckline breakout confirm a trend reversal?
Confirmation requires a decisive daily close above $0.49747 on meaningful volume. A breakout followed by a retest of that level as support would validate the inverse head-and-shoulders and open Fibonacci targets in sequence: $0.62, $0.75, $0.82, then $0.95, with extended upside toward $1.29 according to analyst scenarios.
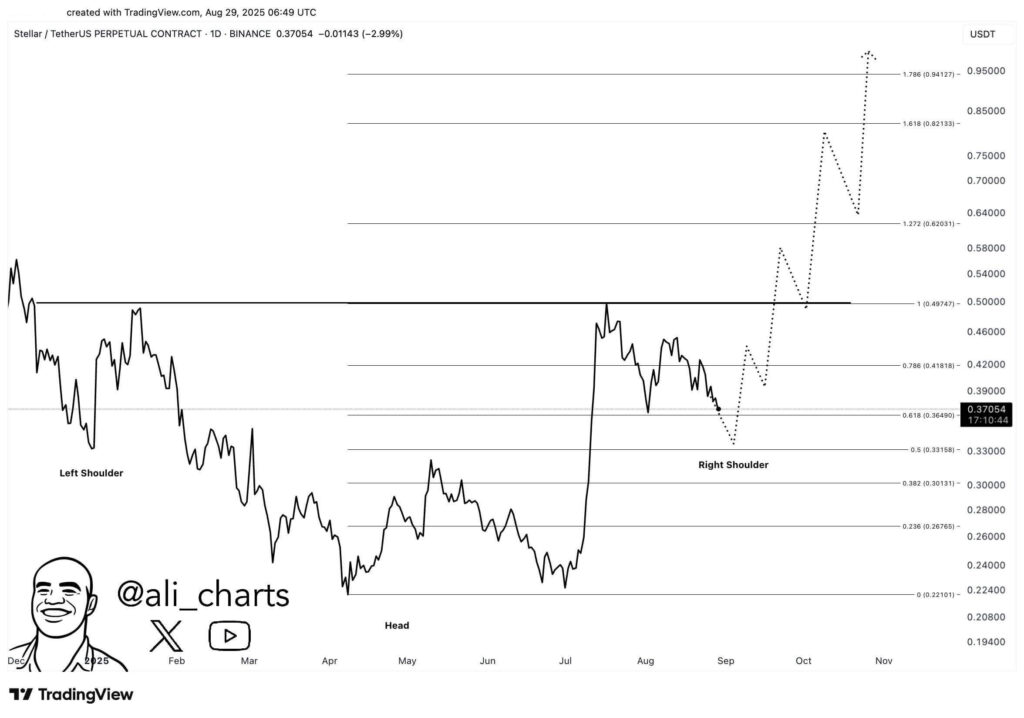
XLM/USDT perpetual Contract 1-day price chart, Source: Ali on X
How should traders manage risk around key levels?
Risk management should focus on the $0.33 support band and a confirmed breakout above $0.49747. Use tight position sizing if price approaches $0.33 with protective stops below $0.30 to limit downside. Conversely, consider scaling targets at each Fibonacci level and trimming exposure near $0.62, $0.75 and $0.95.
What did analysts and experts say?
Analyst Javon Marks noted a structural shift after the multi-year descending trend reversed, pointing to a higher low and volume-backed rallies. Market commentators on X highlighted $0.33 as the buy-the-dip pivot and identified $0.681 and $1.29 as key resistance milestones on a sustained breakout.
Frequently Asked Questions
What are the immediate targets if XLM breaks the neckline?
If XLM closes above $0.49747, short-term Fibonacci targets are $0.62 and $0.75, with $0.82 and $0.95 as medium-term objectives; extended scenarios list $1.29 as a longer-term resistance level.
How should I trade around $0.33 support?
Use $0.33 as an accumulation zone with strict risk controls: consider small position entries and stops below $0.30, scaling up only if price shows strength and volume at higher levels.
Key Takeaways
- Support band: $0.33 is the central accumulation area backed by Fibonacci confluence.
- Breakout trigger: $0.49747 neckline confirmed on volume opens paths to $0.62–$0.95 and higher.
- Risk management: Failure below $0.33 risks declines to $0.30–$0.26; use stops and scaled targets.
Conclusion
Stellar (XLM) shows a constructive technical structure with a clearly defined support band around $0.33 and a decisive neckline at $0.49747. Traders should monitor volume and retest behavior for confirmation while managing downside risk below $0.30. COINOTAG will track updates and on-chain signals as the setup evolves.