
Hedera (HBAR) Price Eyes New Lows Despite Major Whale Buying Actions

HBAR price is sliding toward new lows, with whale accumulation failing to offset technical bearish signals.
Hedera (HBAR) has been under pressure through late August, extending its losing streak into September. On a monthly view, the HBAR price has dropped by 8.8%, continuing a downtrend that has persisted since mid-August. This correction comes after a massive rally earlier in the year, when HBAR climbed more than 350% — momentum that now feels like a distant memory.
Despite the weakness, some large holders have begun quietly adding to their positions, signaling that not all players are bearish. However, technical indicators suggest caution.
Whales Accumulate Over $11 Million In HBAR
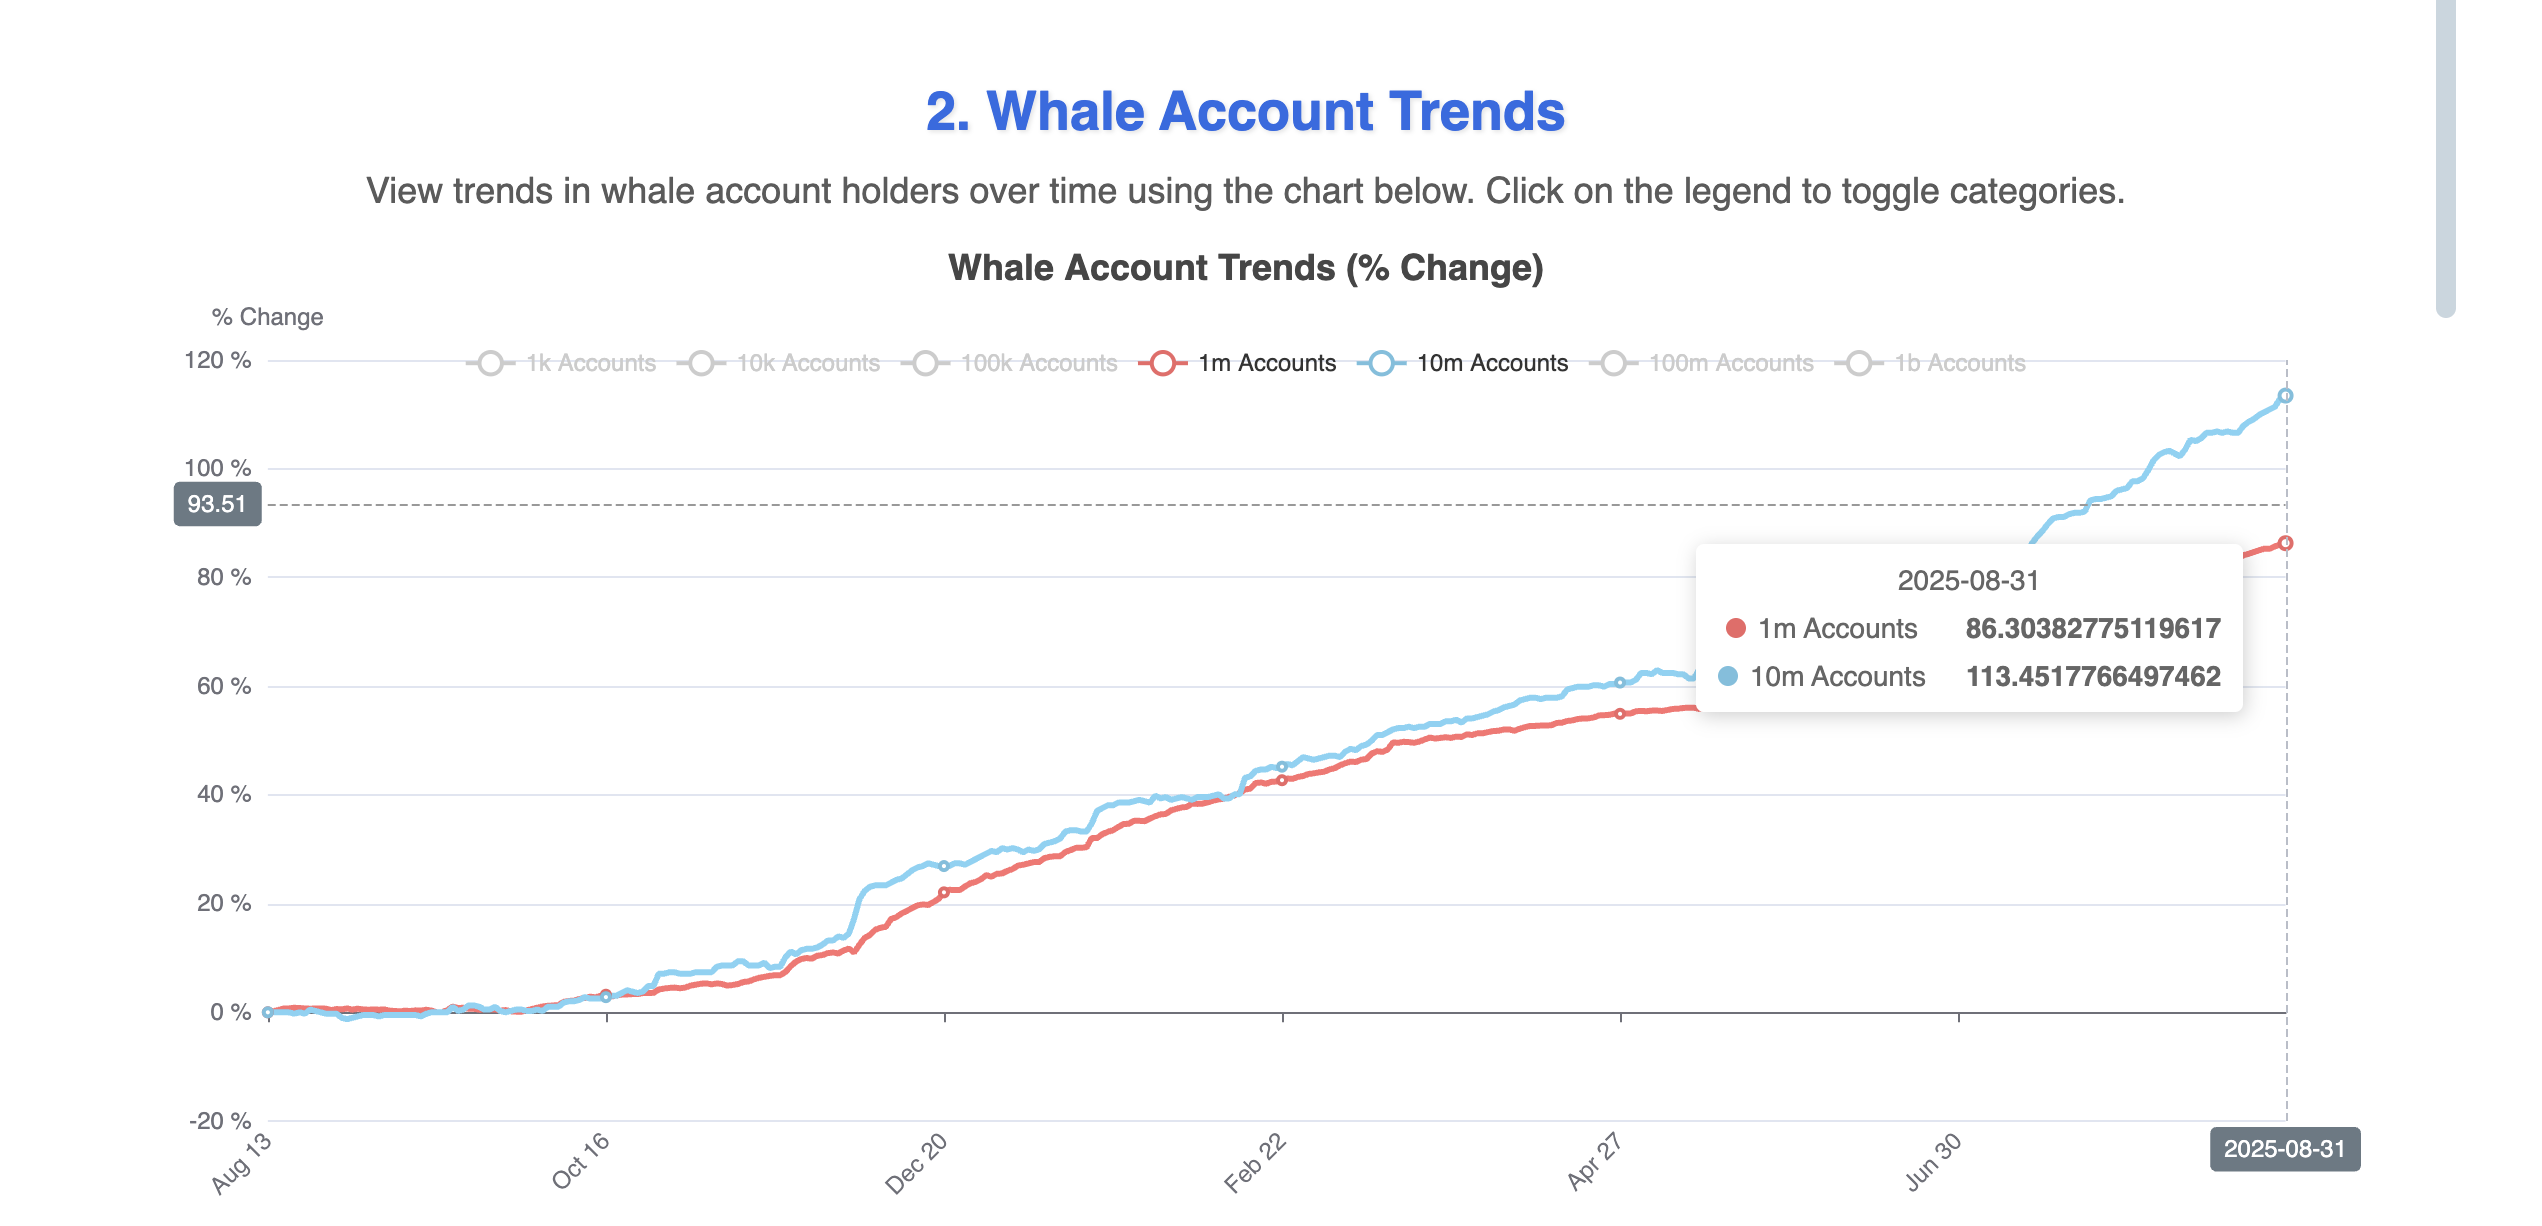
On-chain data shows that whales have been steadily accumulating Hedera, even as the token’s price trends lower. Over the past week, two key cohorts — wallets holding at least 1 million and 10 million HBAR — have added notably to their balances.
The 1 million HBAR cohort increased from 84.33 to 86.30 accounts, indicating an addition of at least 1.97 million tokens, valued at approximately $445,000 at the current price of $0.226. The 10 million HBAR cohort increased from 108.62 to 113.45 accounts, translating into at least 48.3 million tokens, worth approximately $10.92 million.
 HBAR Whales Keep Buying Dips:
Hedera Watch
HBAR Whales Keep Buying Dips:
Hedera Watch
In total, whales have acquired more than 50 million HBAR, valued at nearly $11.36 million, over the past week. This steady buying suggests that large investors remain committed despite the Hedera price’s month-long downtrend.
But whale accumulation does not always translate to immediate price gains. Retail traders, who often dominate short-term flows, may still be selling. That is where technical signals, such as the RSI divergence, provide important context.
Want more token insights like this? Sign up for Editor Harsh Notariya’s Daily Crypto Newsletter
Hidden Bearish Divergence Clouds Outlook
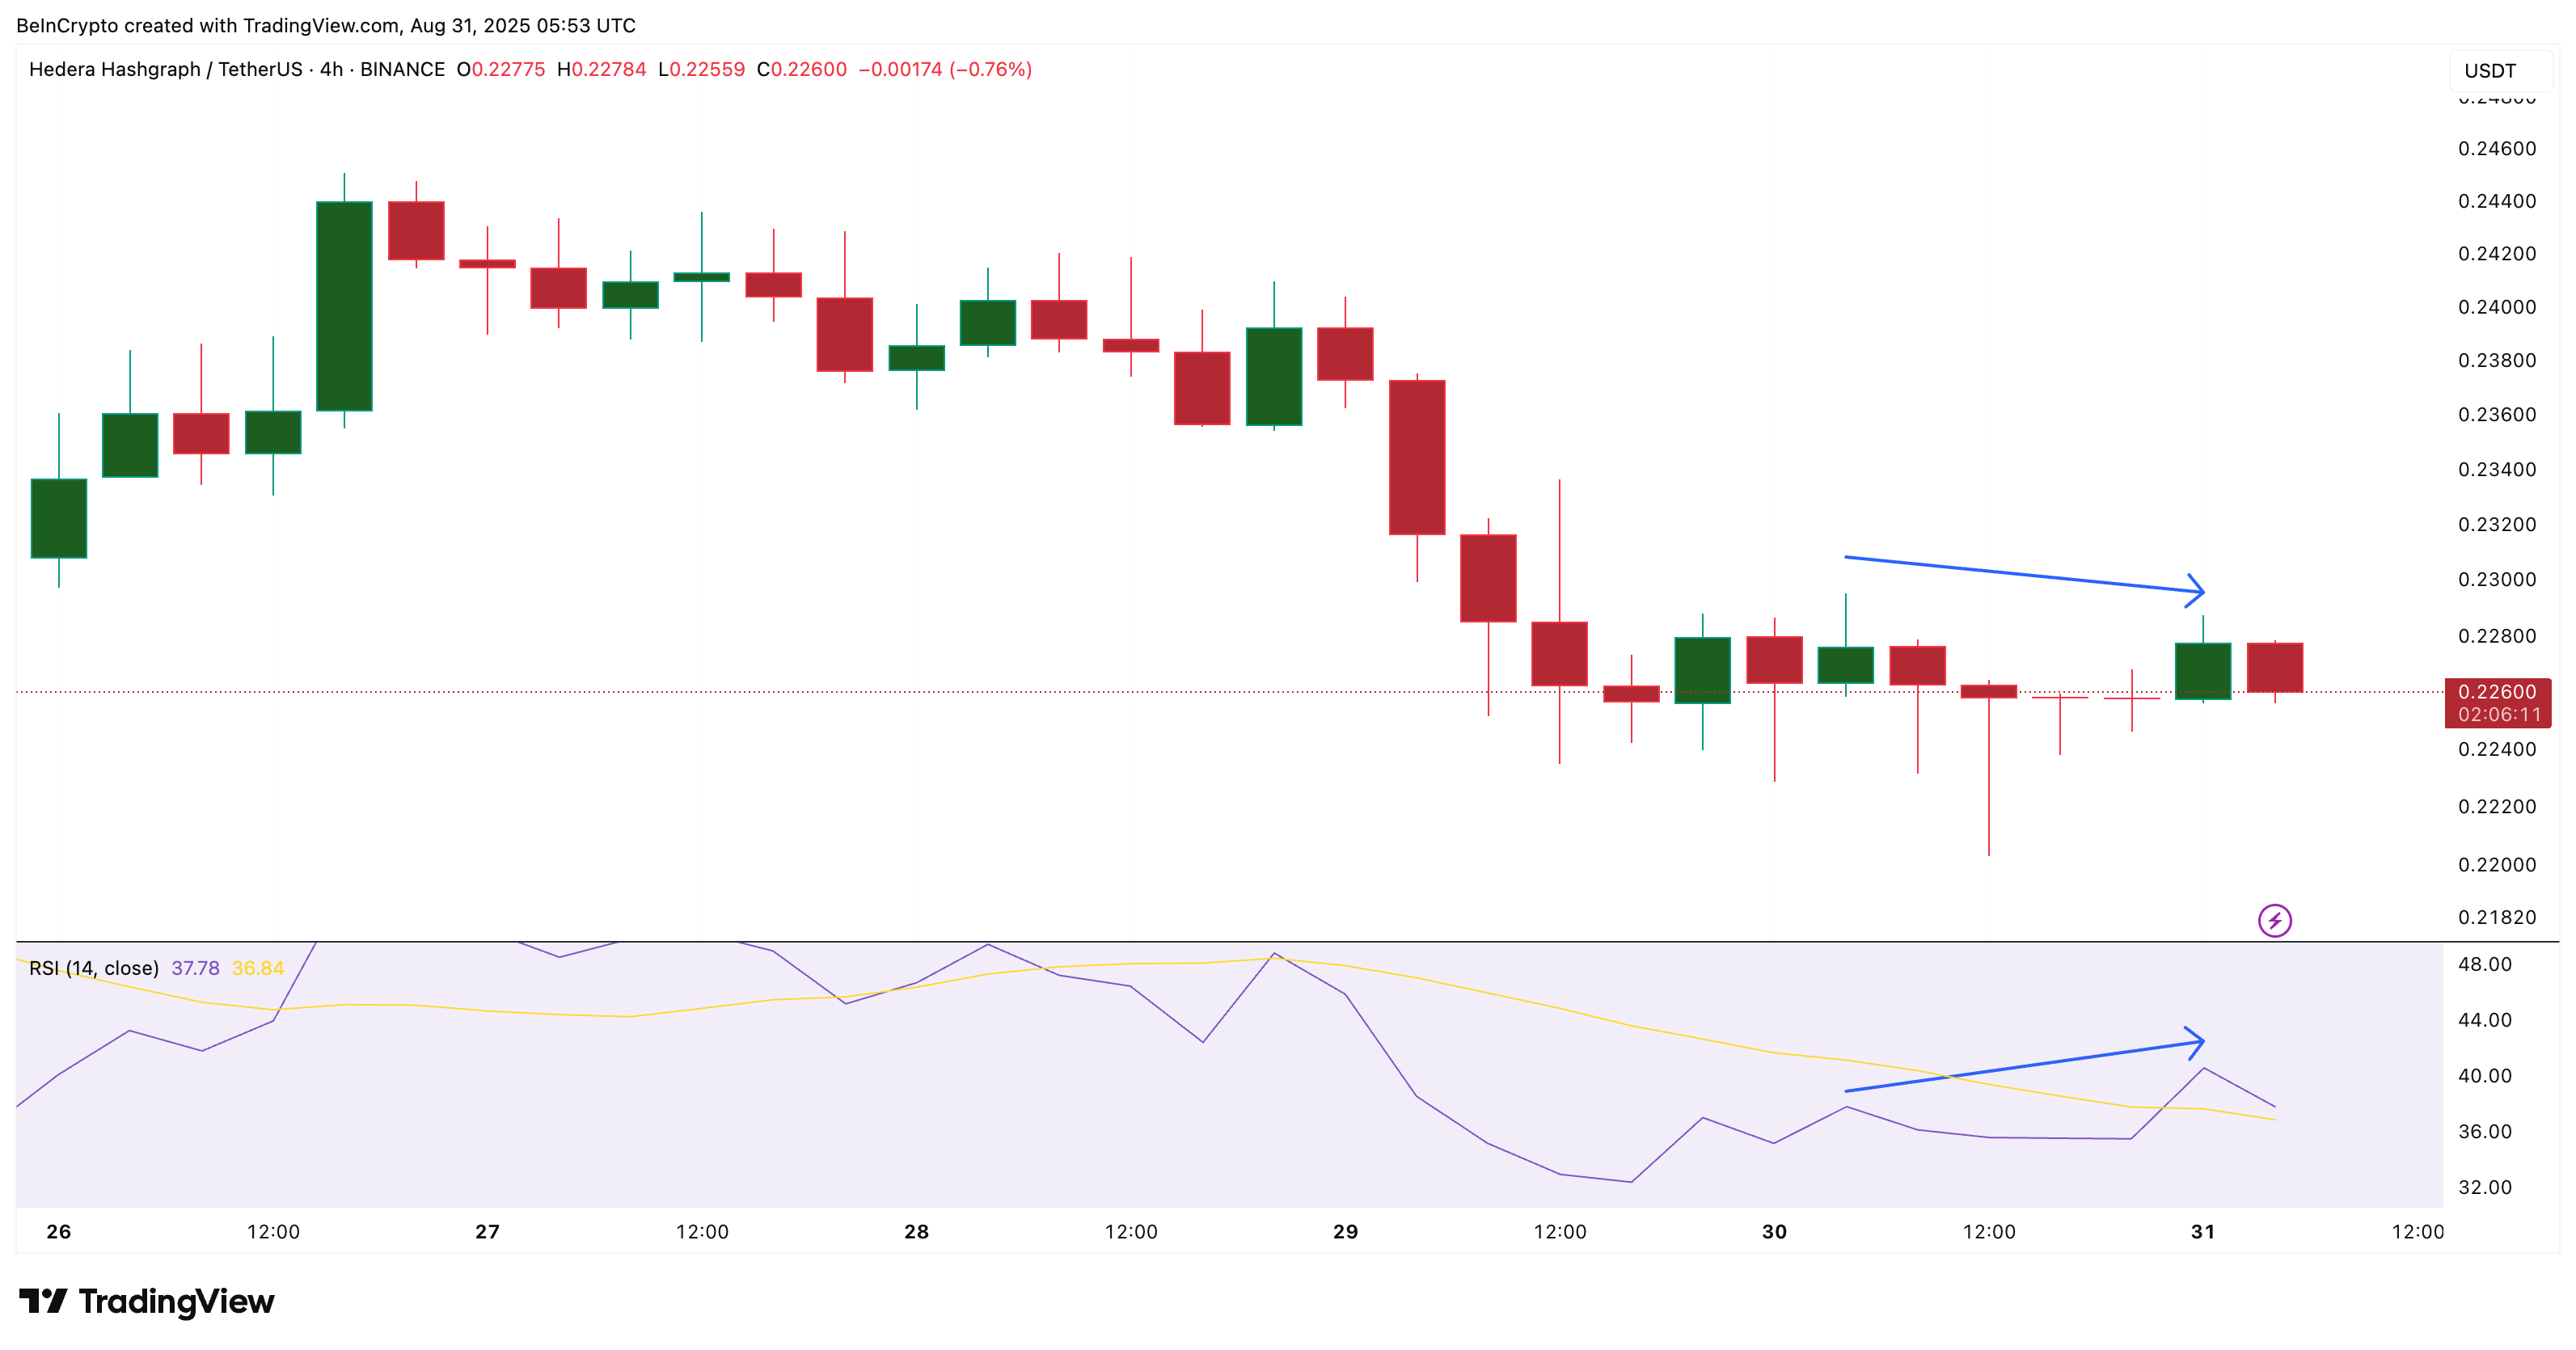
The Relative Strength Index (RSI) is a momentum indicator that measures whether an asset is overbought or oversold. Divergences between price action and RSI often provide early warning signals.
 HBAR Price And RSI Divergence:
TradingView
HBAR Price And RSI Divergence:
TradingView
On the 4-hour chart, HBAR has formed a hidden bearish divergence: while price has made lower highs, RSI has printed higher highs. This pattern typically suggests that selling pressure remains in control, even if momentum indicators look stronger on the surface.
In practice, it means that despite whales adding millions of tokens, the underlying trend remains tilted toward weakness, possibly due to retail-centric selling pressure.
This divergence reinforces the risk that the HBAR price could continue sliding, particularly if retail selling outweighs whale accumulation. It shows that while whales may be clinging to optimism after HBAR’s massive rally earlier this year, momentum in the near term remains fragile.
Hedera (HBAR) Price Levels Highlights Risk
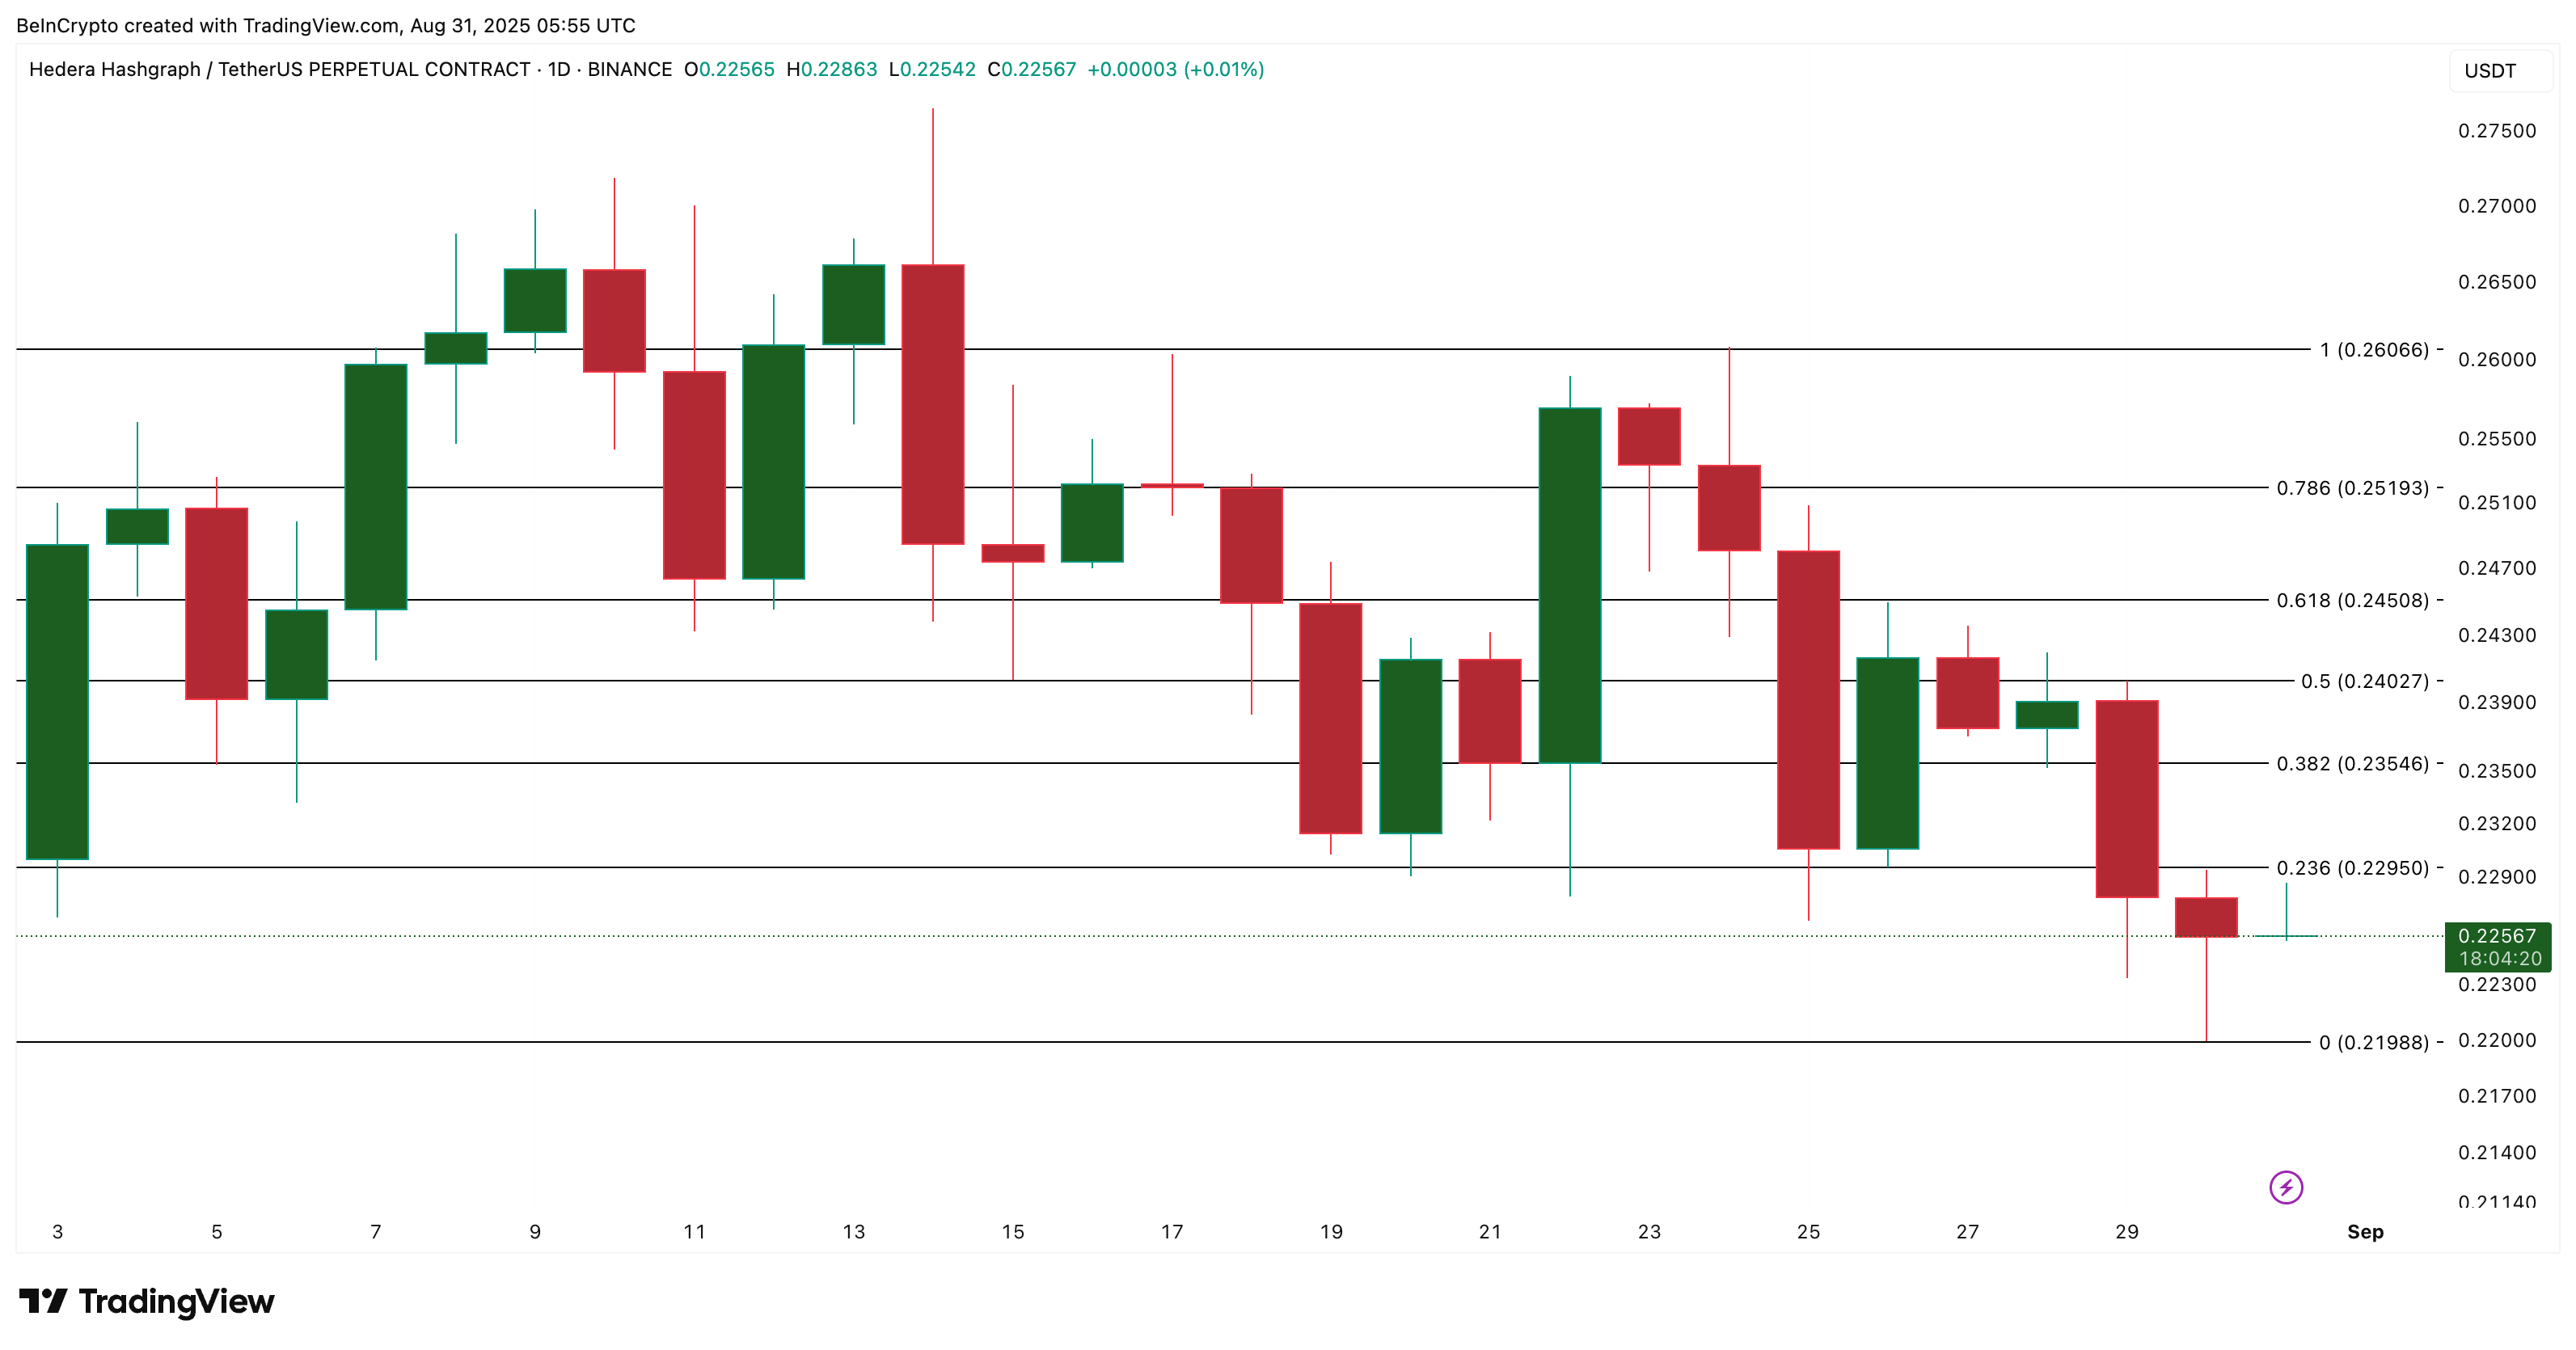
The daily HBAR price chart highlights the critical levels that will define HBAR’s path in the coming days. The immediate support to watch is at $0.219. A decisive daily close below this level would expose the price to deeper losses and confirm the continuation of the month-long downtrend.
 HBAR Price Analysis:
TradingView
HBAR Price Analysis:
TradingView
On the upside, reclaiming $0.240 would help neutralize the bearish bias, while a sustained move above $0.260 would mark a full trend reversal. Until those levels are broken, the broader structure remains vulnerable.
Disclaimer: The content of this article solely reflects the author's opinion and does not represent the platform in any capacity. This article is not intended to serve as a reference for making investment decisions.
You may also like
Fed Voting Member Harker: Fighting Inflation Requires Faster, More Frequent Small Rate Adjustments, Be Vigilant Against Inflation Expectations Becoming Entrenched
Cleveland Federal Reserve President Loretta Mester believes that inflation pressures have spread beyond the energy sector, with AI investments and tariffs driving up costs. To prevent high inflation from becoming entrenched in the economy, she suggests that the Federal Reserve should consider smaller, quicker, and more frequent rate adjustments, rather than waiting for inflation pressures to accumulate and then taking larger actions. She did not explicitly support an interest rate hike in October, emphasizing policy transparency: explaining the response mechanism does not equate to committing to a specific rate path.
Will the US cancel 20-year Treasury bonds? BNP Paribas: It may trigger market panic; Citibank: Positioning 20-year bonds to outperform 10-year bonds
There are market rumors that the U.S. Treasury is considering cutting back or canceling the issuance of 20-year Treasury bonds, which were reinstated in 2020. The yield on 20-year bonds has long been higher than both 10-year and 30-year bonds, resulting in a "hump" in the yield curve and higher financing costs. The market is closely watching this Friday’s routine survey questionnaire, as well as whether a clear signal will be released in the quarterly refunding statement on November 4. Citi suggests positioning in advance, but BNP Paribas warns that such a move could be interpreted as a panic signal that policy tools have been exhausted.

Bitcoin price volatility accompanies a 6% drop as sentiment turns neutral
WF stock trades at $36, up 196.78%, with daily RSI at 97.86
Crypto prices
More


