XRP price at $2.81 remains confined to the lower half of its Bollinger Bands, signaling consolidation rather than a clear bullish breakout. The weekly mid-line near $2.60 is holding as support; a break below $2.50 would increase downside risk while a sustained close above $3.46 would confirm renewed upside momentum.
-
XRP price confined to lower Bollinger Bands
-
Weekly mid-line $2.60 acts as key support; upper band at $3.46 resists rallies
-
Daily range $2.70–$2.90 with lower-bound tests; monthly expansion peaked earlier in the year
Meta description: XRP price update: Bollinger Bands show consolidation around $2.81; monitor $2.60 support and $3.46 resistance for next directional move. Read analysis now.
What is XRP’s current technical outlook?
XRP price is consolidating near $2.81 and remains in the lower half of the Bollinger Bands, indicating limited upside conviction. Weekly support sits at the mid-line near $2.60, while failure below $2.50 would increase downside probability; a decisive push above $3.46 would be needed to restore bullish momentum.
How are Bollinger Bands diagnosing XRP momentum?
On the weekly chart the Bollinger mid-line at $2.60 has repeatedly contained declines, keeping price below the upper band at $3.46. The bands expanded dramatically earlier this year as XRP rallied from under $1, signaling high volatility, but now bands have contracted as candles sit closer to the middle, which signals consolidation rather than trend continuation.
Why is the daily frame important for short-term traders?
The daily chart shows most closes below the average, with price boxed between $2.70 and $2.90. Repeated tests of the lower boundary highlight short-term selling pressure. Intraday reversals toward the mid-band have lacked follow-through, suggesting momentum is weak until buyers push and sustain closes above the mid-line.
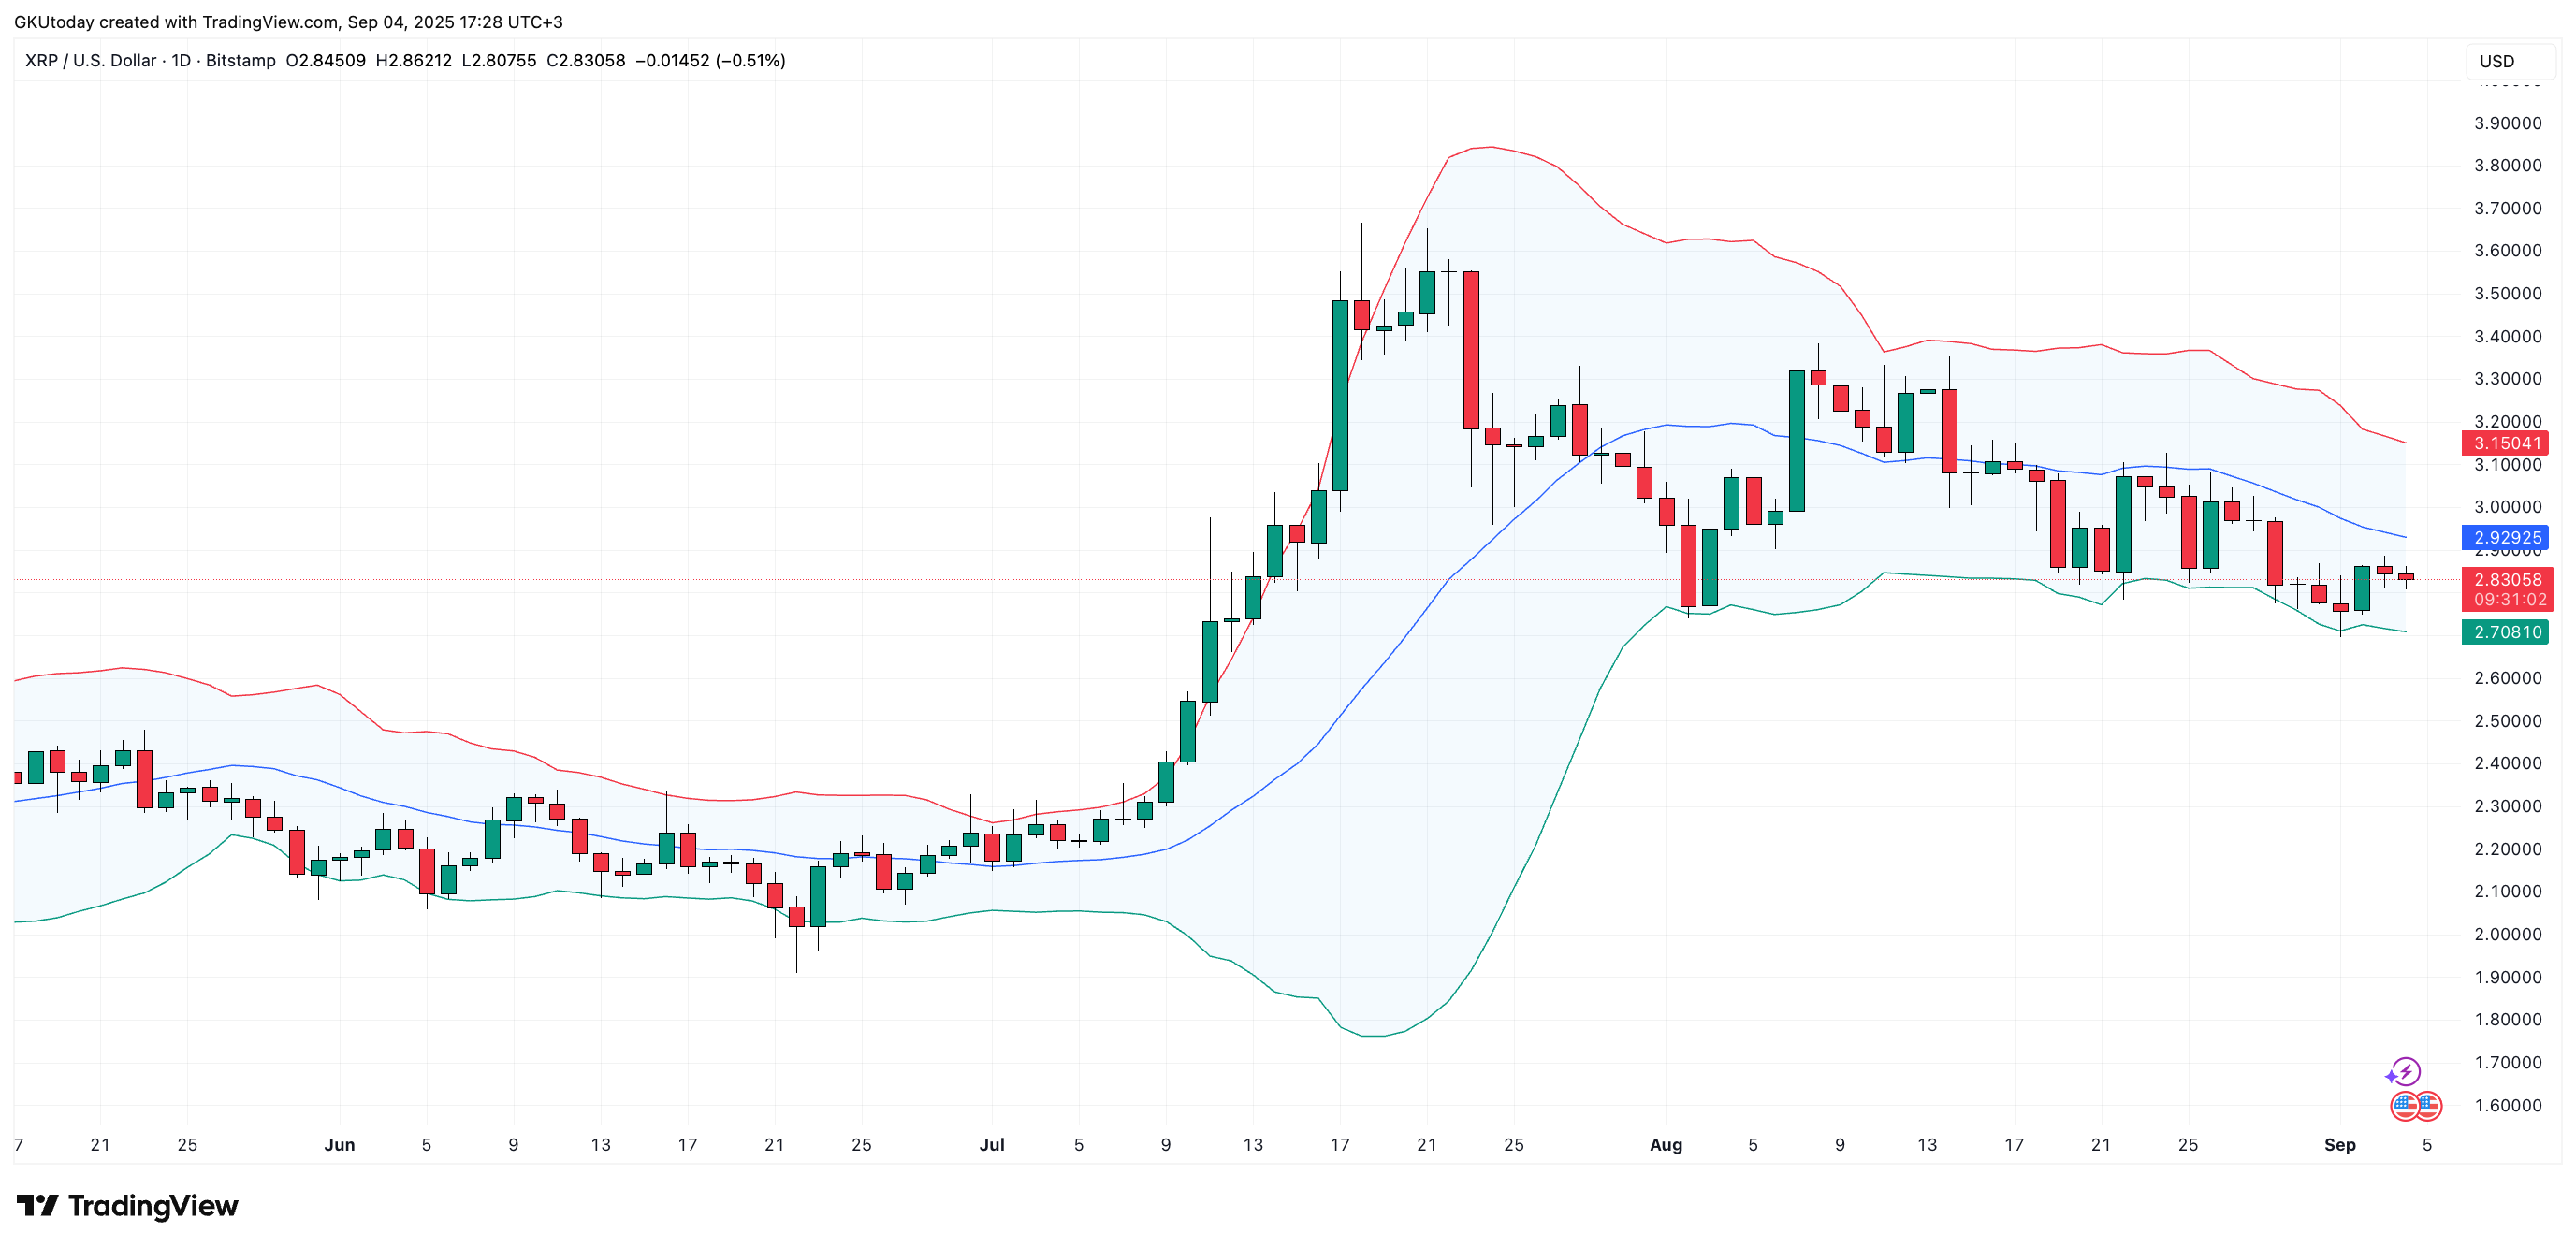 Source: TradingView
When could XRP resume a bullish trend?
For a credible bullish continuation, XRP needs to flip the weekly mid-line into support with several consecutive closes above $2.60 and a confirmed breakout above the upper Bollinger boundary near $3.46. Until that occurs, chart structure favors range-bound trades and downside risk to the $2.50 area if $2.60 gives way.
How to interpret the key levels for XRP (summary table)
| Current price | $2.81 | Trading in lower band; consolidation |
| Weekly mid-line | $2.60 | Immediate support; momentum pivot |
| Upper Bollinger band | $3.46 | Key resistance for bullish confirmation |
| Near-term downside | $2.50 | Next likely support if $2.60 breaks |
Frequently Asked Questions
How likely is a move below $2.50 for XRP?
Short-term probability rises if the weekly mid-line at $2.60 fails as support. Multiple daily lower-bound tests increase the chance of a drop to $2.50, but confirmation requires daily closes below $2.60 and growing selling volume.
What would confirm a bullish breakout for XRP?
A series of daily and weekly closes above the Bollinger upper band near $3.46, accompanied by rising volume and expanding bands, would confirm renewed bullish momentum and end the current consolidation phase.
Key Takeaways
- Range-bound action: XRP is trading in the lower half of Bollinger Bands, reflecting consolidation.
- Critical levels: $2.60 weekly mid-line as pivot; $3.46 upper band as resistance; $2.50 next downside support.
- Trader action: Favor range management and wait for confirmed closes above $3.46 for trend bias shift.
Conclusion
The technical picture for XRP price remains cautious: consolidation within the lower Bollinger Bands suggests limited upside until the weekly mid-line is decisively reclaimed and the upper band at $3.46 is breached. Track volume and band expansion for the next directional clue; COINOTAG will monitor updates and provide follow-up analysis.