
SOMI Chart Shows Smart Trading Indicators Pointing to $1.53 — Another Rally Next?

SOMI price hovers near $1.30, with smart money signals and hidden RSI divergence hinting at a rebound setup. A breakout above $1.53 could shift momentum into a full rally.
SOMI’s price trades near $1.30, up almost 5% in the past 24 hours and 10% over the week. But don’t let those short-term gains fool you. The token has been correcting and rebounding sharply within small windows.
Just yesterday, the Somnia price briefly crossed $1.53 before pulling back, yet it still shows daily gains. That kind of movement reflects persistent selling pressure, but on-chain signals and chart patterns are now flashing rebound signs — the kind that smart traders usually watch.
Smart Money and Bulls Keep Rebound Hypothesis Alive
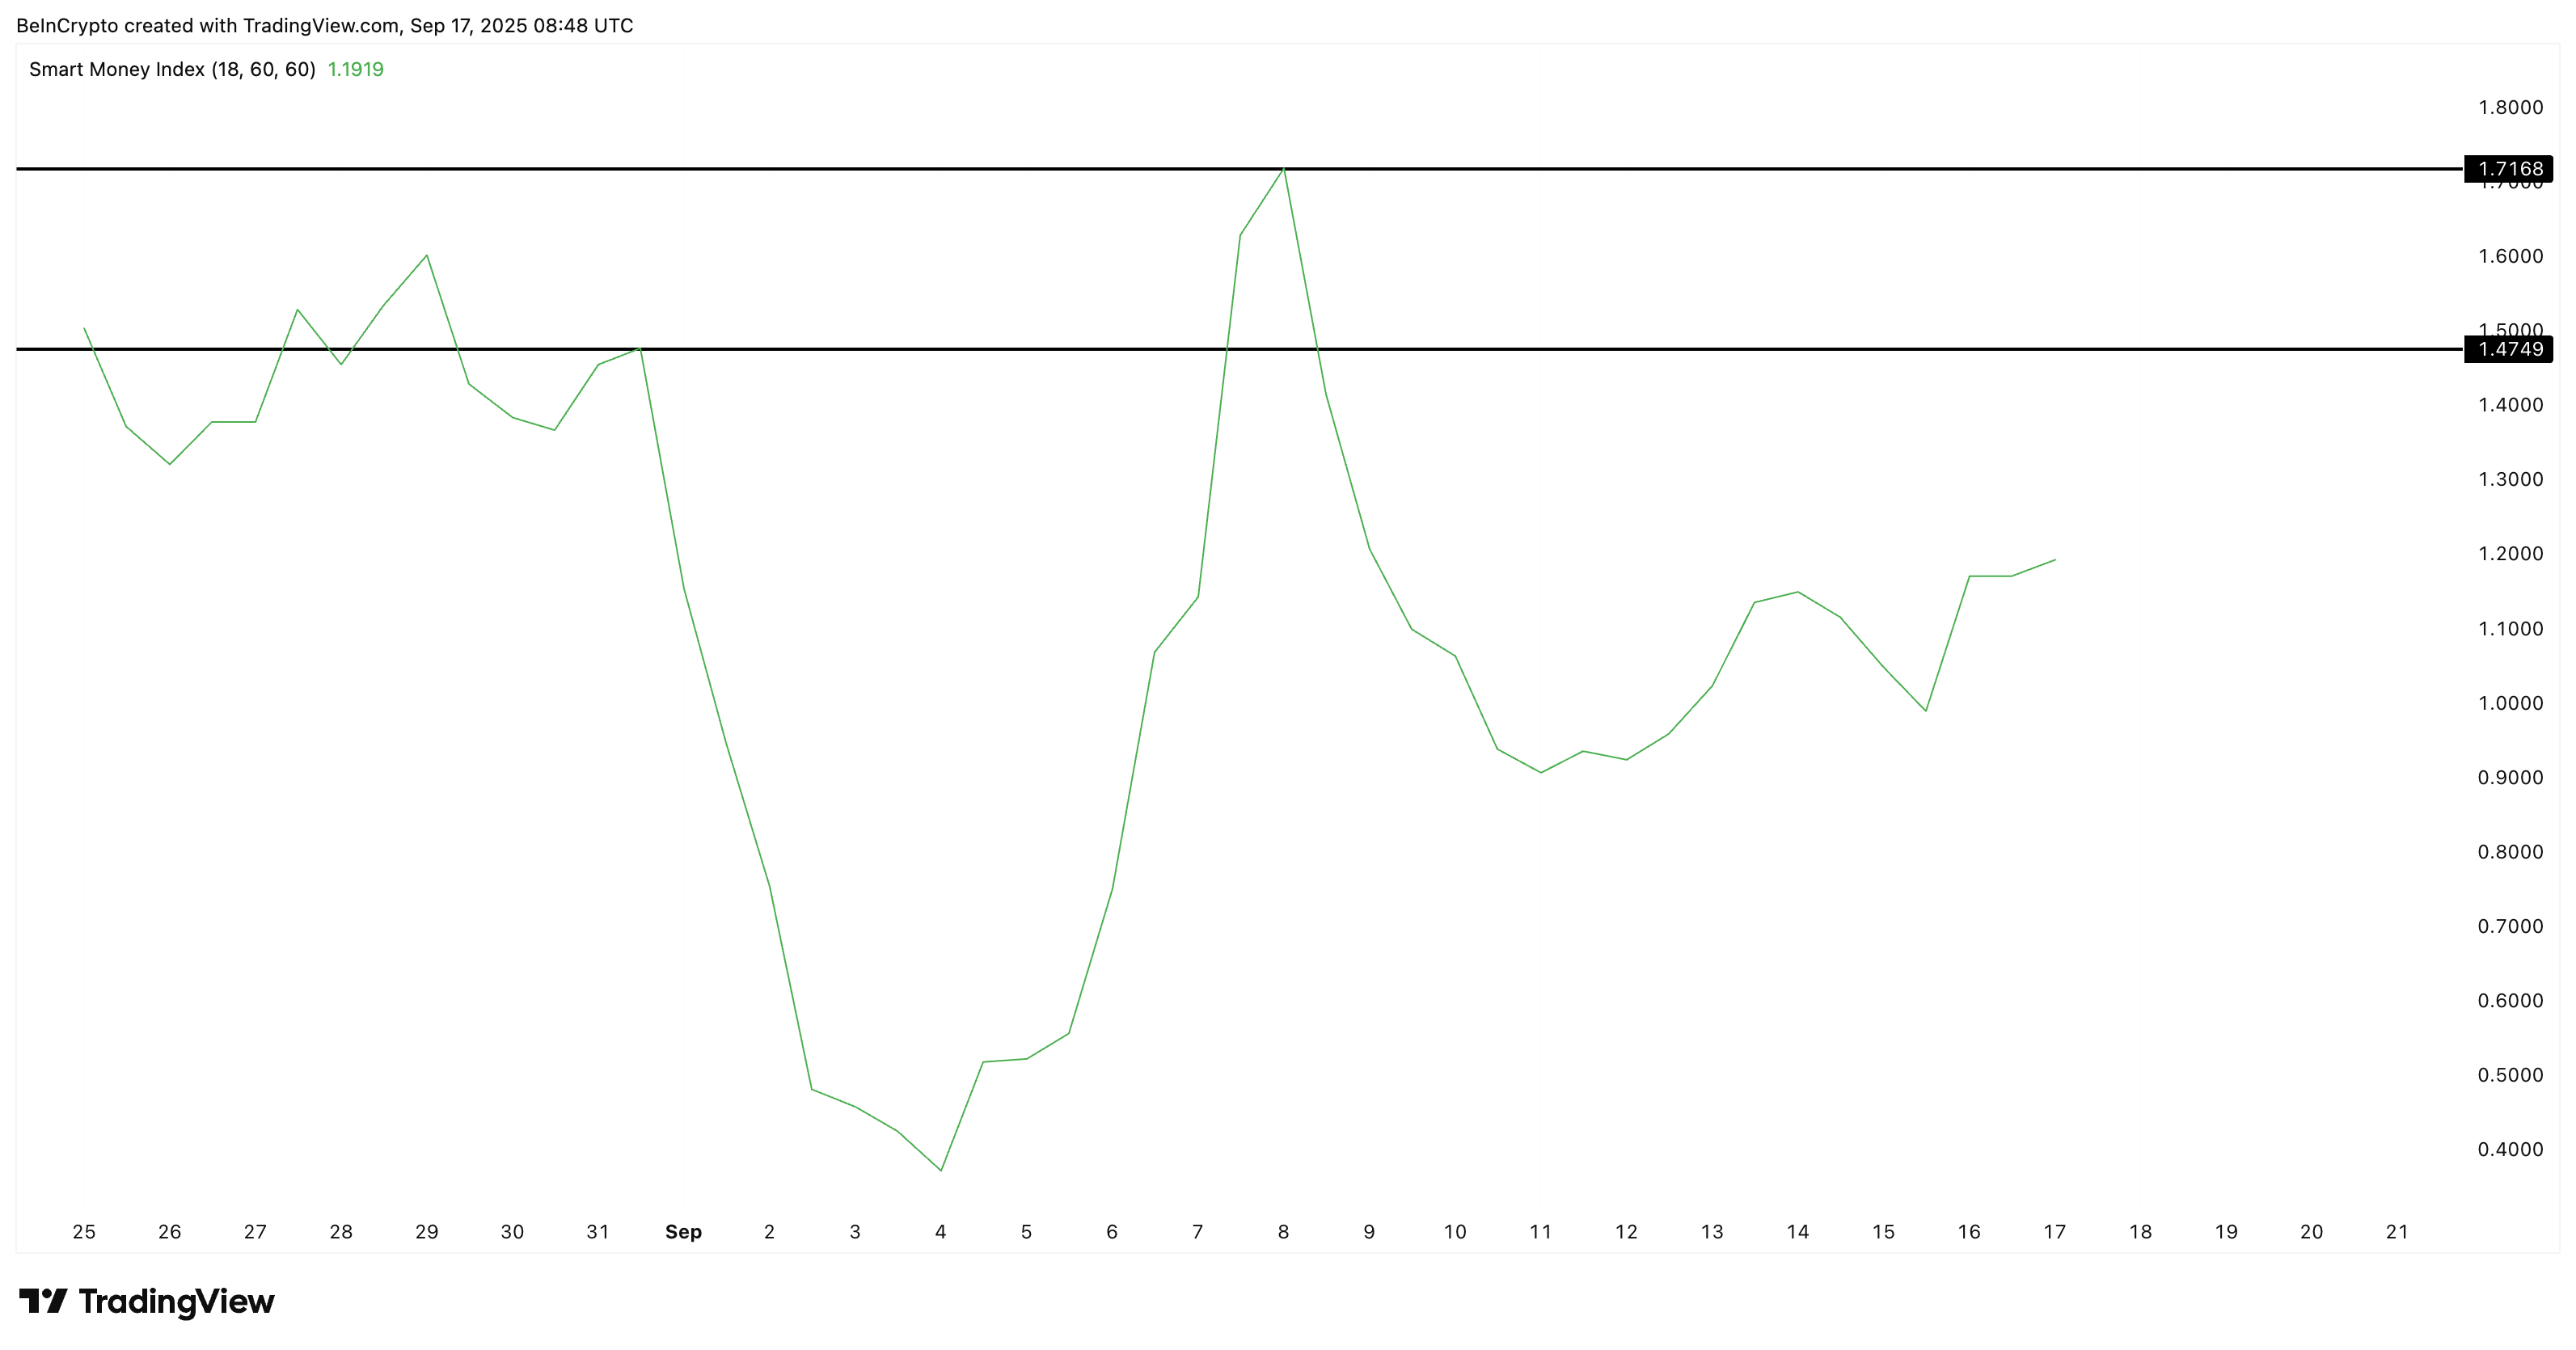
On the 12-hour chart, the Smart Money Index (SMI), which tracks buying and selling by smart traders, has quietly made a higher high since September 13. This suggests that traders who focus on quick rebounds are re-entering.
Still, confirmation is needed: the SMI must climb from its current 1.19 toward 1.47, and ideally 1.71, to unlock a broader rally setup.
 Smart Money Is Coming Back To Trade SOMI:
TradingView
Smart Money Is Coming Back To Trade SOMI:
TradingView
Want more token insights like this? Sign up for Editor Harsh Notariya’s Daily Crypto Newsletter here.
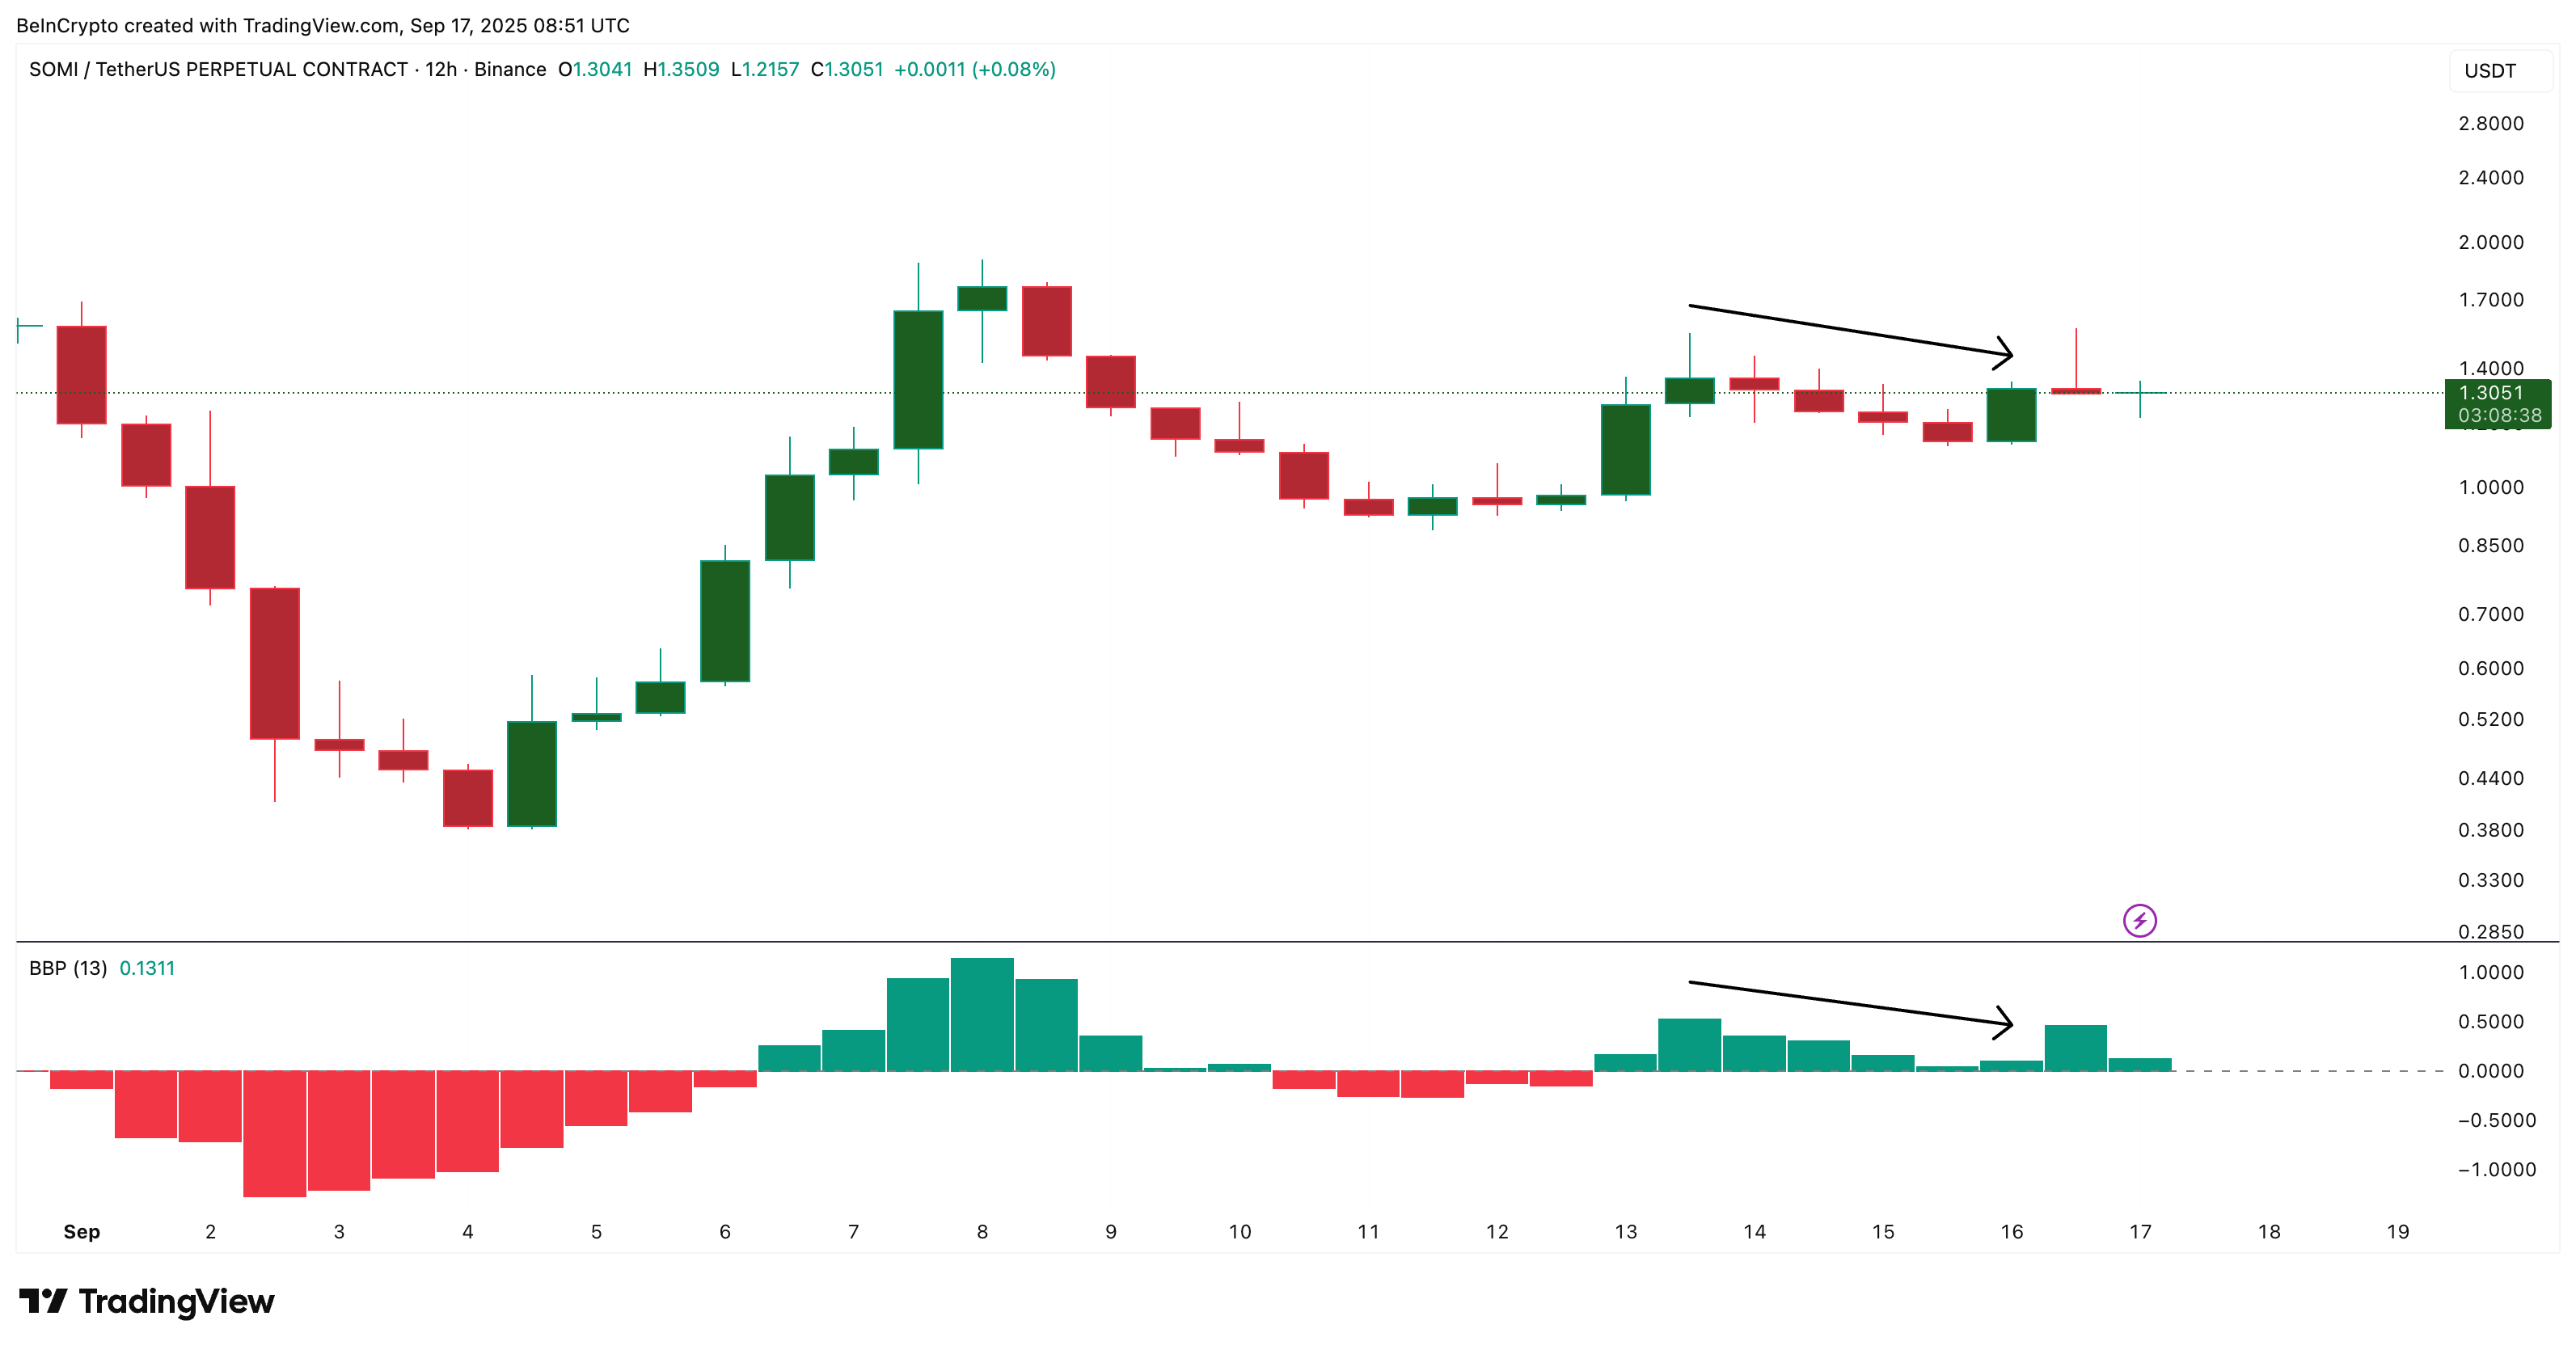
At the same time, the Bull-Bear Power Indicator, which measures the balance between buying (bulls) and selling (bears), has stayed in the green.
 SOMI Bulls In Control:
TradingView
SOMI Bulls In Control:
TradingView
This means bulls have remained stronger than bears even during the September 10–16 SOMI price pullback. Bearish strength increased, but bulls never fully lost control.
Now, green bullish power candles are returning, showing that buyers are regaining momentum. This, along with the smart money index getting a move on, furthers the rebound narrative.
SOMI Price Action and Hidden Bullishness Strengthen the Case
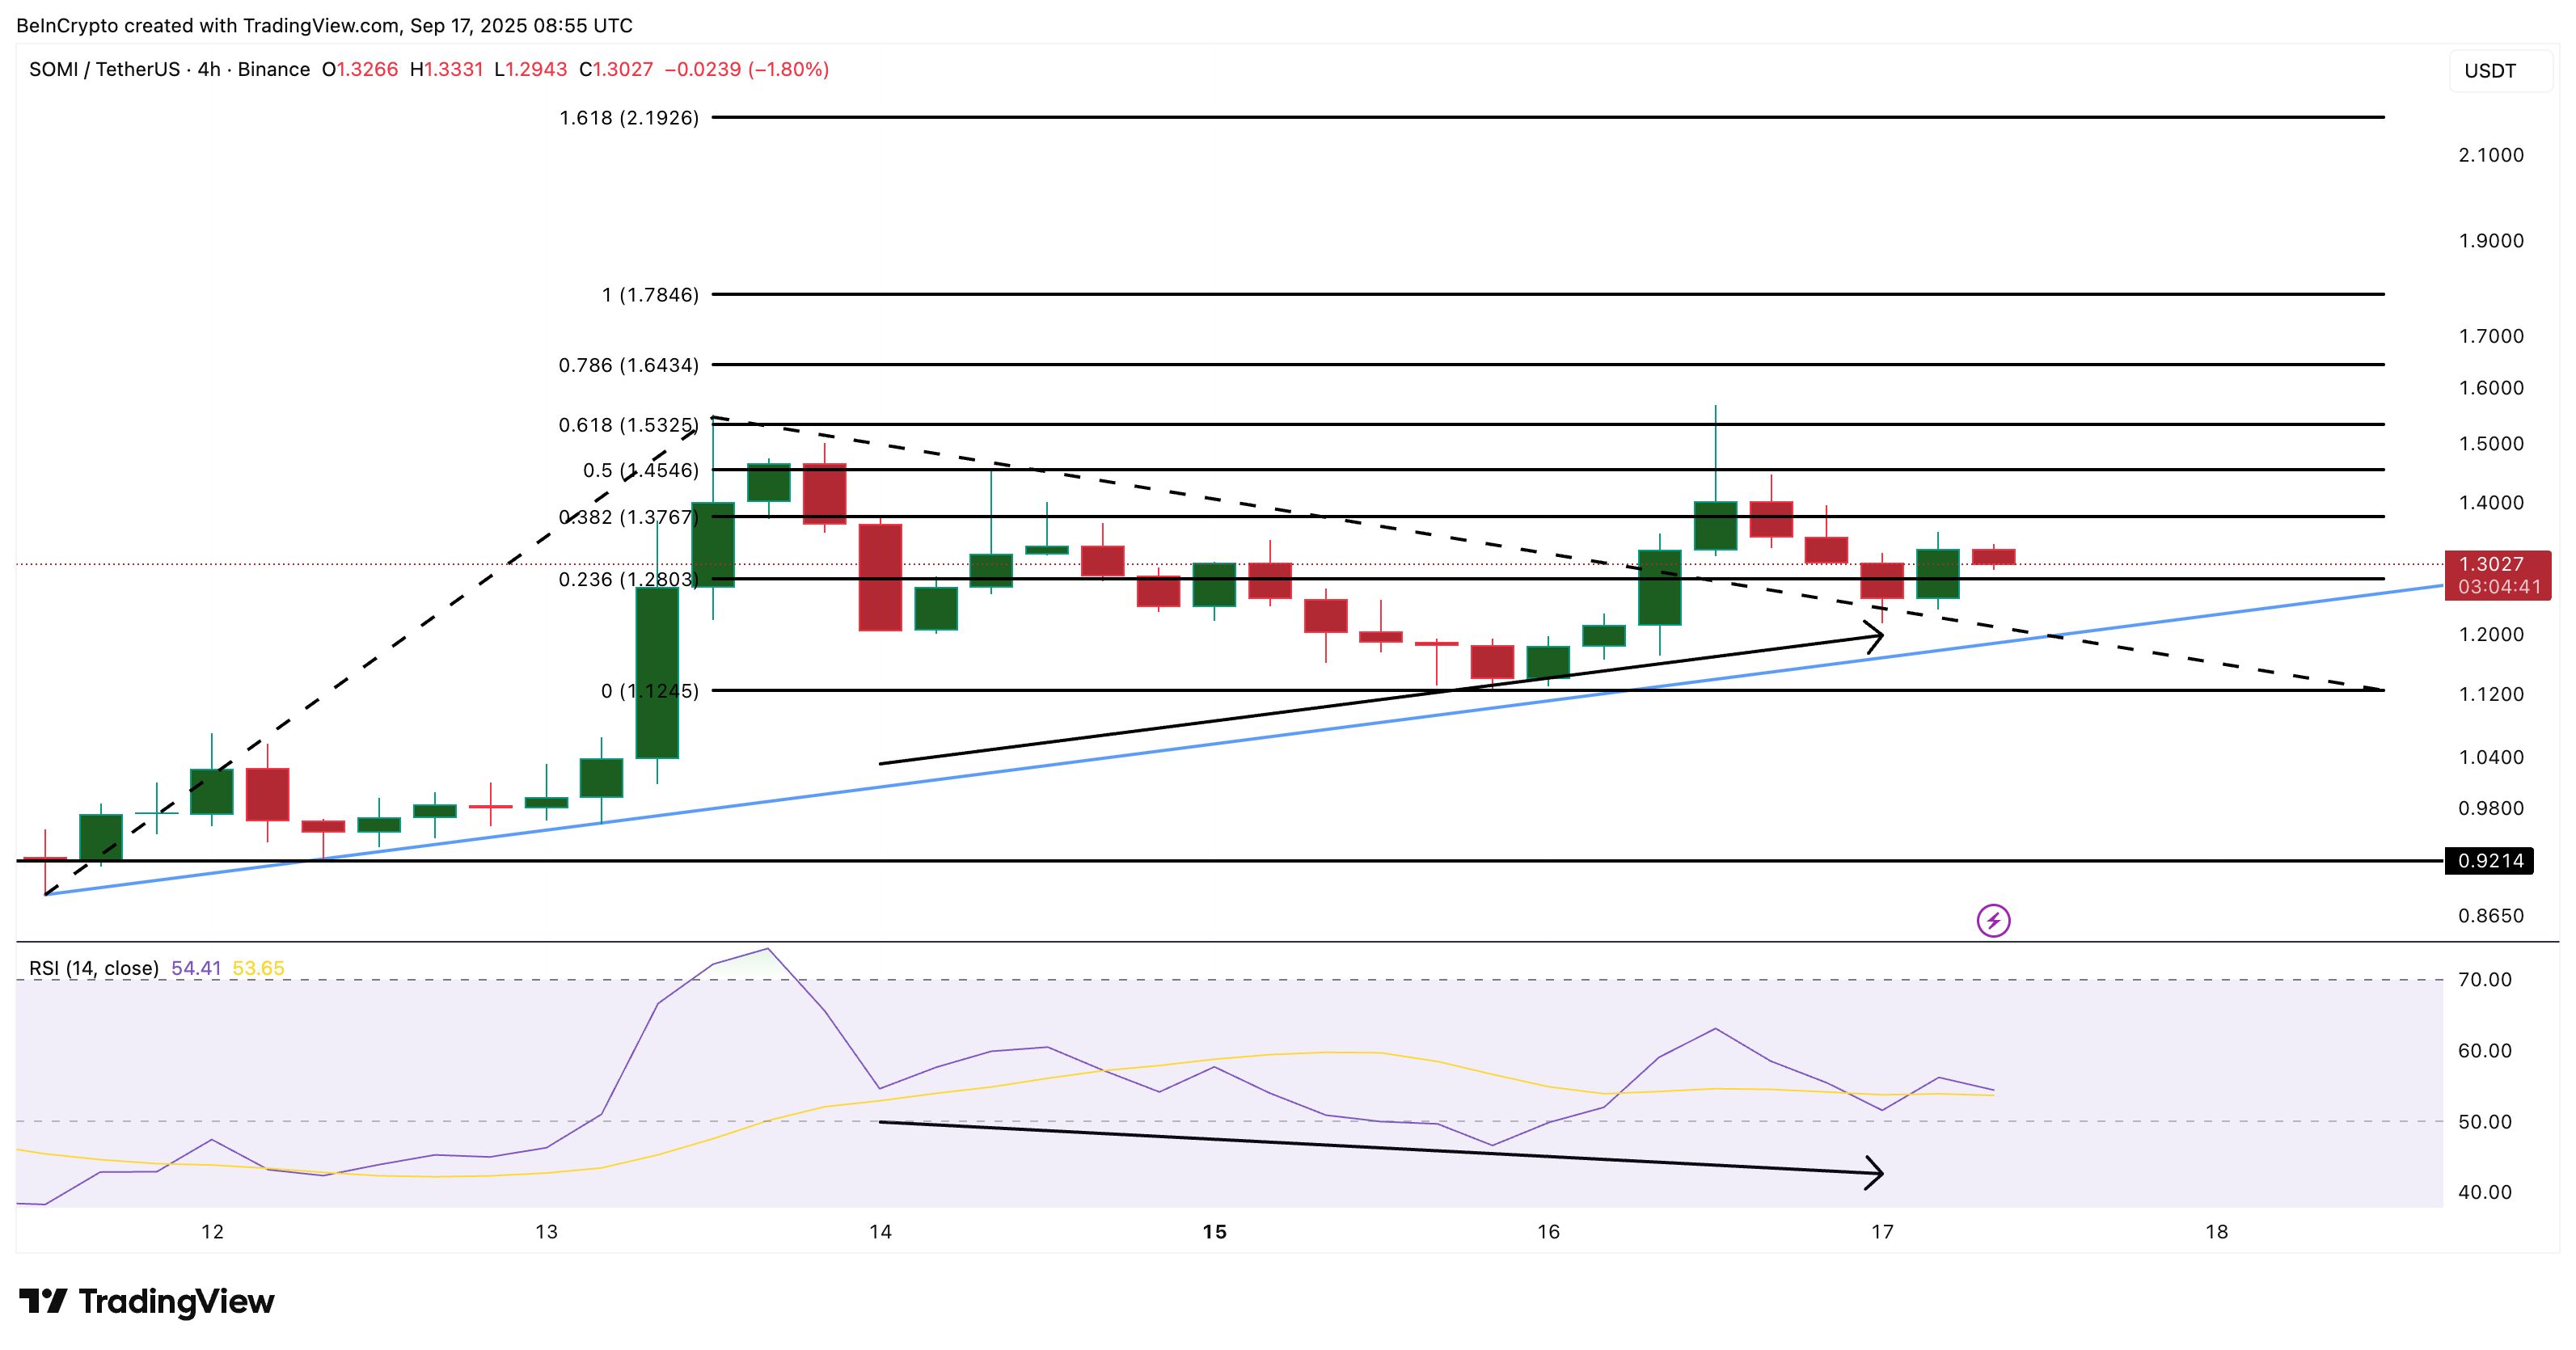
The 4-hour chart offers clarity to capture the shorter-term moves. SOMI is trading inside an ascending triangle, a bullish structure that often signals the continuation of an uptrend.
The token has already broken past one resistance at $1.28, with the next checkpoints for the SOMI price rebound sitting at $1.35 and $1.45.
 SOMI Price Analysis:
TradingView
SOMI Price Analysis:
TradingView
A clean breakout above $1.53, where past bounces have been rejected, would mean that the rebound narrative changed into a rally setup. That would even bring the all-time high narrative back into play. In that scenario, upside targets sit at $1.78 and $2.19, based on Fibonacci extension levels.
Adding credibility to the setup is the Relative Strength Index (RSI). Between September 14 and September 17, SOMI’s price formed higher lows, while RSI made lower lows. This hidden bullish divergence often signals trend continuation, backing the rebound smart trader-friendly theory and supporting the case for cautious optimism.
Still, risks remain. The rebound hypothesis weakens if SOMI closes below $1.12, with a deeper slide possible toward $0.92. That could happen if smart money withdraws and bears take control of the SOMI price action.
Disclaimer: The content of this article solely reflects the author's opinion and does not represent the platform in any capacity. This article is not intended to serve as a reference for making investment decisions.
You may also like
Will the Fed "continue raising interest rates"? Will the "tightening cycle" of the late 1980s be repeated?
The Citi report points out that the current macro environment is highly similar to the tightening cycle of 1988-1989, when the economy remained resilient and inflation pressures gradually accumulated, followed by a slowdown in economic activity before policies shifted to easing. During that tightening cycle, the Federal Reserve raised interest rates 16 times in a row.
Rare alliance of arch-rivals! Musk and Altman support Dario Amodei's call to "slow down AI globally"
Anthropic's Amodei issued a call to "slow down AI globally," and to everyone's surprise, rivals Musk and Altman both publicly endorsed the initiative. The three industry giants unanimously agreed to grant third-party access to "employee-level" evaluation rights and to implement coordinated deceleration measures. Altman went further, announcing that OpenAI will not IPO this year. The resignation of a researcher and a collective breakout of uncontrollable AI systems have ignited long-standing industry fears.
Bitcoin vs Ethereum ETFs: Which asset is winning September’s flow battle?
Solana targets $147 as it breaks key resistance and eyes further gains
Crypto prices
More


