
XRP Under Pressure: Bears Target 2-Month Low Amid Weak Technicals

XRP faces mounting selling pressure as technical signals flip bearish. Traders now watch $2.63 support as a critical level for the token’s next move.
XRP has started the new week under pressure, facing mounting selling activity after a 6% price decline over the past seven days.
Technical indicators suggest the token could experience further downside, potentially testing a two-month low in the coming sessions.
XRP Momentum Turns Negative
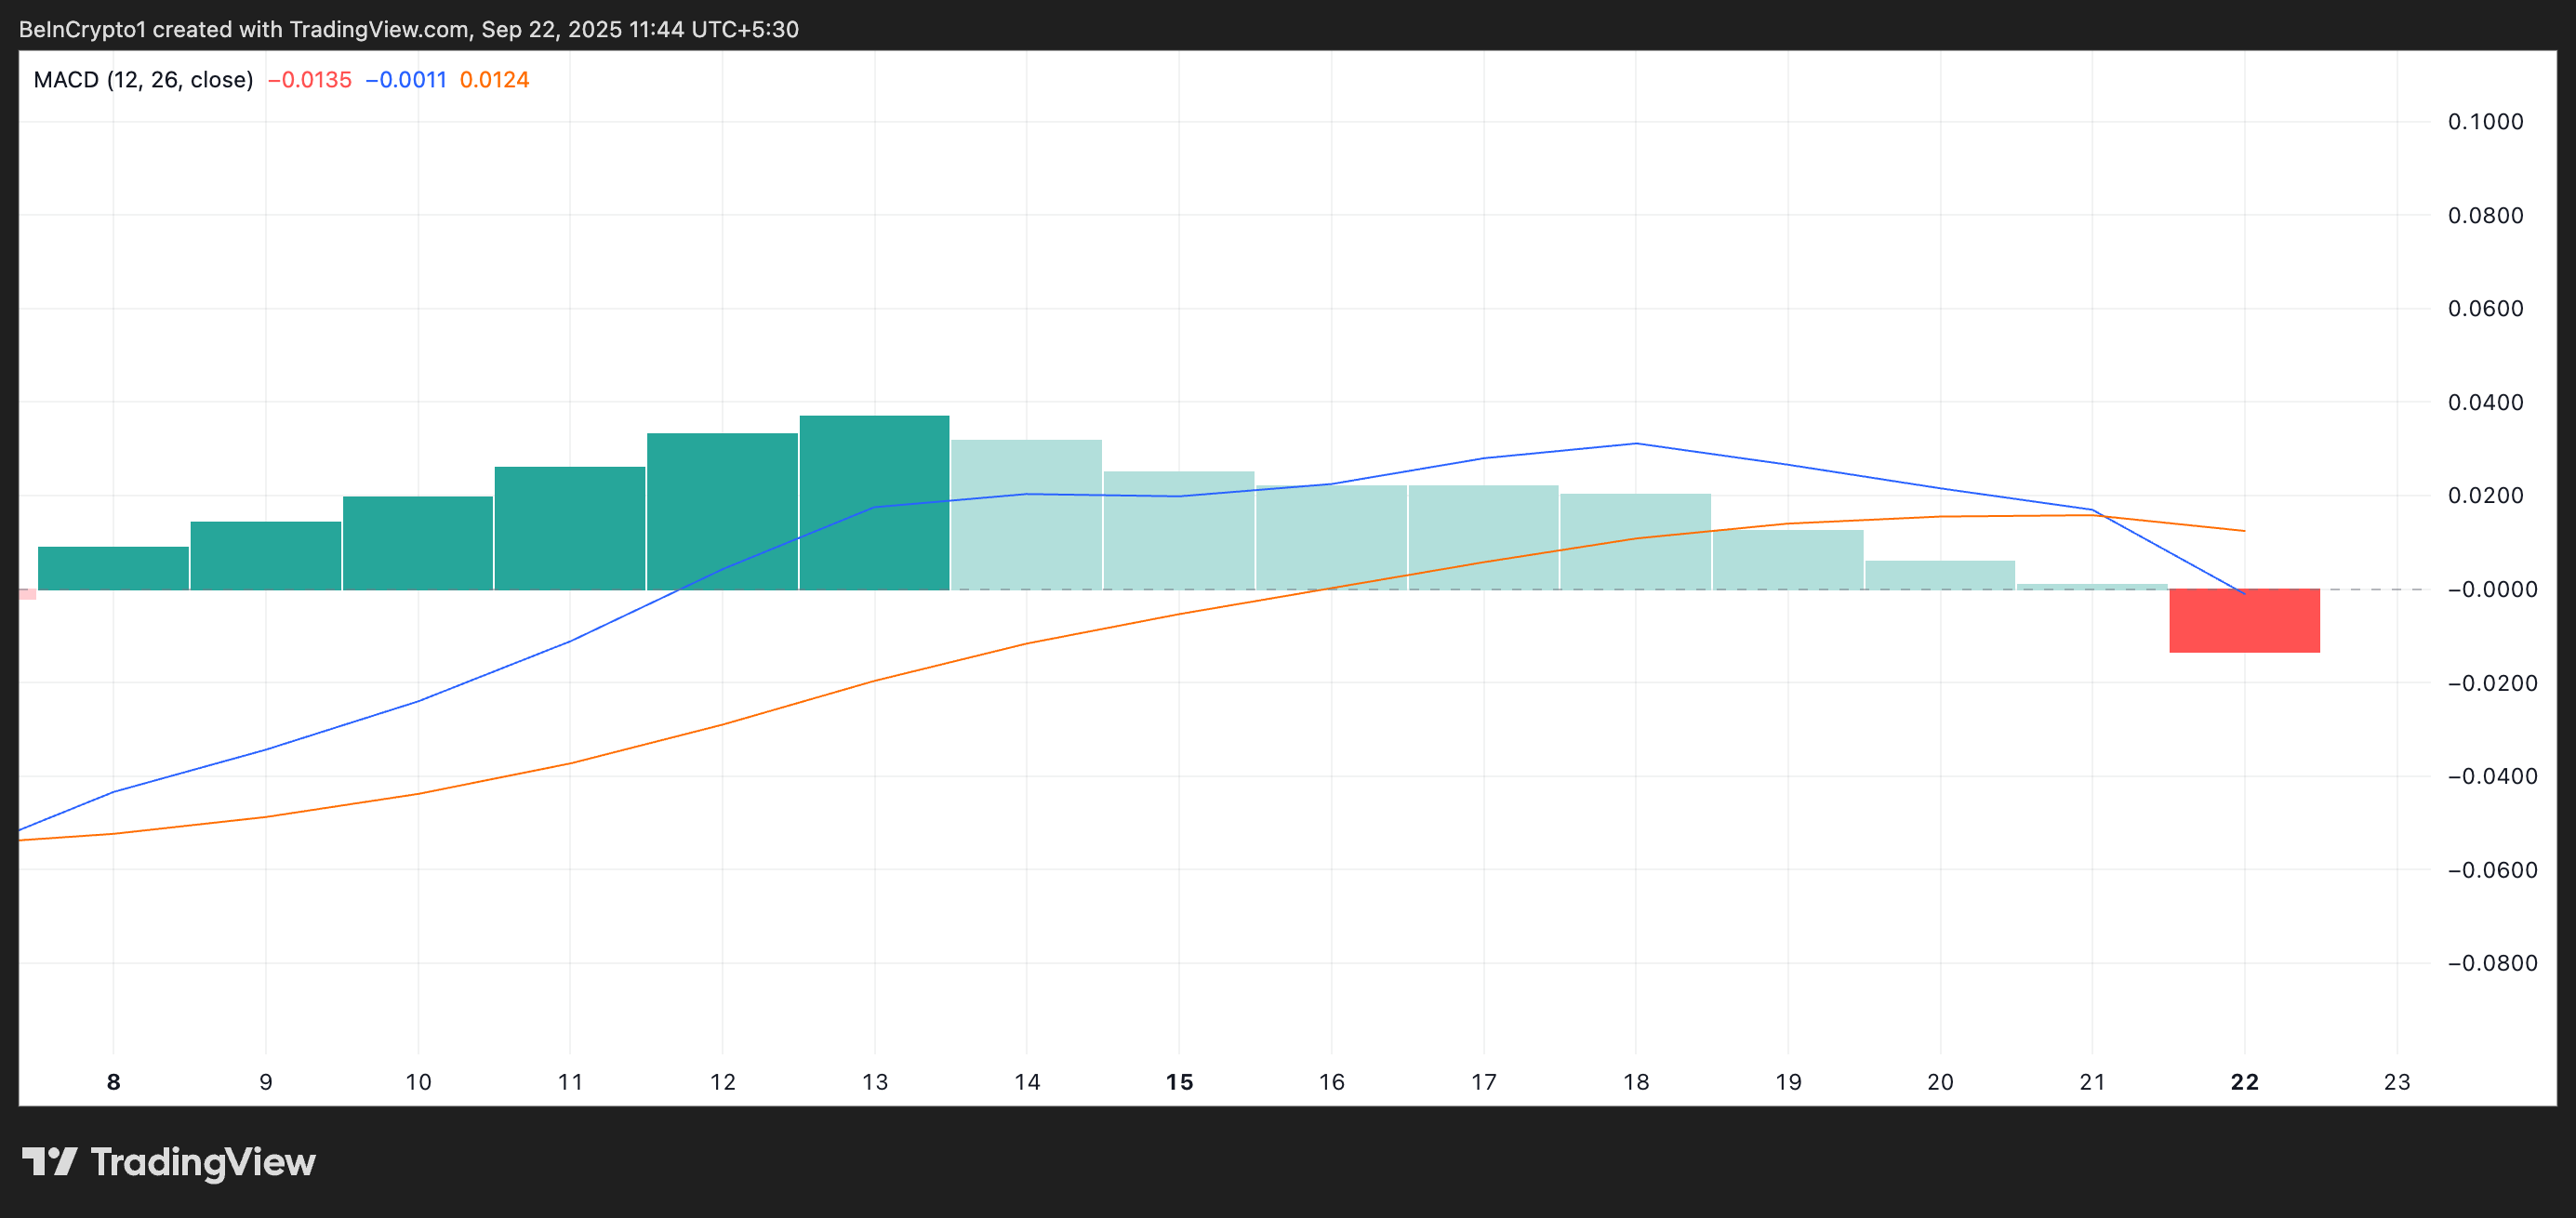
Readings from the XRP/USD one-day chart indicate that the token’s Moving Average Convergence Divergence (MACD) has formed a bearish crossover, signaling that XRP has entered a renewed downtrend phase.
For token TA and market updates: Want more token insights like this? Sign up for Editor Harsh Notariya’s Daily Crypto Newsletter here.
 XRP MACD. Source:
TradingView
XRP MACD. Source:
TradingView
The MACD indicator identifies trends and momentum in its price movement. It helps traders spot potential buy or sell signals through crossovers between the MACD and signal lines.
A bearish crossover occurs when the MACD line crosses below the signal line, suggesting that selling pressure is building and that the asset’s upward momentum is fading.
For XRP, this is the first time the MACD has taken this shape since September 8, highlighting a shift in market sentiment from bullish to bearish.
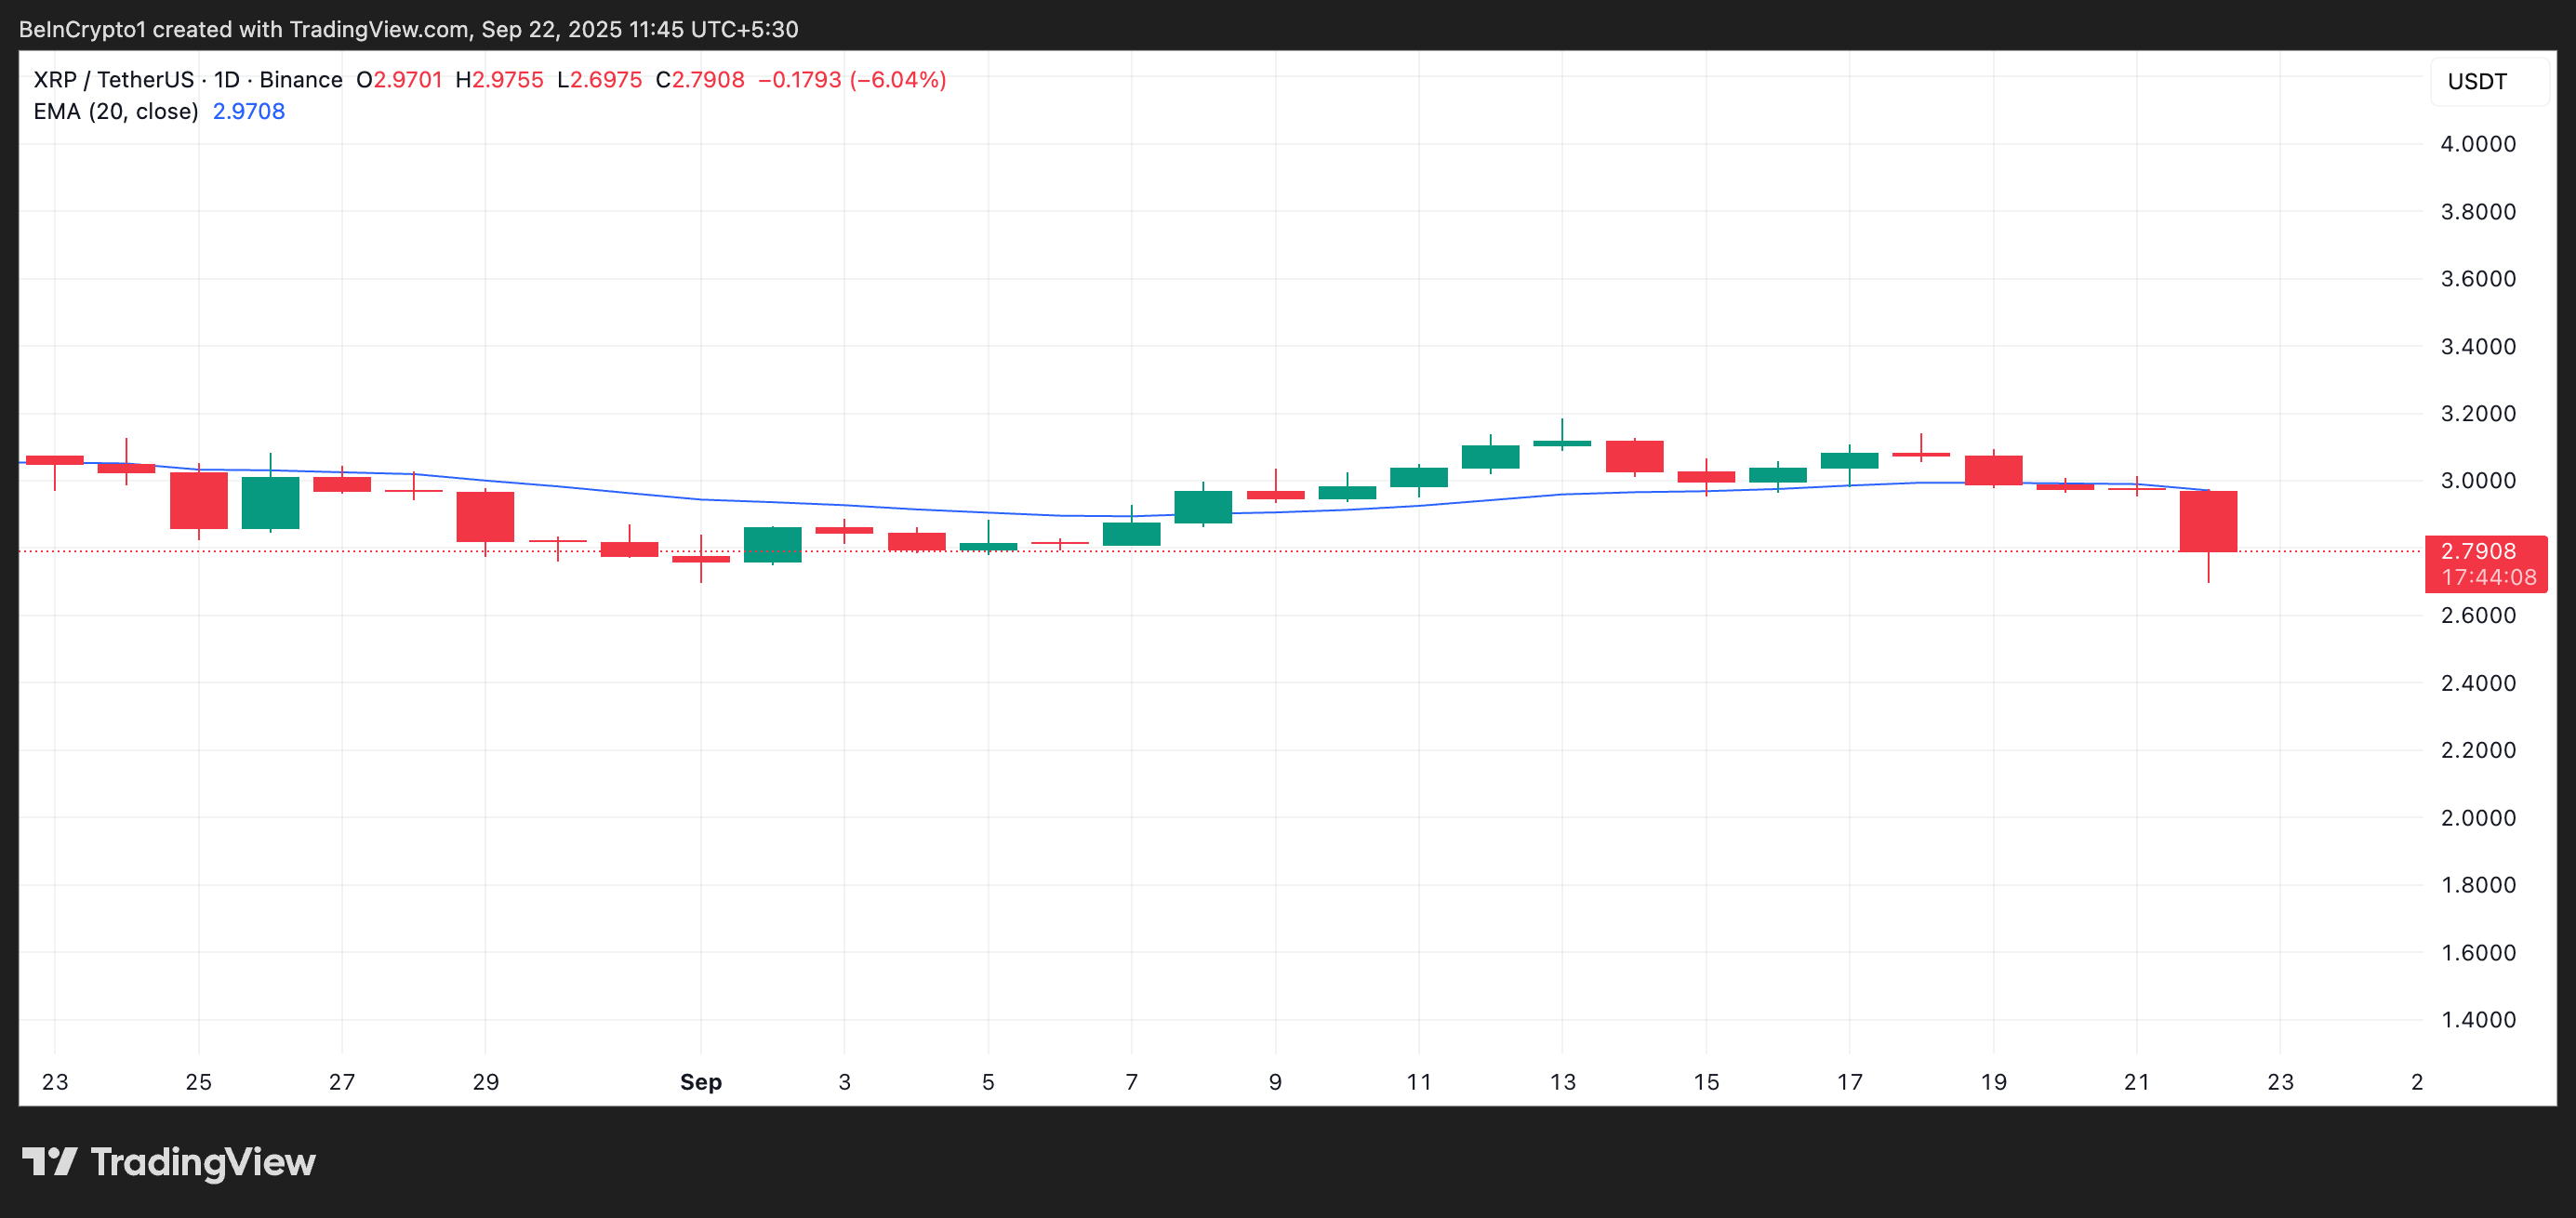
This could increase the downward pressure on XRP as traders usually interpret the setup as a signal to reduce positions and initiate selling. Furthermore, XRP’s price has plummeted below its 20-day exponential moving average (EMA), confirming the dip in bullish bias towards the altcoin.
 XRP 20-Day EMA. Source:
TradingView
XRP 20-Day EMA. Source:
TradingView
As of this writing, the key moving average forms dynamic resistance above XRP’s price at $2.97, keeping its performance muted.
The 20-day EMA measures the asset’s average price over the past 20 trading days, weighing recent price changes more heavily.
When the price falls below the EMA, it signals that short-term selling pressure is increasing and that bearish momentum may be building. This puts XRP at risk of extending its decline over the next few trading sessions.
XRP Bears Eye $2.39 While Bulls Target $2.87 Rebound
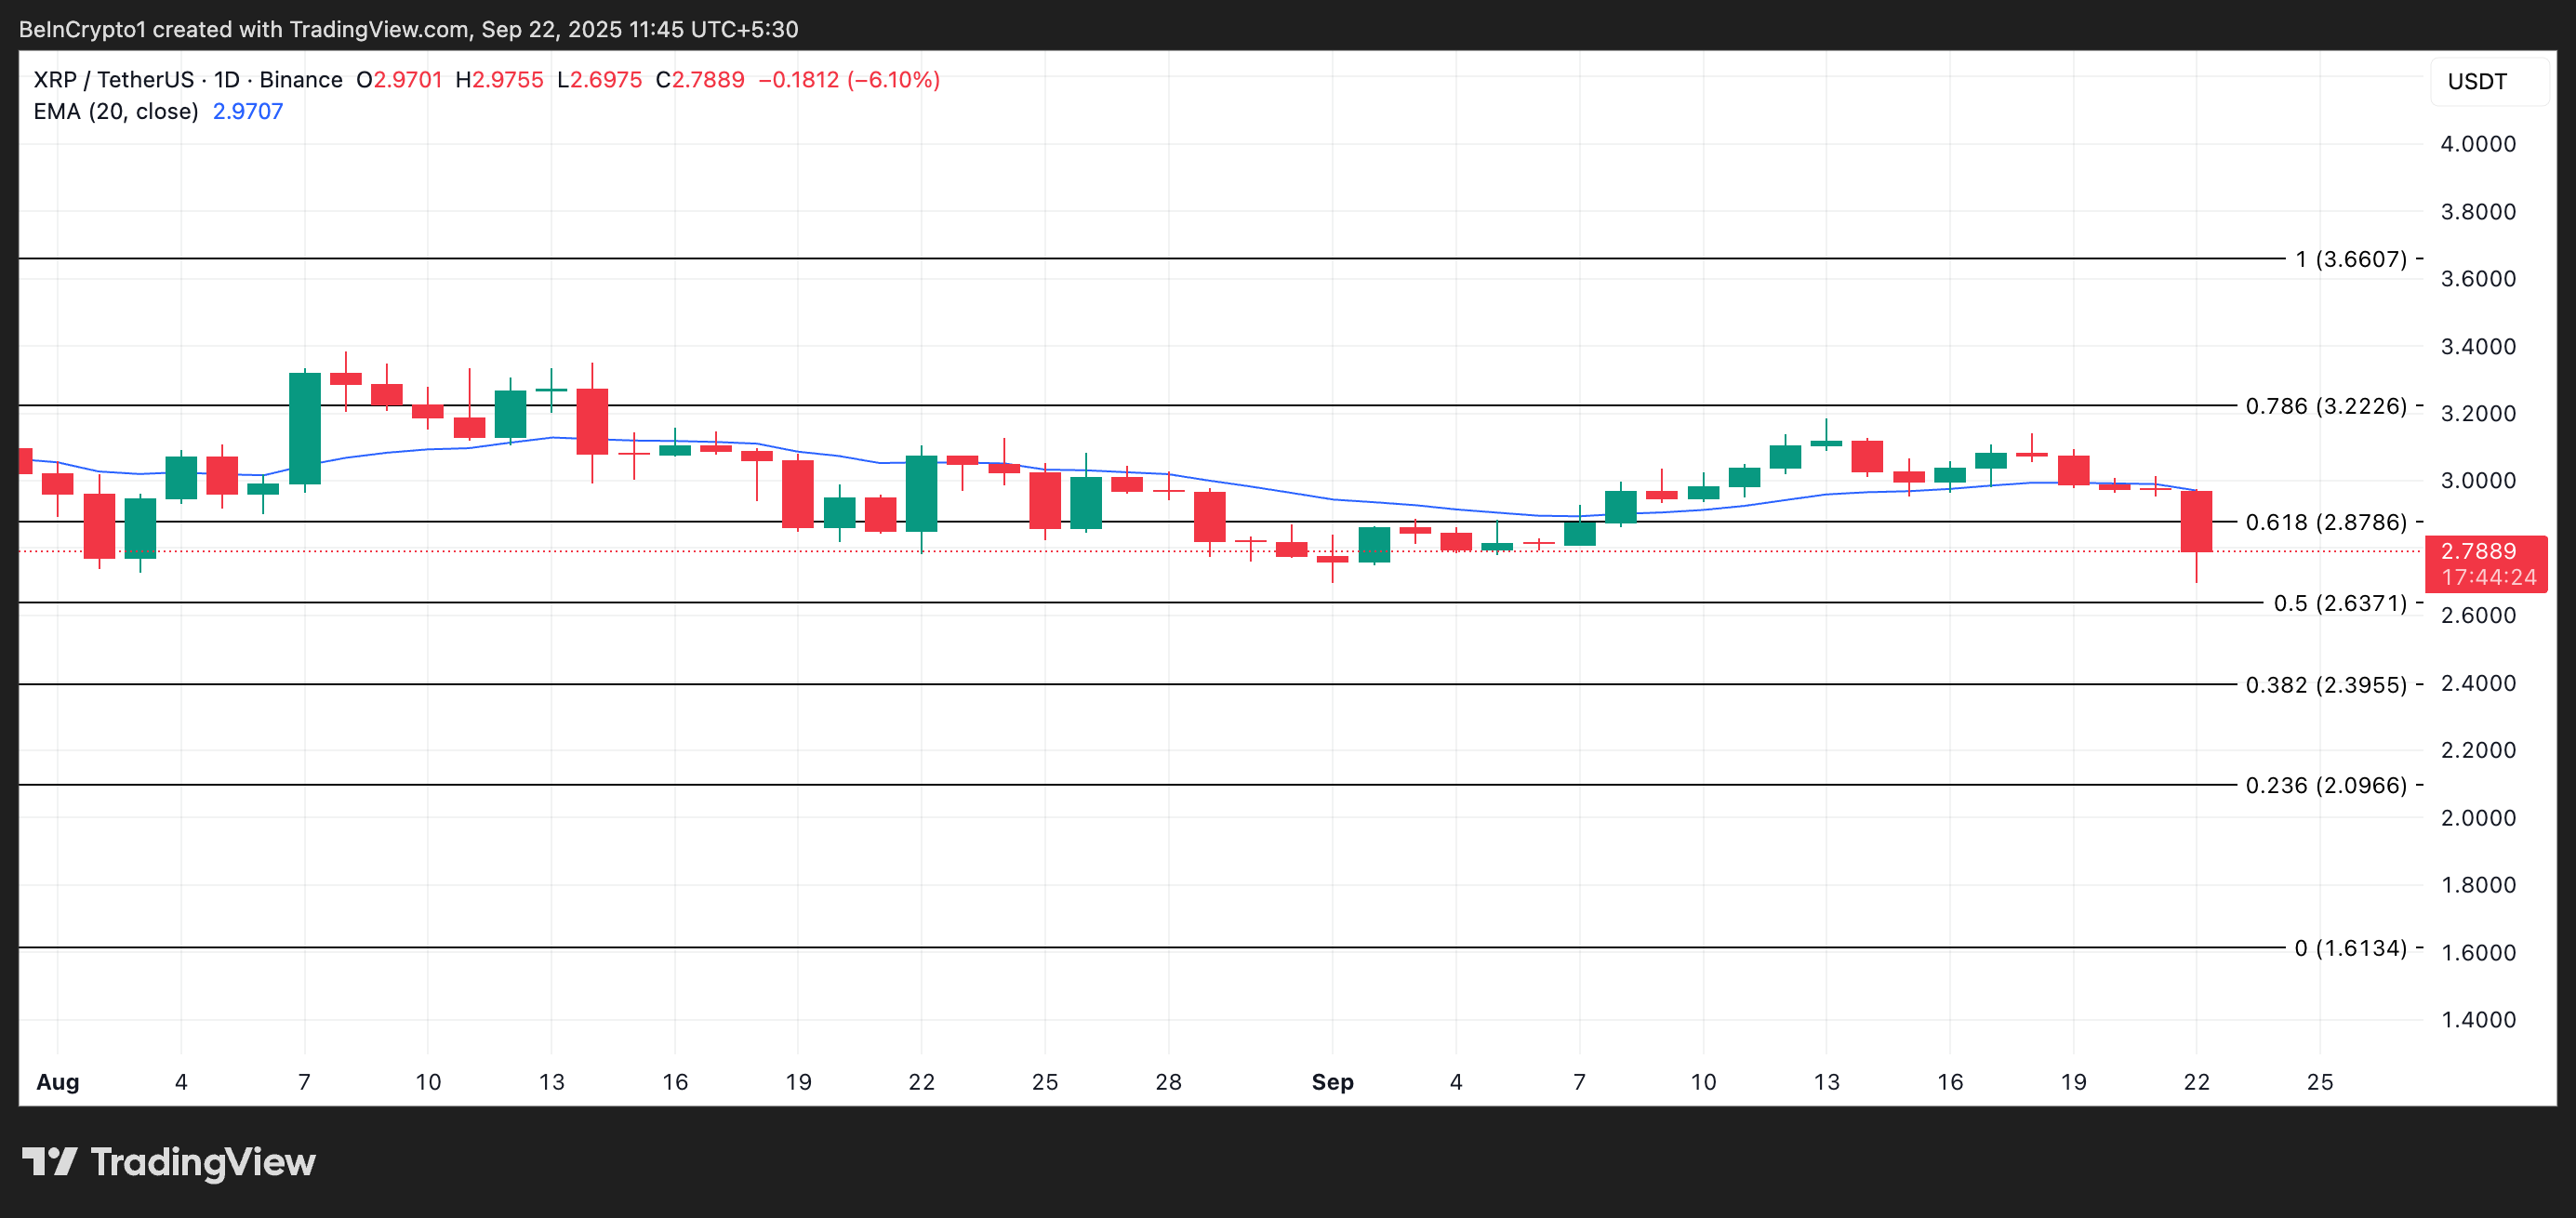
For XRP’s near-term price outlook, its next direction depends on whether bulls can defend the support floor at $2.63. If selloffs worsen and the price level fails to hold, XRP’s price could fall to $2.39, a low it last reached in July.
 XRP Price Analysis. Source:
TradingView
XRP Price Analysis. Source:
TradingView
On the other hand, if buyer confidence strengthens and accumulation grows, the token’s value could rebound toward $2.87. A successful breach of this barrier could open the door for a rally above the token’s 20-day EMA and a push for $3.22.
Disclaimer: The content of this article solely reflects the author's opinion and does not represent the platform in any capacity. This article is not intended to serve as a reference for making investment decisions.
You may also like
Despite falling oil prices and dovish comments from Fed officials, US Treasury yields continue to rise
The wave of US Treasury sell-offs continues to spread, with the 30-year yield reaching a 24-year high of 5.621% and the 10-year yield rising to its highest level since 2002—oil price declines and dovish signals have both failed, and long-term rates remain unaffected. High yields are reshaping the structure of US equities; as the AI narrative becomes the market’s final pillar, any cracks could trigger a chain reaction of turbulence.
Morgan Stanley trading desk, dubbed the "most accurate in the past two years," turns bullish
The supporting logic encompasses five major pillars: unexpected macro trends, consumer resilience, low profit expectations, stabilized yields, and technical improvements. Since the previous shift on August 31, the Nasdaq 100 long and Russell 2000 short paired trades have accumulated gains of over 8%. This latest "bullish reversal" is even more convincing. Strategically, technology remains the core long position, but the hedging tool has shifted from shorting RTY to derivatives. Meanwhile, the risk of long-term interest rate hikes still persists.

Four major favorable factors emerge, international oil prices respond by falling
Crypto prices
More


