Bitget App
Trade smarter
Buy cryptoMarketsTradeFuturesStocksEarnInstitutionAI & More
Near Protocol (NEAR) Dips to Retest Key Breakout – Will It Bounce Back?

Near Protocol (NEAR) Dips to Retest Key Breakout – Will It Bounce Back?

CoinsProbeCoinsProbe2025/09/22 20:57
By:Nilesh Hembade

Date: Mon, Sept 22, 2025 | 09:10 AM GMT

The cryptocurrency market is facing a sharp downturn, with over $1.7 billion in liquidations recorded in the past 24 hours. Ethereum (ETH) has dropped more than 6%, sliding to the $4,200 level. Major altcoins are also under pressure, including Near Protocol (NEAR), one of the leading AI-focused tokens.

NEAR has fallen over 9% in the past day. More importantly, the token is now testing a pivotal technical level that could determine its next direction.

Near Protocol (NEAR) Dips to Retest Key Breakout – Will It Bounce Back? image 0 Source: Coinmarketcap

Retesting Symmetrical Triangle

On the daily chart, NEAR has been consolidating within a symmetrical triangle — a neutral pattern that often precedes strong breakouts.

Recently, NEAR found support near $2.34 before rebounding sharply. This rebound pushed the token above the triangle’s descending resistance line, confirming a breakout at around $2.78. The move carried NEAR as high as $3.34.
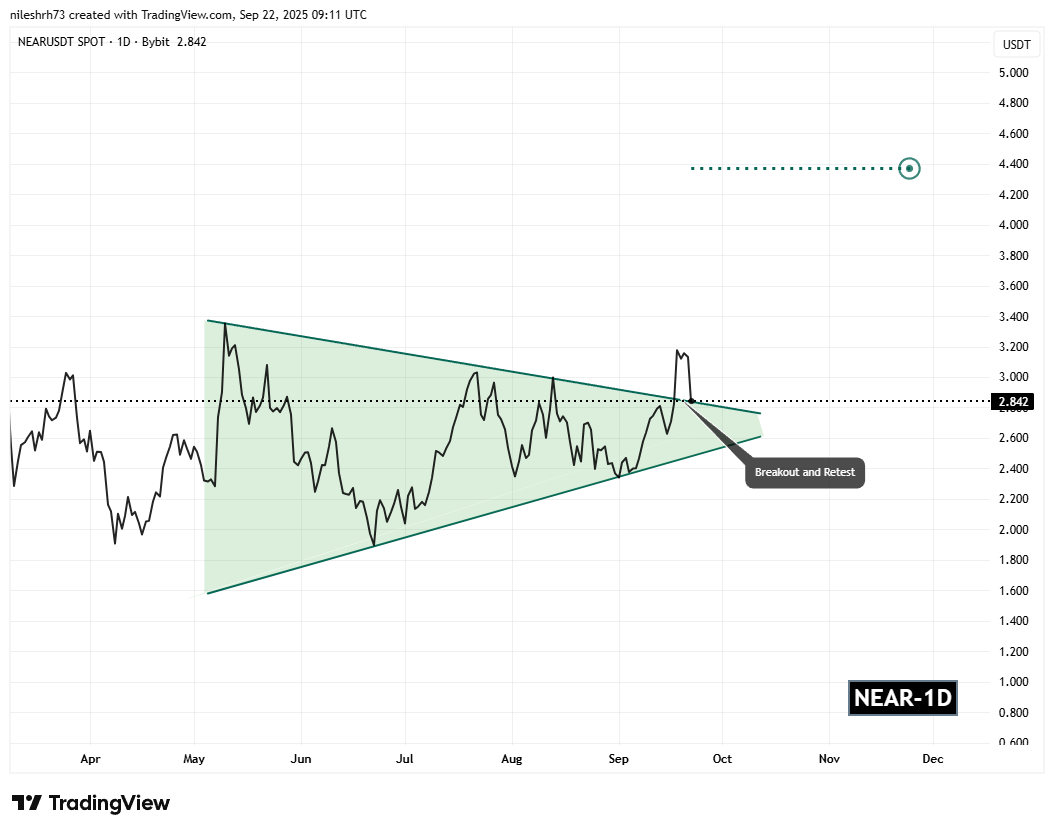
Near Protocol (NEAR) Dips to Retest Key Breakout – Will It Bounce Back? image 1 Near Protocol (NEAR) Daily Chart/Coinsprobe (Source: Tradingview)

However, as often happens after strong breakouts, the price has now pulled back to retest the breakout level. At present, NEAR is trading near $2.84 — right on the retest zone highlighted in the chart — where buyers may attempt to reassert control.

What’s Next for NEAR?

The ongoing retest is a critical test for the bulls. If buyers can successfully defend the $2.74 zone and push NEAR back toward the $3.34 local high, the token could reignite bullish momentum. A decisive breakout above that resistance would open the door for further upside.

Based on the triangle breakout projection, NEAR has the potential to climb toward the $4.37 level, which represents a nearly 53% upside from current prices.

On the other hand, failure to hold the breakout zone could see NEAR fall back inside the triangle, invalidating the bullish breakout and raising the risk of a deeper correction.

0
0

Disclaimer: The content of this article solely reflects the author's opinion and does not represent the platform in any capacity. This article is not intended to serve as a reference for making investment decisions.

Understand the market, then trade.
Bitget offers one-stop trading for cryptocurrencies, stocks, and gold.
Trade now!

You may also like

Despite falling oil prices and dovish comments from Fed officials, US Treasury yields continue to rise

The wave of US Treasury sell-offs continues to spread, with the 30-year yield reaching a 24-year high of 5.621% and the 10-year yield rising to its highest level since 2002—oil price declines and dovish signals have both failed, and long-term rates remain unaffected. High yields are reshaping the structure of US equities; as the AI narrative becomes the market’s final pillar, any cracks could trigger a chain reaction of turbulence.

华尔街见闻•2026/09/30 00:41

Morgan Stanley trading desk, dubbed the "most accurate in the past two years," turns bullish

The supporting logic encompasses five major pillars: unexpected macro trends, consumer resilience, low profit expectations, stabilized yields, and technical improvements. Since the previous shift on August 31, the Nasdaq 100 long and Russell 2000 short paired trades have accumulated gains of over 8%. This latest "bullish reversal" is even more convincing. Strategically, technology remains the core long position, but the hedging tool has shifted from shorting RTY to derivatives. Meanwhile, the risk of long-term interest rate hikes still persists.

华尔街见闻•2026/09/30 00:16
Morgan Stanley trading desk, dubbed the "most accurate in the past two years," turns bullish