

According to popular crypto analyst Ali Martinez, PEPE is ready for a 78% price move, indicating that the frog-themed meme coin could soon see explosive volatility in either direction.
PEPE Price Analysis: Giant Triangle Formation
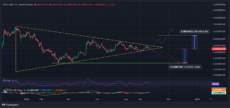
A chart shared by Martinez shows PEPE consolidating within a descending triangle, where both lower highs and higher lows have compressed price action into a narrow range.
This structure often acts as a precursor to strong price expansion once the asset chooses a direction.
$PEPE readies for a 78% price move! pic.twitter.com/z7zN3ZXe25
— Ali (@ali_charts) September 17, 2025
As per the chart below, Martinez’s 78% target comes from measuring the height of the initial triangle formation and projecting it from the potential breakout point.
If PEPE breaks upward, this implies a surge toward $0.000018–$0.000022, nearly doubling its value from current levels.
On the other hand, a downward break could send the coin tumbling by as much as 44%, dragging it back toward the $0.0000055–$0.0000060 support region.
Technical Indicators for Further Insight
According to CoinMarketCap, PEPE is trading at $0.000009728, down 7.3% in the last 24 hours and over 14% in the past month. Despite the price correction, trading volume surged 104.38%.
Meanwhile, the RSI currently sits at 46.65 while the MACD shows compressed signals, with the MACD line and signal line nearly overlapping.
Source: TradingView
It is important to note that the immediate resistance lies near $0.000012, with the larger upside target sitting above $0.000016 if the breakout sustains.
Meanwhile, critical support rests at $0.000009, with deeper retracement targets near $0.0000055.
A Massive PEPE Rally Incoming?
If PEPE bulls manage to push through the triangle’s upper trendline, a breakout rally toward $0.000016–$0.000022 could ignite renewed hype around meme coins, potentially kick-starting a broader “Meme Coin Season”.
However, failure to hold the triangle’s support zone could invite a steep correction, wiping nearly half the token’s recent gains.
As PEPE Approaches Critical Price Point, New PEPENODE Project Raises $1.3 Million
While PEPE eyes a massive price rally, PEPENODE ($PEPENODE) lets holders create virtual mining rigs to earn rewards in a gamified, meme-fueled world.
No need for expensive gear or technical skills – just build digital server rooms, deploy miner nodes, and upgrade your virtual facilities to start collecting tokens.

The project runs on Ethereum using the ERC-20 token standard, making it compatible with most wallets and exchanges.
Its tokenomics are designed to be deflationary, as about 70% of tokens spent on nodes and upgrades are burned, cutting down supply over time.



