Date: Fri, Sept 26, 2025 | 03:10 PM GMT
The cryptocurrency market continues to struggle under broad retracement, with Bitcoin (BTC) and Ethereum (ETH) both facing sharp declines. Ethereum , in particular, has slipped more than 12%, dropping below the $4,000 level. This weakness has spilled over into major altcoins, with ORDI (ORDI) also facing heavy pressure.
Over the past week, ORDI has shed more than 18%. But what’s catching attention is not just the decline itself — it’s the fact that the coin is now testing a crucial technical level inside a key chart pattern.
 Source: Coinmarketcap
Symmetrical Triangle in Play
On the daily chart, ORDI has been consolidating inside a symmetrical triangle, a neutral pattern that often builds up pressure before a decisive breakout.
The recent correction has dragged ORDI toward the triangle’s lower boundary near $7.56, where buyers appear to be defending support. At the time of writing, the token is trading around $8.24, sitting just above this pivotal trendline.
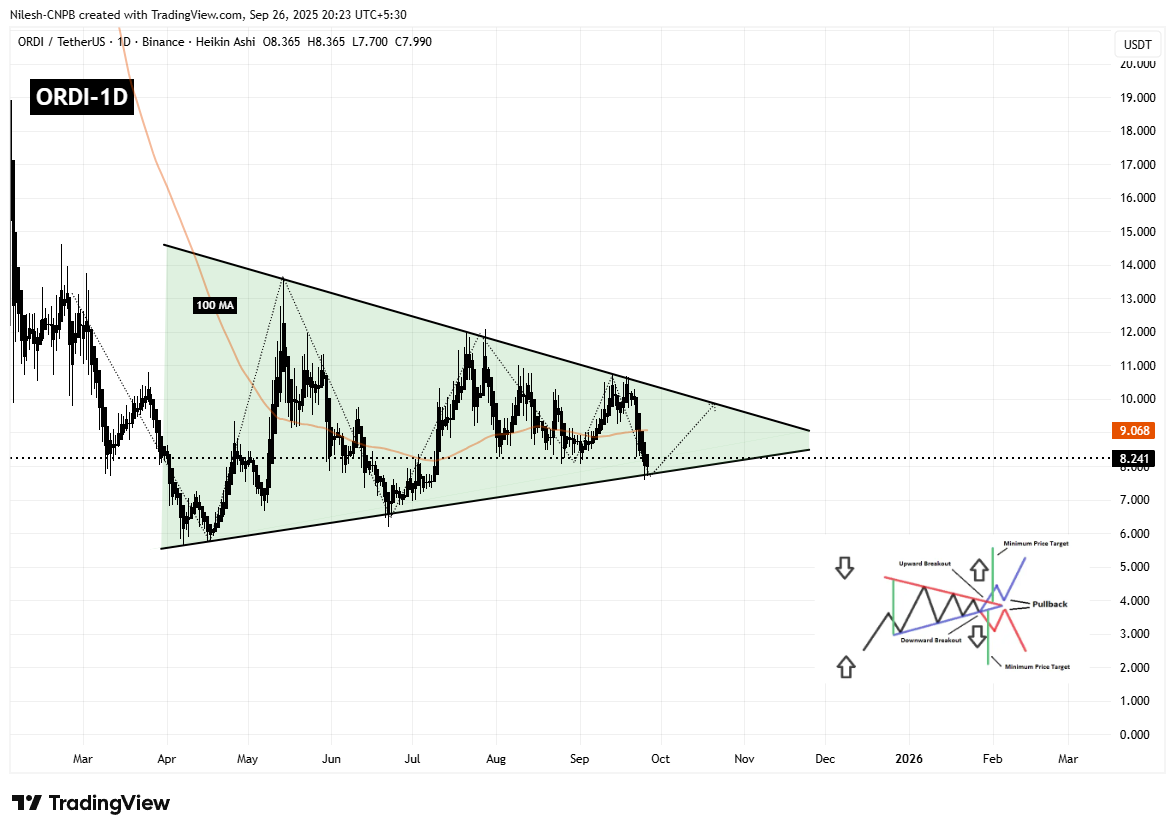 ORDI (ORDI) Daily Chart/Coinsprobe (Source: Tradingview)
This level has acted as dynamic support for several months, making it a make-or-break zone for bulls who are looking to keep the broader structure intact.
What’s Next for ORDI?
If buyers successfully hold above the $7.56–$8.00 range and reclaim levels above the 100-day moving average at $9.06, momentum could shift back in their favor. A rebound from here may drive ORDI toward the triangle’s upper resistance near $9.84. A breakout above that zone would confirm bullish continuation, potentially setting the stage for a larger rally.
On the flip side, if ORDI slips decisively below $7.50, it would confirm a bearish breakdown from the pattern. In that case, the coin could face deeper losses, with sellers aiming for lower supports and potentially triggering panic-driven selling.
For now, ORDI sits at a crossroads — with its symmetrical triangle preparing the ground for either a sharp bounce back or a fresh wave of downside pressure.