Date: Tue, Sept 30, 2025 | 12:30 PM GMT
The cryptocurrency market has recently seen a wave of retracements, with Ethereum (ETH) sliding from its September 13 high of $4,768 to a low of $3,839 before rebounding to trade near $4,175. This broader pressure has spilled into major altcoins , including Polymesh (POLYX).
Over the past week, POLYX has shed more than 9%. But beyond the decline, what’s drawing attention is the coin’s retest of a crucial technical level inside a long-standing chart pattern — a move that could define its next big direction.
 Source: Coinmarketcap
Descending Triangle in Play
On the daily chart, POLYX has been consolidating within a descending triangle pattern — a structure that often points to uncertainty and increased volatility. While it’s traditionally viewed as bearish, such patterns can also precede sharp countertrend rebounds before any decisive breakdown.
The latest leg lower started after a rejection at the descending trendline near $0.1435 on September 16. From there, POLYX dropped sharply toward the lower boundary of the triangle. As of today, the token touched support around $0.1098, where buyers stepped in to defend the level. It is now trading close to $0.1136, holding just above this pivotal support zone.
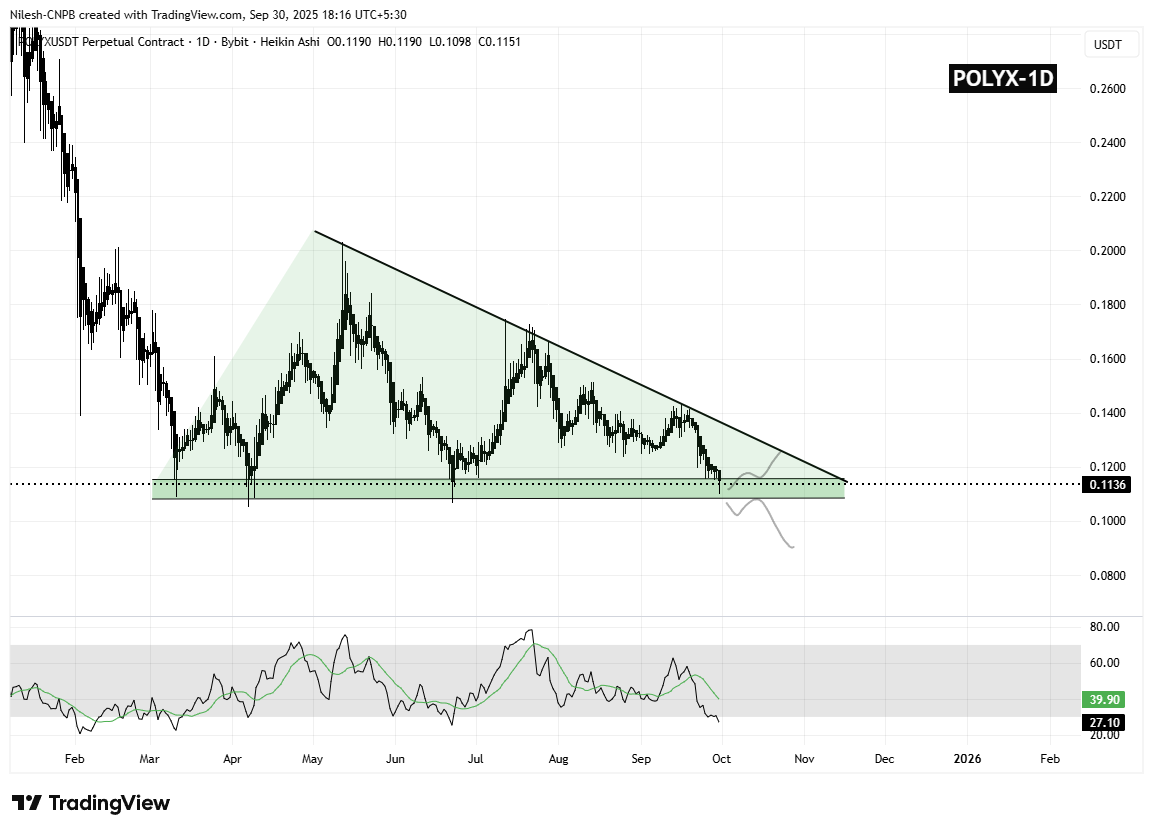 Polymesh (POLYX) Daily Chart/Coinsprobe (Source: Tradingview)
Historically, the $0.1050–$0.1155 range has acted as a strong demand zone, repeatedly halting selloffs over the past several months. This makes it a make-or-break area for bulls hoping to preserve the broader market structure.
What’s Next for POLYX?
If bulls manage to defend this support range and push the price back above $0.12, momentum could quickly shift. In that case, POLYX might retest the descending trendline resistance near $0.1254. A clean breakout above this line could unlock higher targets, while failure may lead to another pullback into the support zone.
On the downside, a break below $0.1050 would invalidate the support base and likely open the door for a deeper correction.
One encouraging sign for bulls is that the RSI has dropped into oversold territory, which increases the probability of at least a short-term rebound from current levels.
Bottom Line
POLYX is at a critical crossroads. The descending triangle suggests pressure is mounting, but the presence of strong multi-month support — coupled with oversold momentum indicators — gives bulls a fighting chance at sparking a rebound. Traders should watch closely how price reacts around the $0.1050–$0.1155 zone in the coming sessions.