
What will be the peak of Ethereum?

If the bull market continues, Ethereum could surpass $8,000.
If the bull market continues, Ethereum may reach above $8,000.
Written by: Michael Nadeau
Translated by: Luffy, Foresight News
Tom Lee recently stated at Korea Blockchain Week that Ethereum's mid-term target price is $60,000, and said that Ethereum is in a supercycle lasting 10-15 years.
If his judgment is correct, this supercycle will advance in waves, spanning multiple cycles, accompanied by alternating bull and bear markets.
Currently, we are in a bull market, but the bull market will not last forever.
Looking back at history, Ethereum fell by 94% in 2018 and by 80% in 2022, so we have reason to predict that there will still be a significant correction in the future.
At present, we cannot determine when the correction will occur, but by tracking several key indicators, we can refer to the levels Ethereum reached in past cycles to provide a basis for future trends.
Key Indicator Analysis and Price Targets
200-Week Moving Average
Data source: The DeFi Report
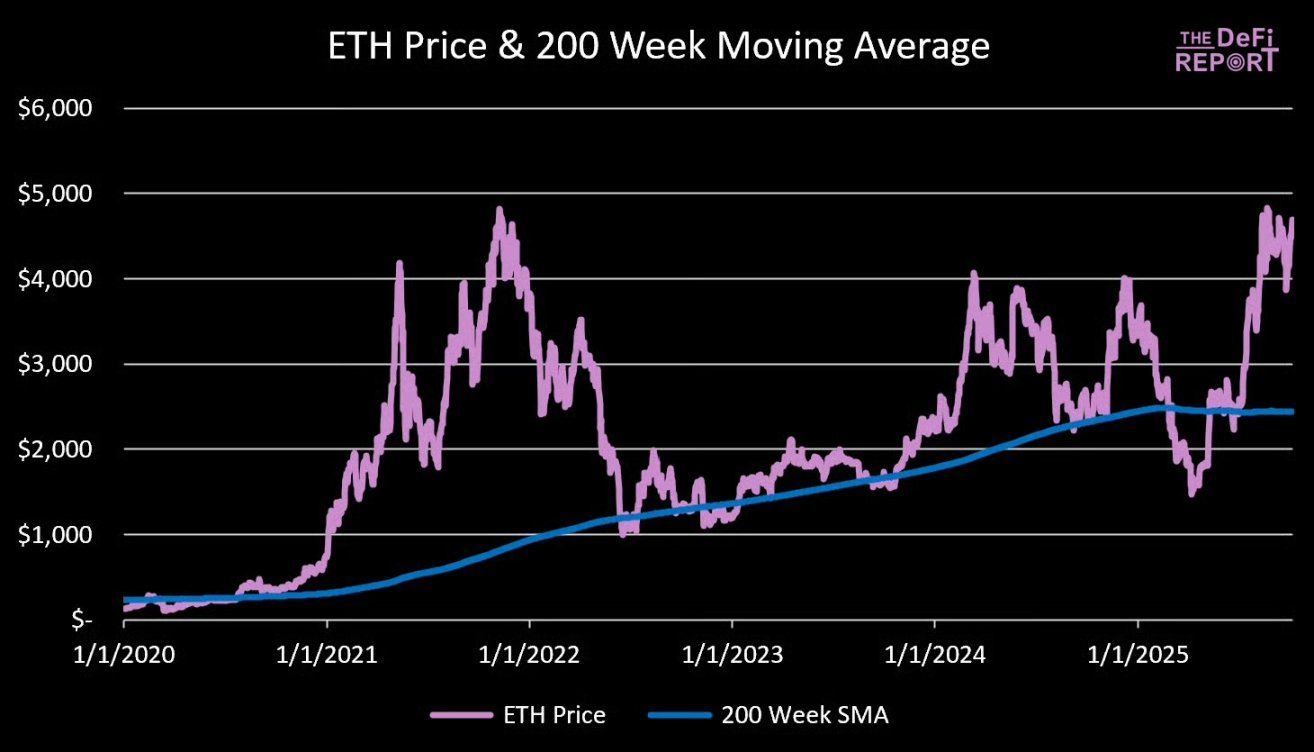
Currently, Ethereum is trading 92% above its 200-week moving average ($2,400).
In the 2021 cycle, at the market peak, Ethereum was 492% above its 200-week moving average.
Scenario analysis:
- 200% above the 200-week moving average: Ethereum price is $7,300
- 250% above the 200-week moving average: Ethereum price is $8,500
- 300% above the 200-week moving average: Ethereum price is $9,800
- 350% above the 200-week moving average: Ethereum price is $11,000
- 400% above the 200-week moving average: Ethereum price is $12,200
Note: The 200-week moving average is a dynamic indicator, but over time, we are gradually replacing price data from about four years ago in the $3,000-$4,000 range for Ethereum. Therefore, by the end of this year, the volatility of the 200-week moving average is expected to be very small.
Ethereum Price to Realized Price Ratio
Data source: The DeFi Report, Glassnode
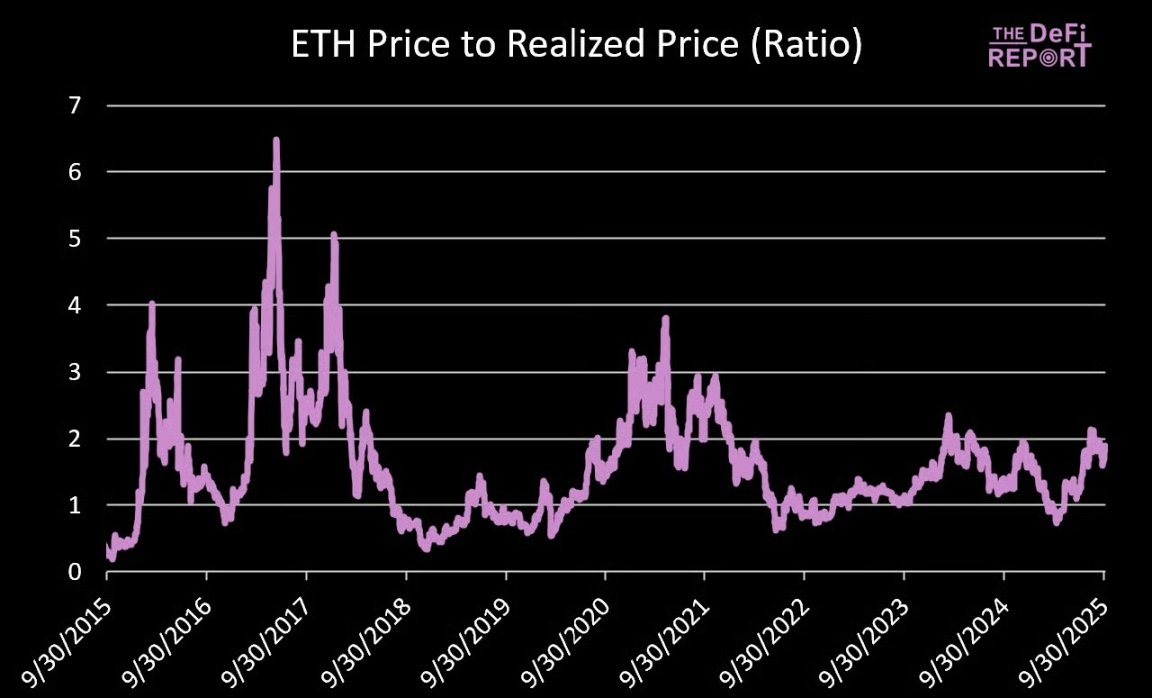
The realized price can serve as an alternative indicator for cost basis. Since January 1, 2017, the average ratio of Ethereum price to realized price has been 1.6. The current ratio is 1.9.
In the 2017 cycle, the peak ratio was 5; in the 2021 cycle, the peak ratio was 3.5 in April and 2.9 in November.
Scenario analysis (assuming the ratio reaches 2.9):
- If realized price is $3,000: Ethereum price is $8,700
- If realized price is $3,500: Ethereum price is $10,200
- If realized price is $4,000: Ethereum price is $11,600
MVRV Z-Score
Data source: The DeFi Report, Glassnode
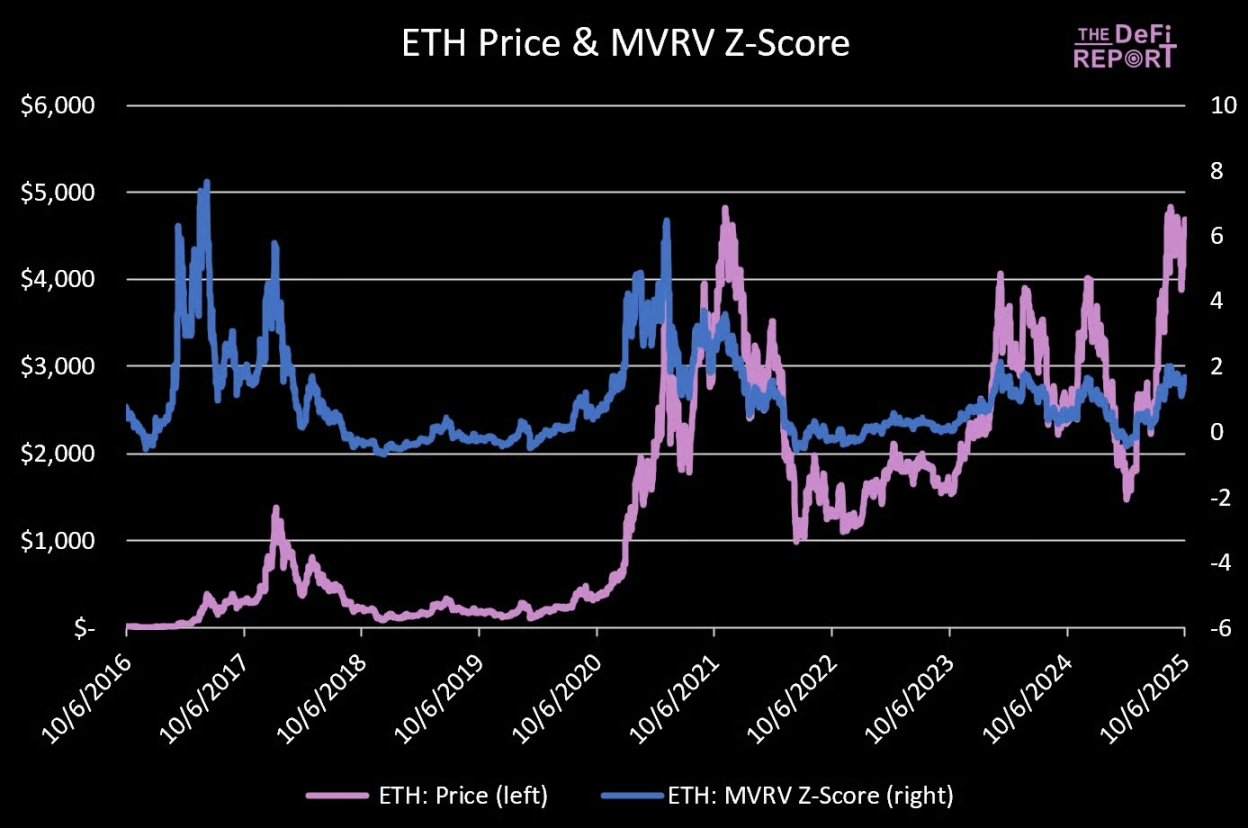
The Z-score measures how many "volatility units" the market value is above or below the on-chain cost basis. The higher the Z-score, the hotter the market; a negative Z-score indicates the market is undervalued.
Since January 1, 2017, Ethereum's average Z-score has been 0.99, indicating an overall optimistic market.
The current Z-score is 1.66, higher than the historical average but not yet overheated.
In the 2021 cycle, the Z-score peaked at 6.5 in April and 3.48 in November.
Scenario analysis:
- If Z-score is 2.21: Ethereum price is $7,000
- If Z-score is 2.77: Ethereum price is $8,000
- If Z-score is 3.33: Ethereum price is $9,000
- If Z-score is 3.9: Ethereum price is $10,000
Note: Assuming realized price increases by 22% (to $3,000) by the end of this year. For reference, since April this year, realized price has already increased by 24%.
Ethereum to Bitcoin Market Cap Ratio
Data source: The DeFi Report
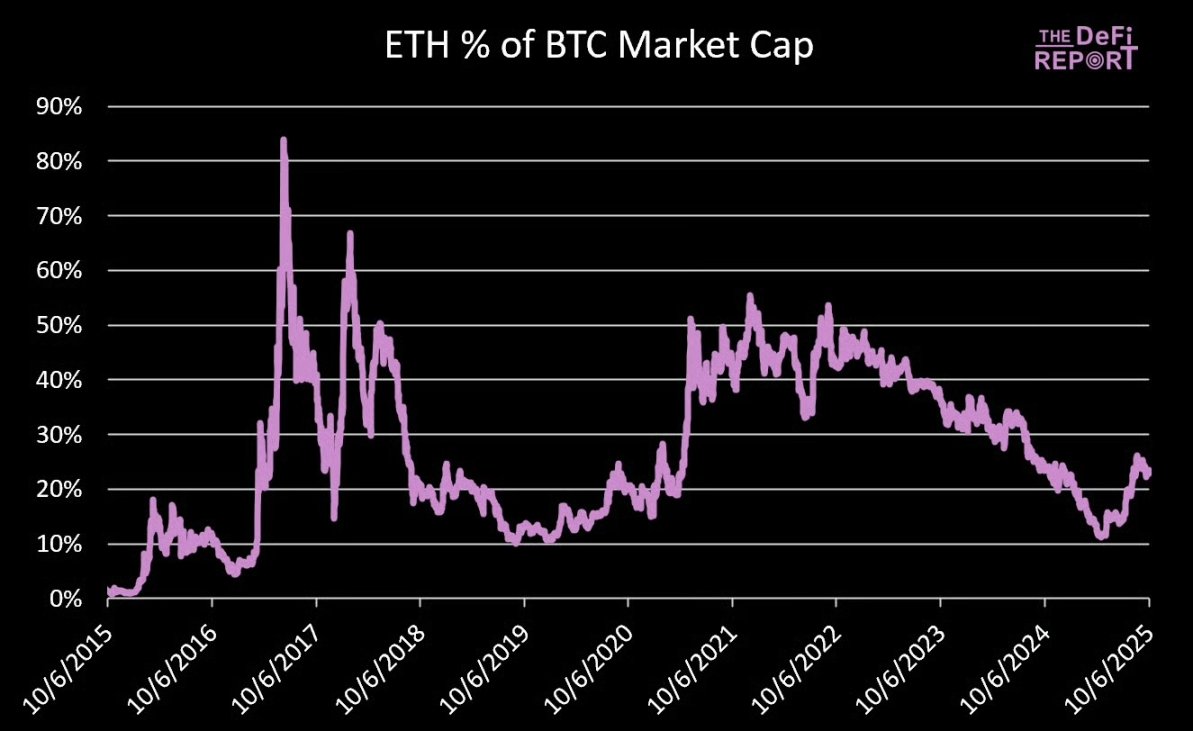
Currently, Ethereum's market cap is about 23.4% of Bitcoin's market cap.
In November 2021, Ethereum's market cap reached 55.5% of Bitcoin's market cap.
If Bitcoin's price reaches $150,000 (up 23% from now), its market cap will reach $3 trillion.
Scenario analysis:
- If Ethereum's market cap is 35% of Bitcoin's: Ethereum total market cap is $1.05 trillion, corresponding to a price of $8,658
- If Ethereum's market cap is 45% of Bitcoin's: Ethereum total market cap is $1.35 trillion, corresponding to a price of $11,132
- If Ethereum's market cap is 55% of Bitcoin's: Ethereum total market cap is $1.64 trillion, corresponding to a price of $13,559
The core question is whether Bitcoin will see a significant surge. Compared to the previous cycle, will Ethereum's rise relative to Bitcoin be moderate or explosive?
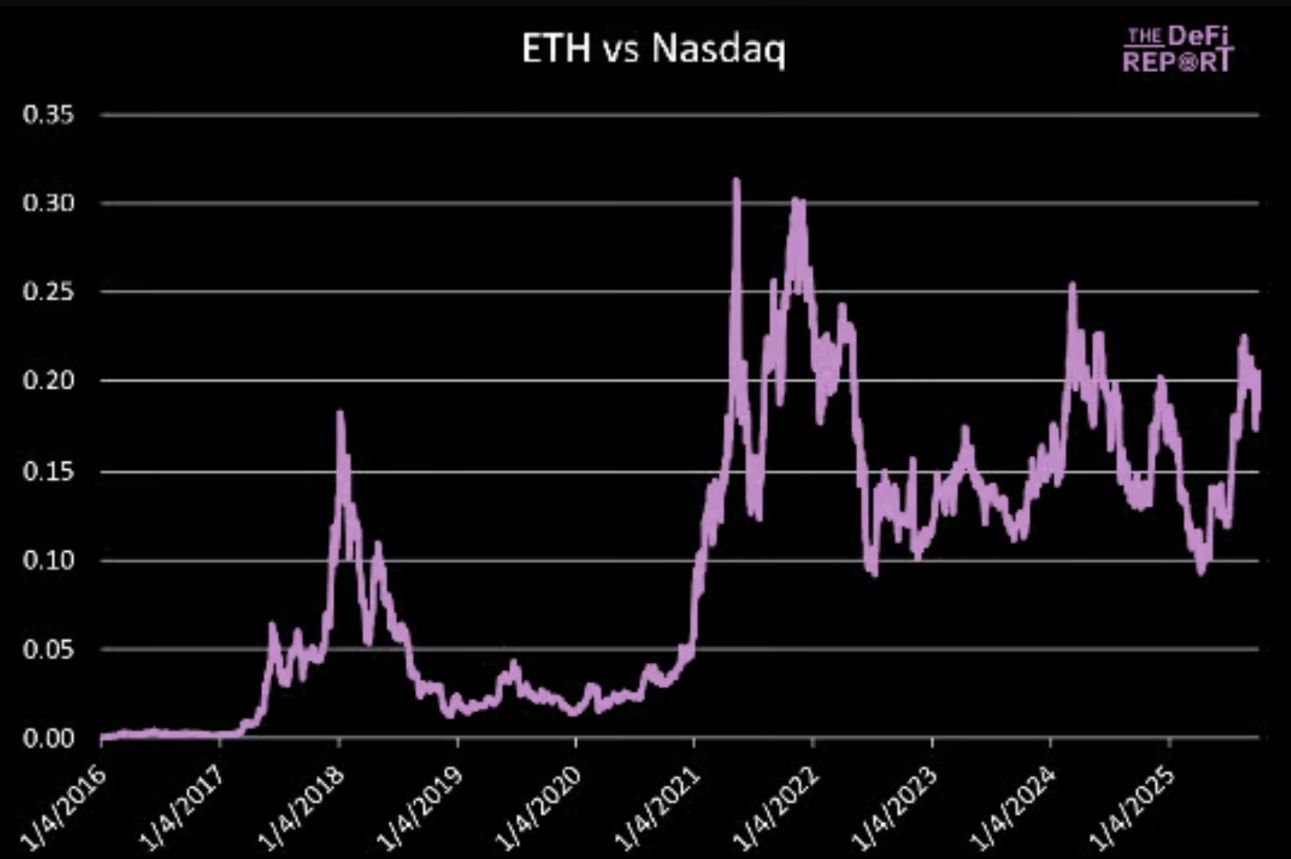
Ethereum to Nasdaq Index Ratio
Data source: The DeFi Report
In May and November 2021, the peak ratios of Ethereum to the Nasdaq Index were 0.31 and 0.30, respectively.
The current ratio is 0.20, and the current Nasdaq Index is at 22,788 points.
If the Nasdaq Index rises 5% by the end of this year (up 23% for the whole year), it will reach 23,927 points.
Ethereum price scenario analysis:
- If the ratio is 0.25: Ethereum price is $5,981
- If the ratio is 0.30: Ethereum price is $7,178
- If the ratio is 0.35: Ethereum price is $8,374
- If the ratio is 0.40: Ethereum price is $9,570
Our baseline assumption is that the upward trend of the Ethereum to Nasdaq Index ratio will continue with the cycle, and this cycle will see a new high (exceeding 0.30).
Summary
Our basic assumptions are as follows:
- Ethereum price is 250% above the 200-week moving average, corresponding to a price of $8,500;
- Realized price reaches $3,000, and if the price-to-realized price ratio is 2.9, Ethereum price is $8,700;
- Ethereum's market cap reaches 35% of Bitcoin's, and if Bitcoin's price is $150,000, Ethereum price is $8,600;
- Ethereum to Nasdaq Index ratio hits a new high, and if the ratio is 0.35, Ethereum price is $8,300.
If the bull market continues, Ethereum's price may break through $10,000; if the market turns bearish and Bitcoin's peak rise is limited, Ethereum will also come under pressure.
Meanwhile, as market sentiment heats up, more and more discussions about "cycle extension" are emerging, which reminds me of the "supercycle" narrative that was popular in 2021.
As we have said before, the baseline assumption remains: Ethereum will reach the peak of this cycle within this quarter.
Disclaimer: The content of this article solely reflects the author's opinion and does not represent the platform in any capacity. This article is not intended to serve as a reference for making investment decisions.
You may also like
Overnight U.S. Stocks | All Three Major Indexes Fall, 10-Year Treasury Yield Hits Nearly 20-Year High, Oil Prices Volatile, Gold Drops Nearly 4%
At market close, the Dow Jones Industrial Average fell 347.11 points, or 0.67%, to 51,481.51 points; the S&P 500 Index dropped 59.72 points, or 0.77%, to 7,683.69 points; and the Nasdaq Composite Index declined 248.34 points, or 0.92%, to 26,820.38 points.
Trump Targets Key Midterm State Iowa: Announces $15 Billion Steel Plant Project to Create 8,000 Jobs
Trump stated that once completed, the factory will have an annual steel production capacity of 10 million tons, making it "the largest steel mill ever in the United States." White House officials noted that steel production could begin as early as 2030, with an estimated 8,000 jobs created. However, the economic benefits of the factory will not be realized before the November election this year. Iowa, as a key agricultural state, is currently facing dual pressures from high diesel prices and tariff disputes, making Trump’s political intentions evident with this move.
Pound Sterling edges higher as the BoE's deputy governors lean toward a hike
Euro slips back to its summer low as ECB President Lagarde urges measured hikes
Crypto prices
More


