
Will Bitcoin Drop Below $100,000 Soon? 3 Charts Hold the Answer

Bitcoin’s price dropped to $102,000 before rebounding to $111,000, but on-chain data shows strong hands held firm. A flip in RSI divergence now hints that the worst may be over, with three charts suggesting Bitcoin’s short-term floor might stay well above $100,000.
Bitcoin’s latest correction rattled traders. BTC price dropped from above $120,800 to nearly $102,000 before bouncing back almost 9% to over $111,000. While altcoins like Ethereum and XRP fell over 13%, Bitcoin’s decline of 7% at press time shows it held up much better — hinting at underlying strength even amid heavy liquidations.
Still, the big question remains: Can Bitcoin stay above $100,000, or will the price drop extend lower than this key psychological level soon? Three charts hold the answer.
Holders Rise and Veterans Stay Calm Amid The Crash
The first sign of support comes from on-chain holder behavior.
Despite the crash, the total number of Bitcoin holders increased from 56.92 million to 56.98 million since yesterday, showing that investors were adding exposure as prices dropped. That’s typical of dip-buying conviction, not panic selling.
Want more token insights like this? Sign up for Editor Harsh Notariya’s Daily Crypto Newsletter here.
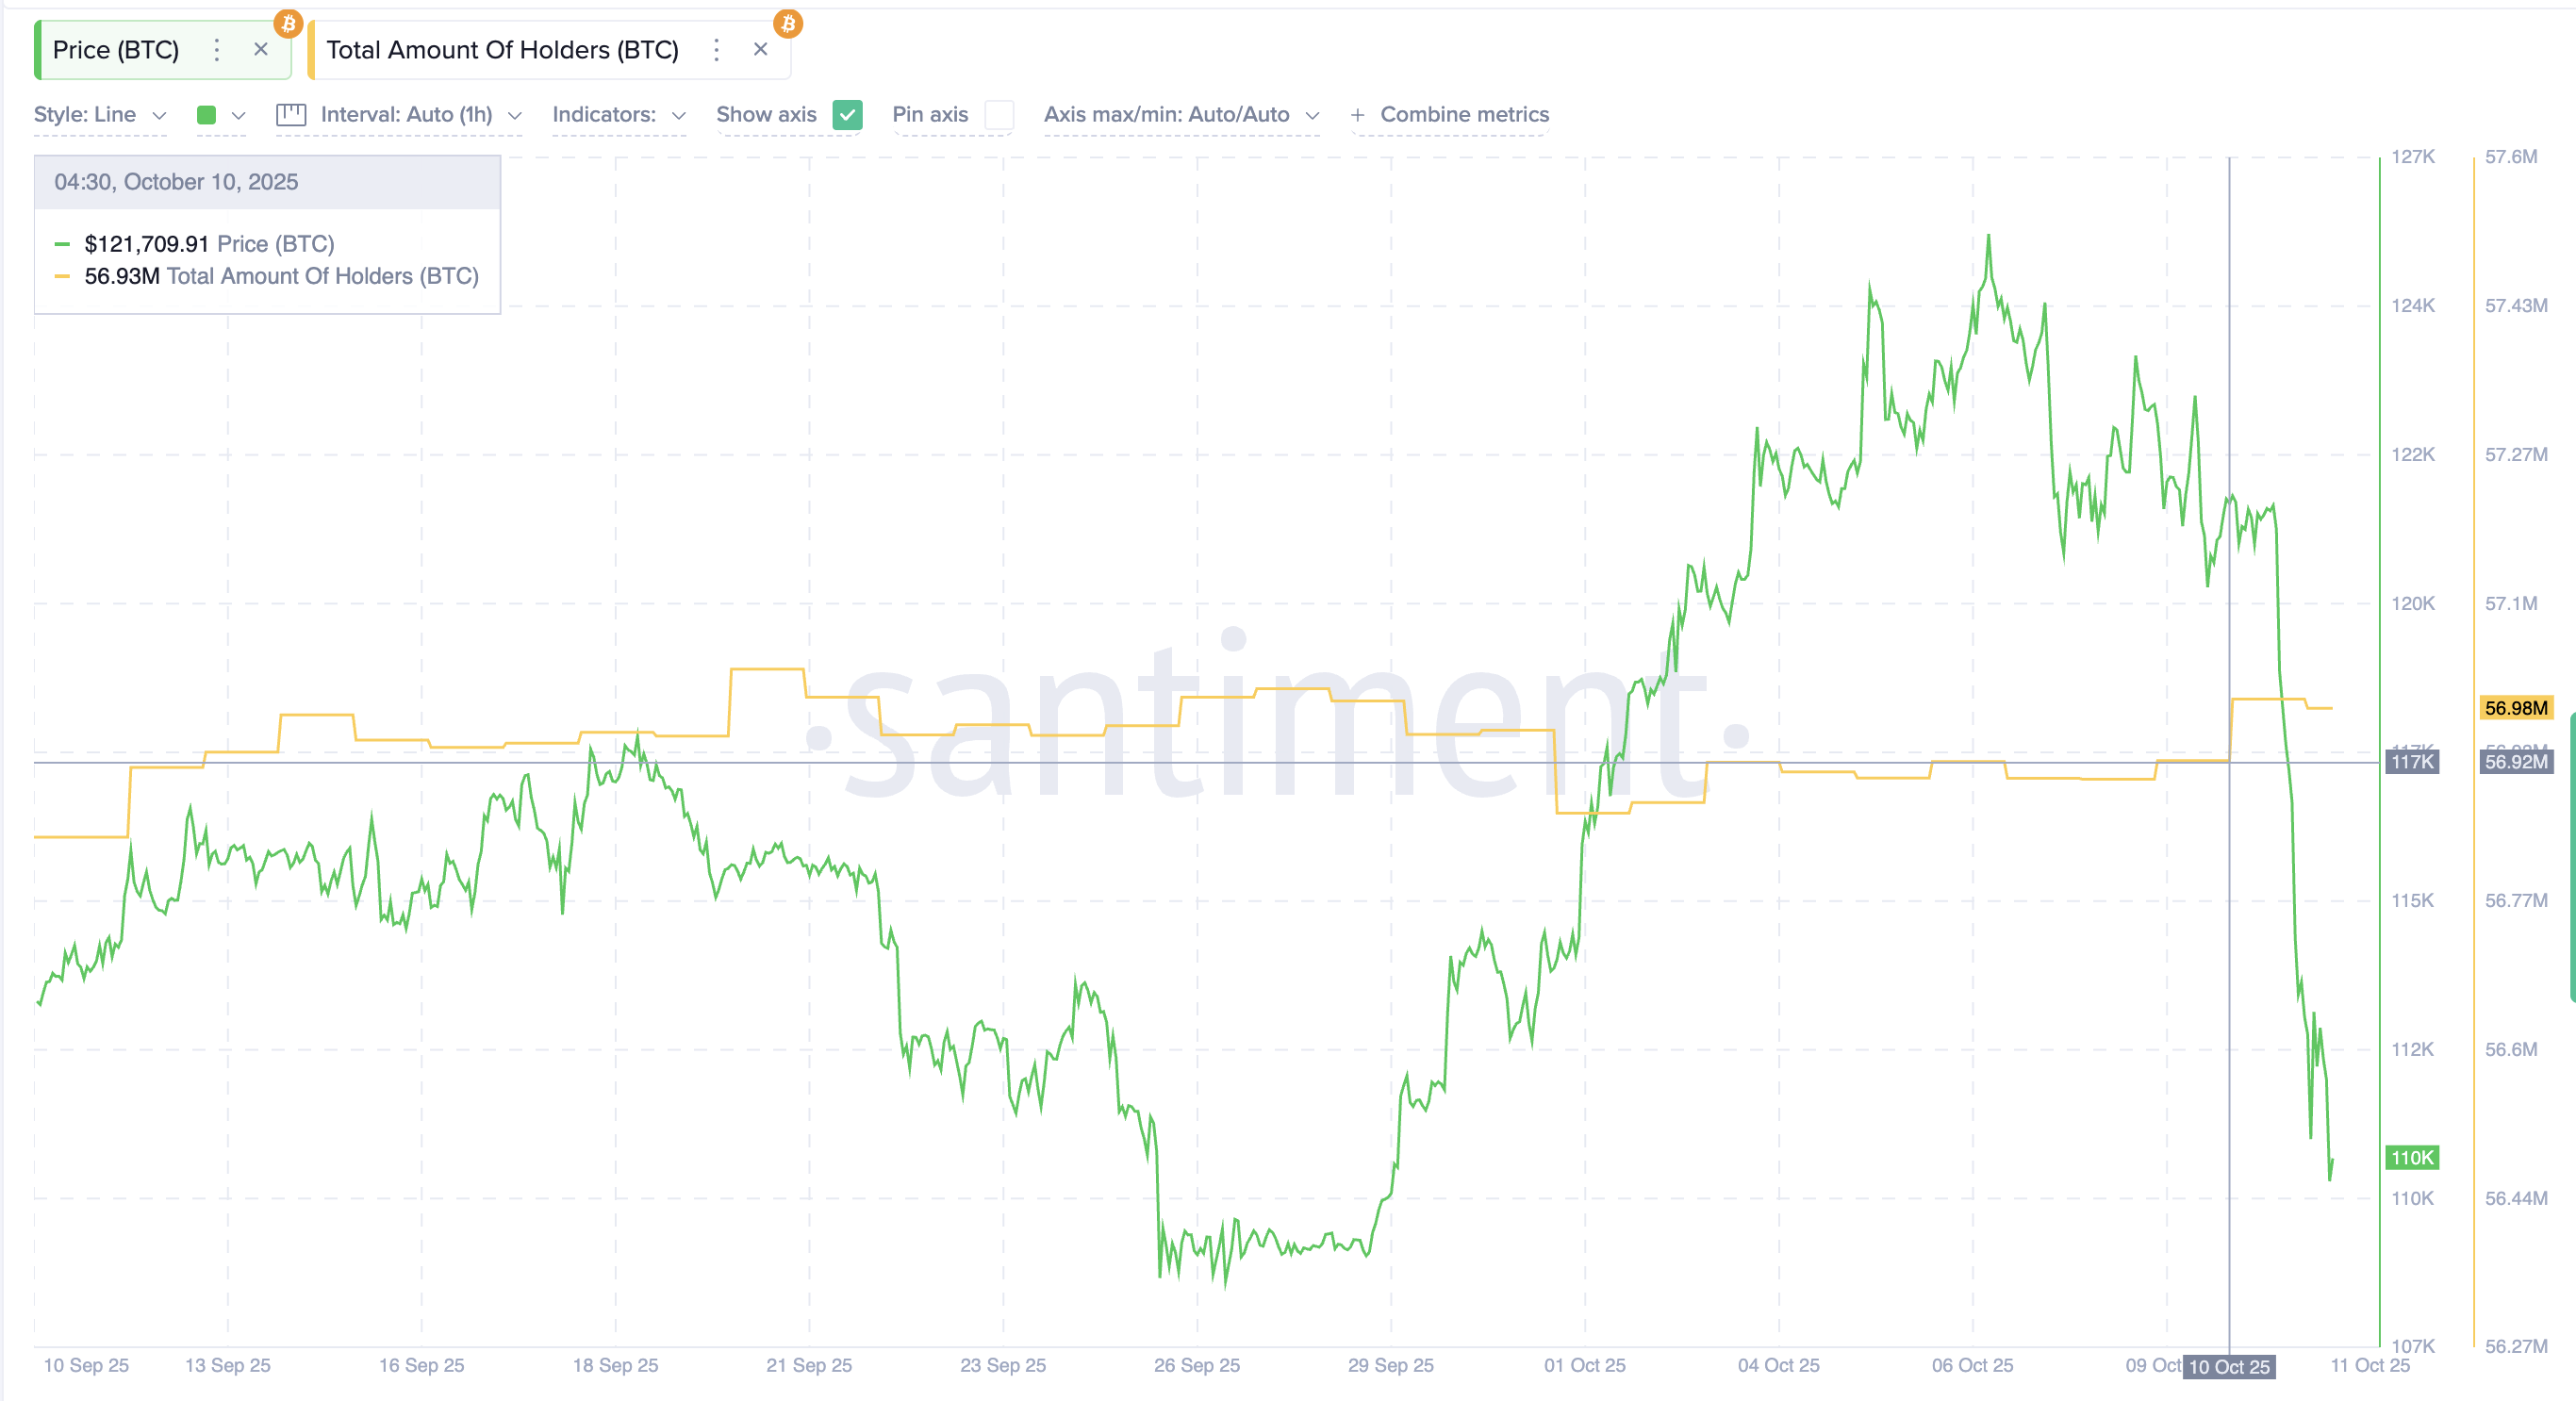 Bitcoin Holders Increase:
Santiment
Bitcoin Holders Increase:
Santiment
The Spent Coins Age Bands (SCAB) back this up. This metric tracks the age of coins being moved — in short, whether older or newer holders are spending their Bitcoin.
When the crash began on October 10, the overall SCAB stood around 17,100 BTC, while the 180–365–day band (red) was near 9,995 BTC, and the 365–day–2–year band (blue) was close to 2,452 BTC.
As the sell-off unfolded, the overall SCAB rose sharply to 23,086 BTC, confirming a spike in spending activity among newer holders.
In contrast, the red band eased slightly to 9,646 BTC, and the blue band dropped sharply to 535 BTC — clear evidence that long-term holders stayed quiet.
This means that the panic selling was mostly led by newer or mid-term wallets, while the veteran holders continued holding. And veterans usually hold on unless they expect huge price drops, like something below the $100,000 mark.
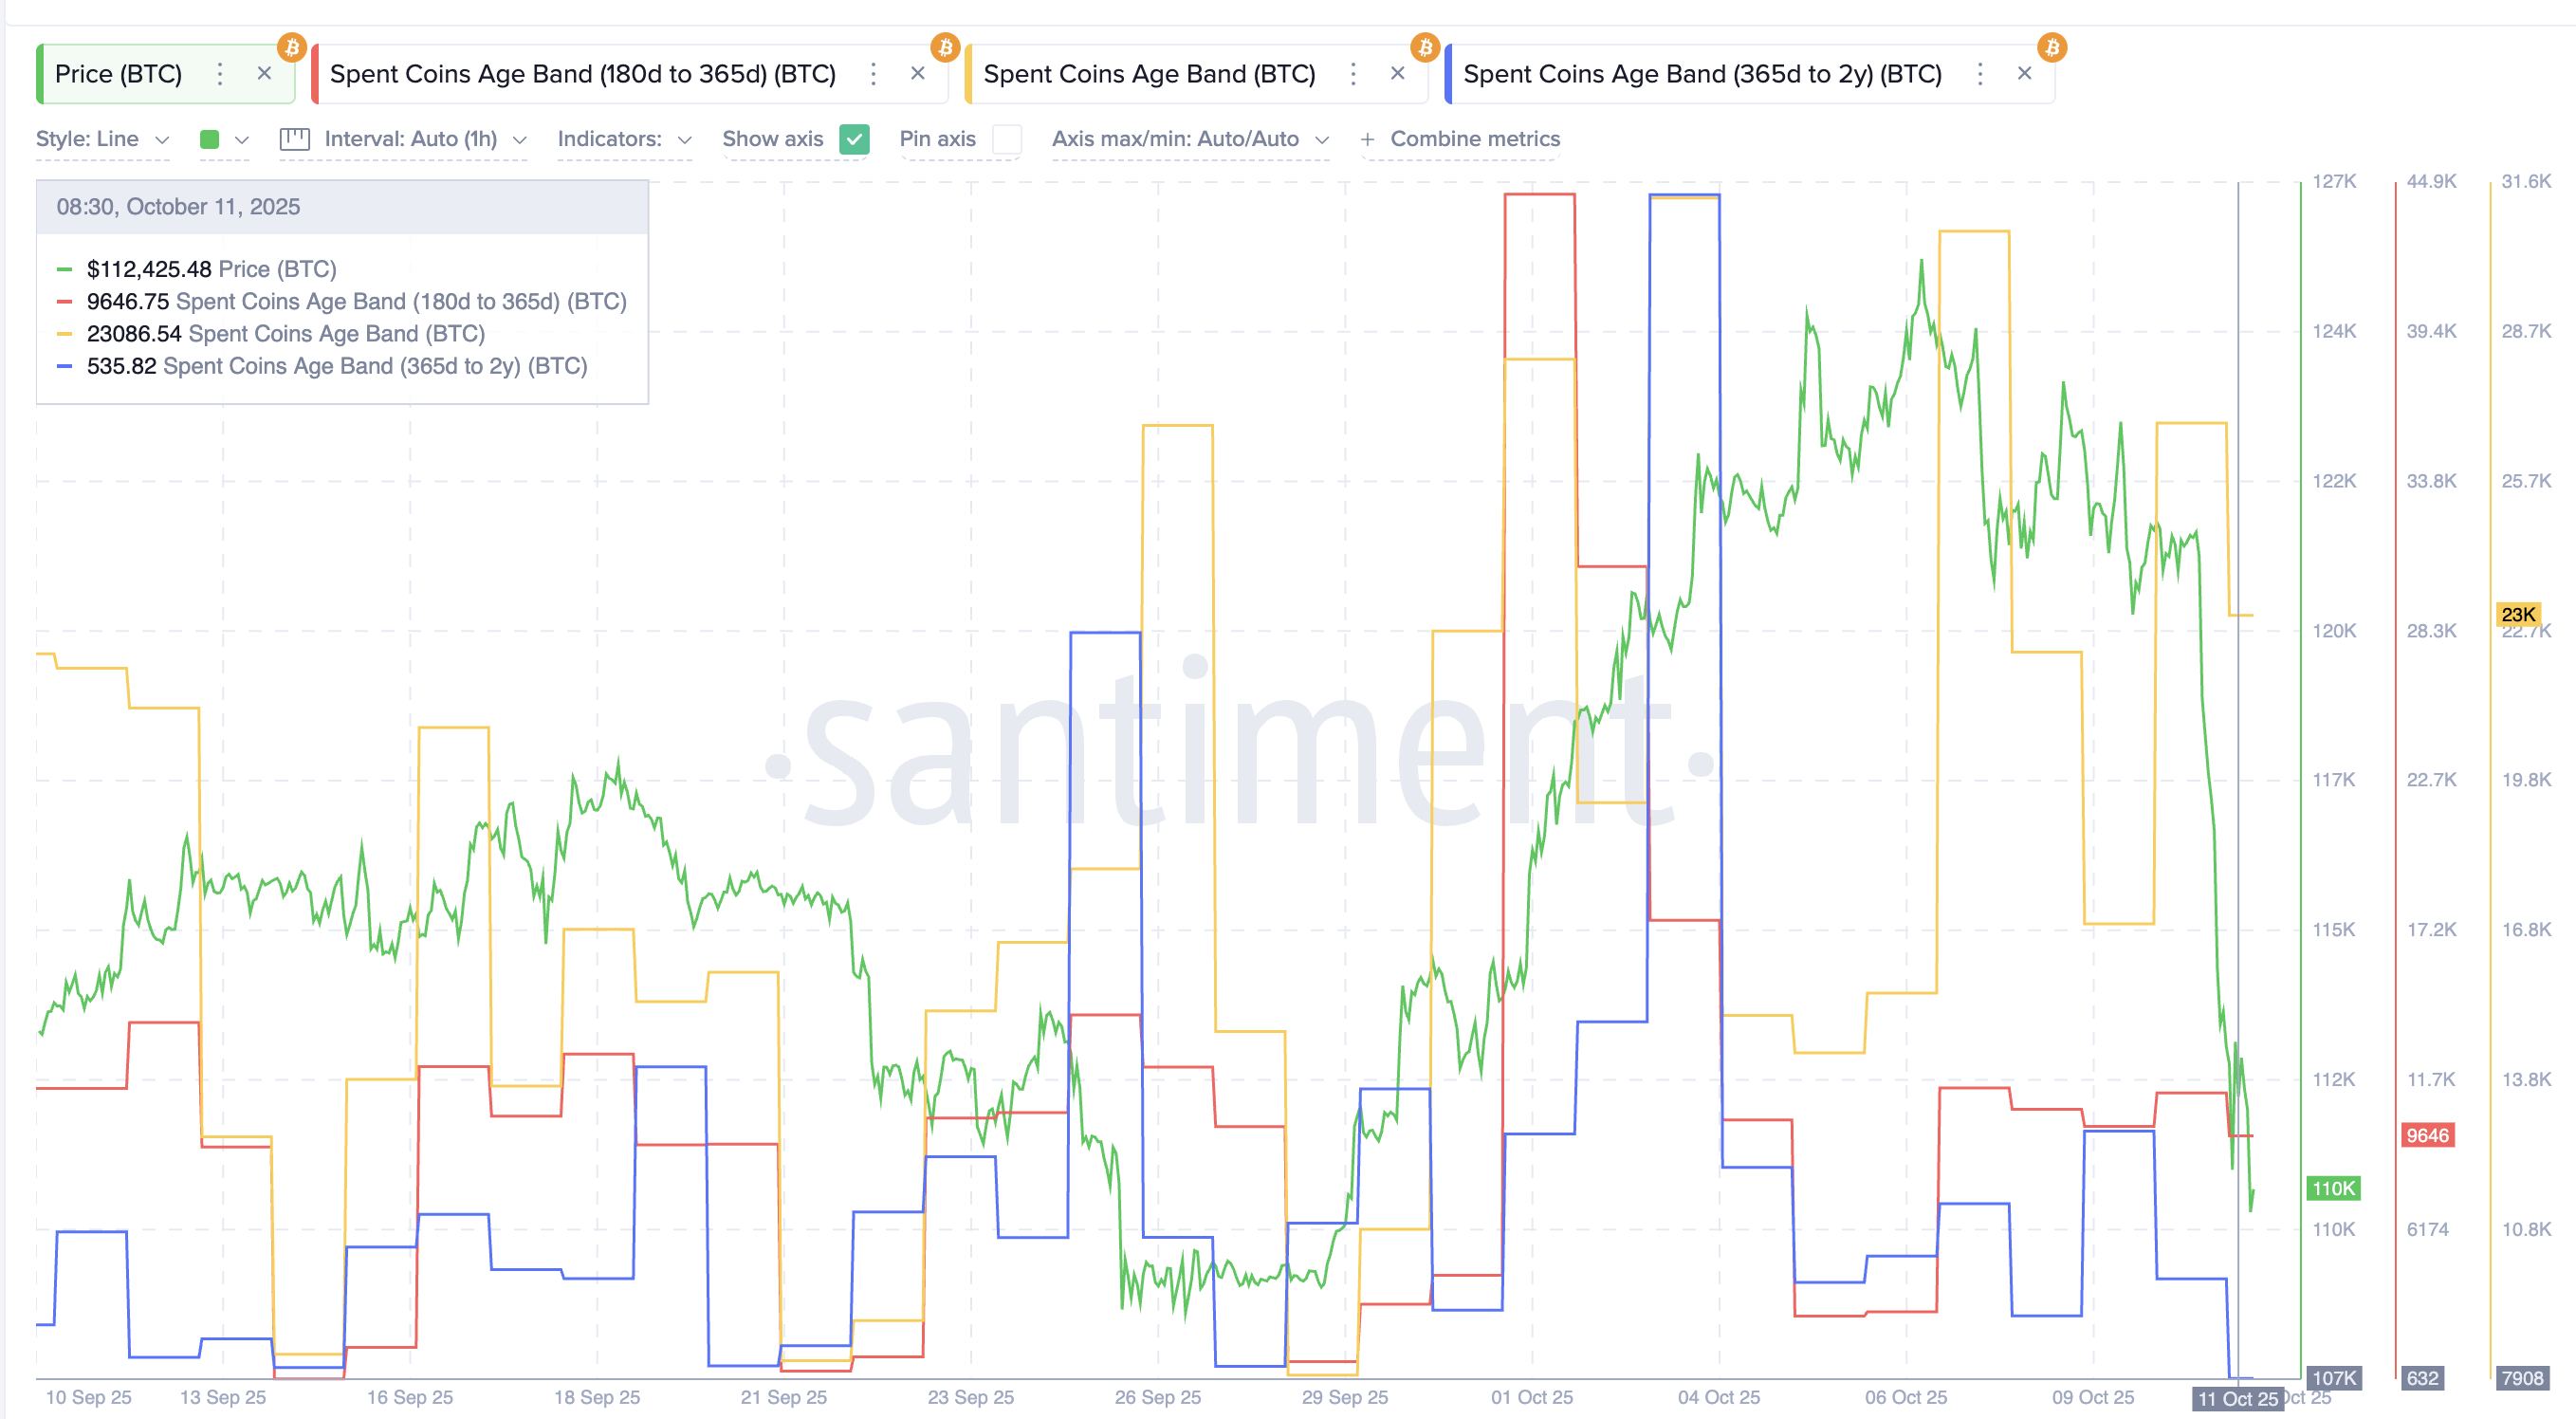 Bitcoin Spent Coins Age Band Metric:
Santiment
Bitcoin Spent Coins Age Band Metric:
Santiment
When long-term holders stay inactive and the total holder base grows, it usually signals that strong hands are replacing the market’s weak hands. That’s the kind of reset that stabilizes a sentiment-driven drop before the next leg higher.
Bitcoin Price Setup Flips From Bearish to Bullish
Bitcoin’s price action tells a clearer story. The recent crash wasn’t purely sentiment-driven — it followed a technical setup that often marks turning points.
The key driver was a bearish divergence on the Relative Strength Index (RSI), which measures buying and selling momentum on a scale of 0 to 100.
A divergence forms when the RSI and price move in opposite directions — for example, when the price makes a higher high but the RSI makes a lower high. This pattern usually signals that momentum is weakening before a reversal.
That’s exactly what happened between mid-July and early October. Bitcoin made new highs on the chart, but RSI failed to confirm them, making a lower high.
The result was a sharp 19.1% correction (yesterday), almost identical to an earlier divergence-led drop this year of over 14%. These setups show how strongly Bitcoin reacts to RSI signals.
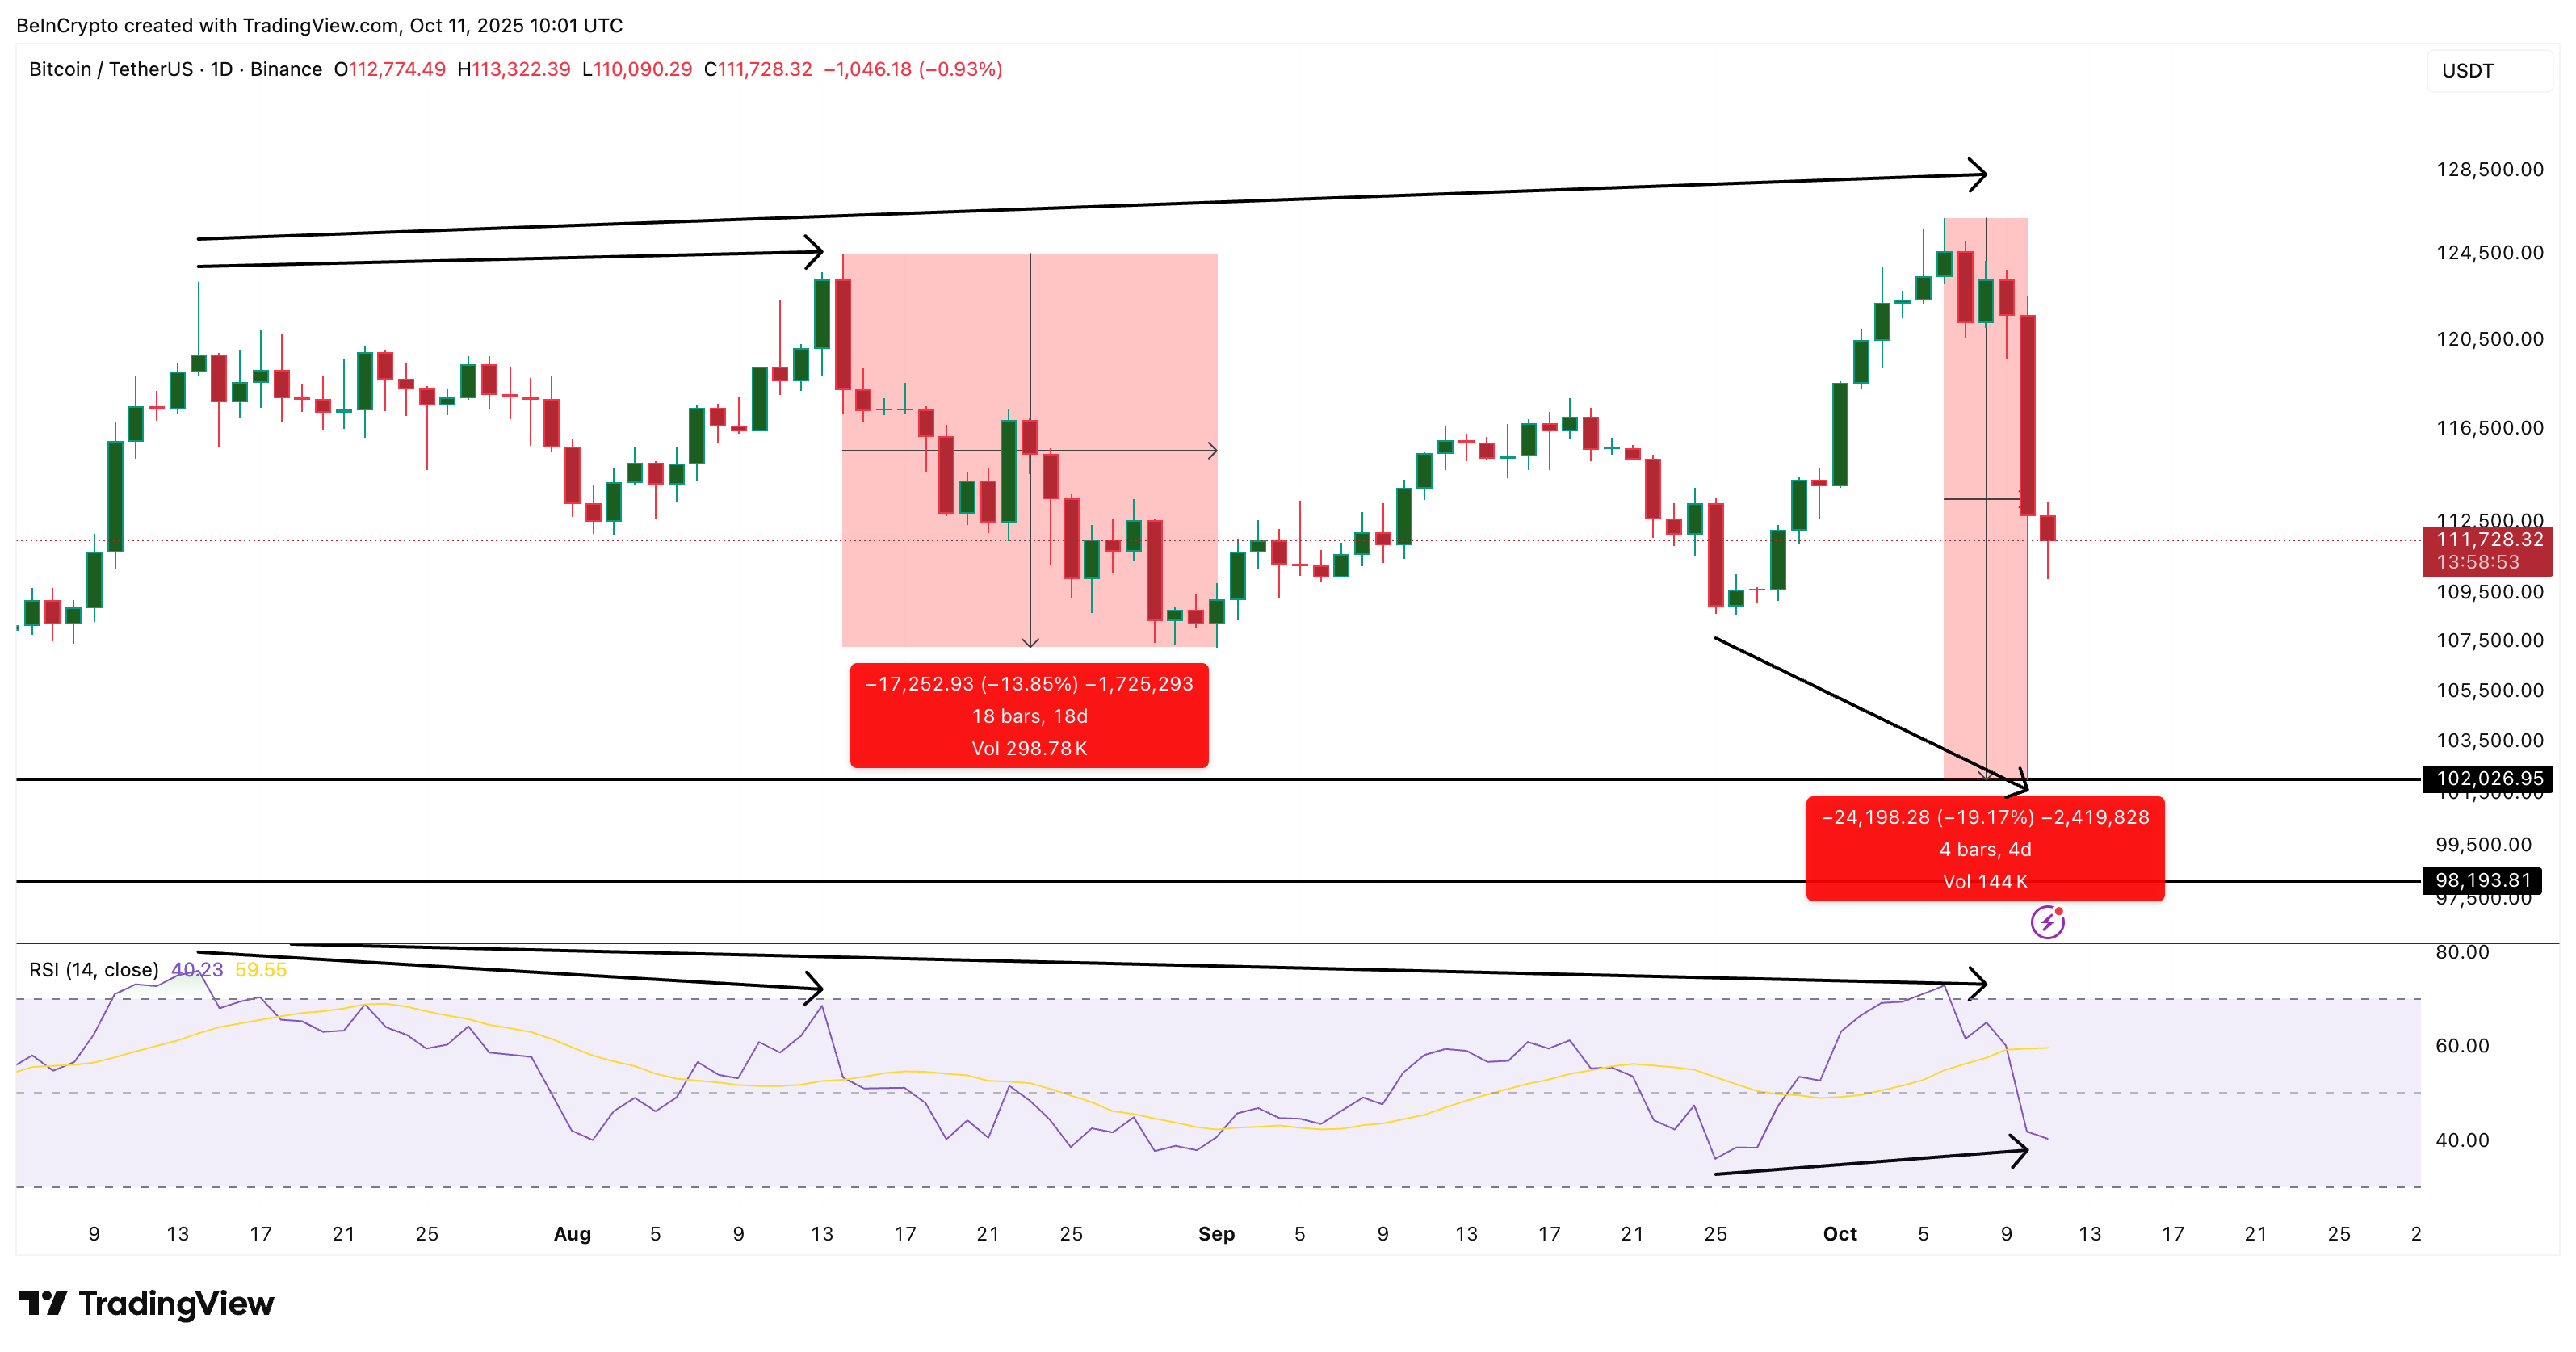 Bitcoin Price Divergence:
TradingView
Bitcoin Price Divergence:
TradingView
Now, the pattern has flipped. Between September 25 and October 11, a bullish divergence appeared — price made a lower low while RSI made a higher low. This suggests that selling pressure is losing strength, and momentum may be quietly building for a rebound.
At press time, Bitcoin trades near $111,600, aligning with the 0.5 Fibonacci level ($111,400). A daily close above this level could confirm renewed strength toward $113,600, $116,800, and $120,800.
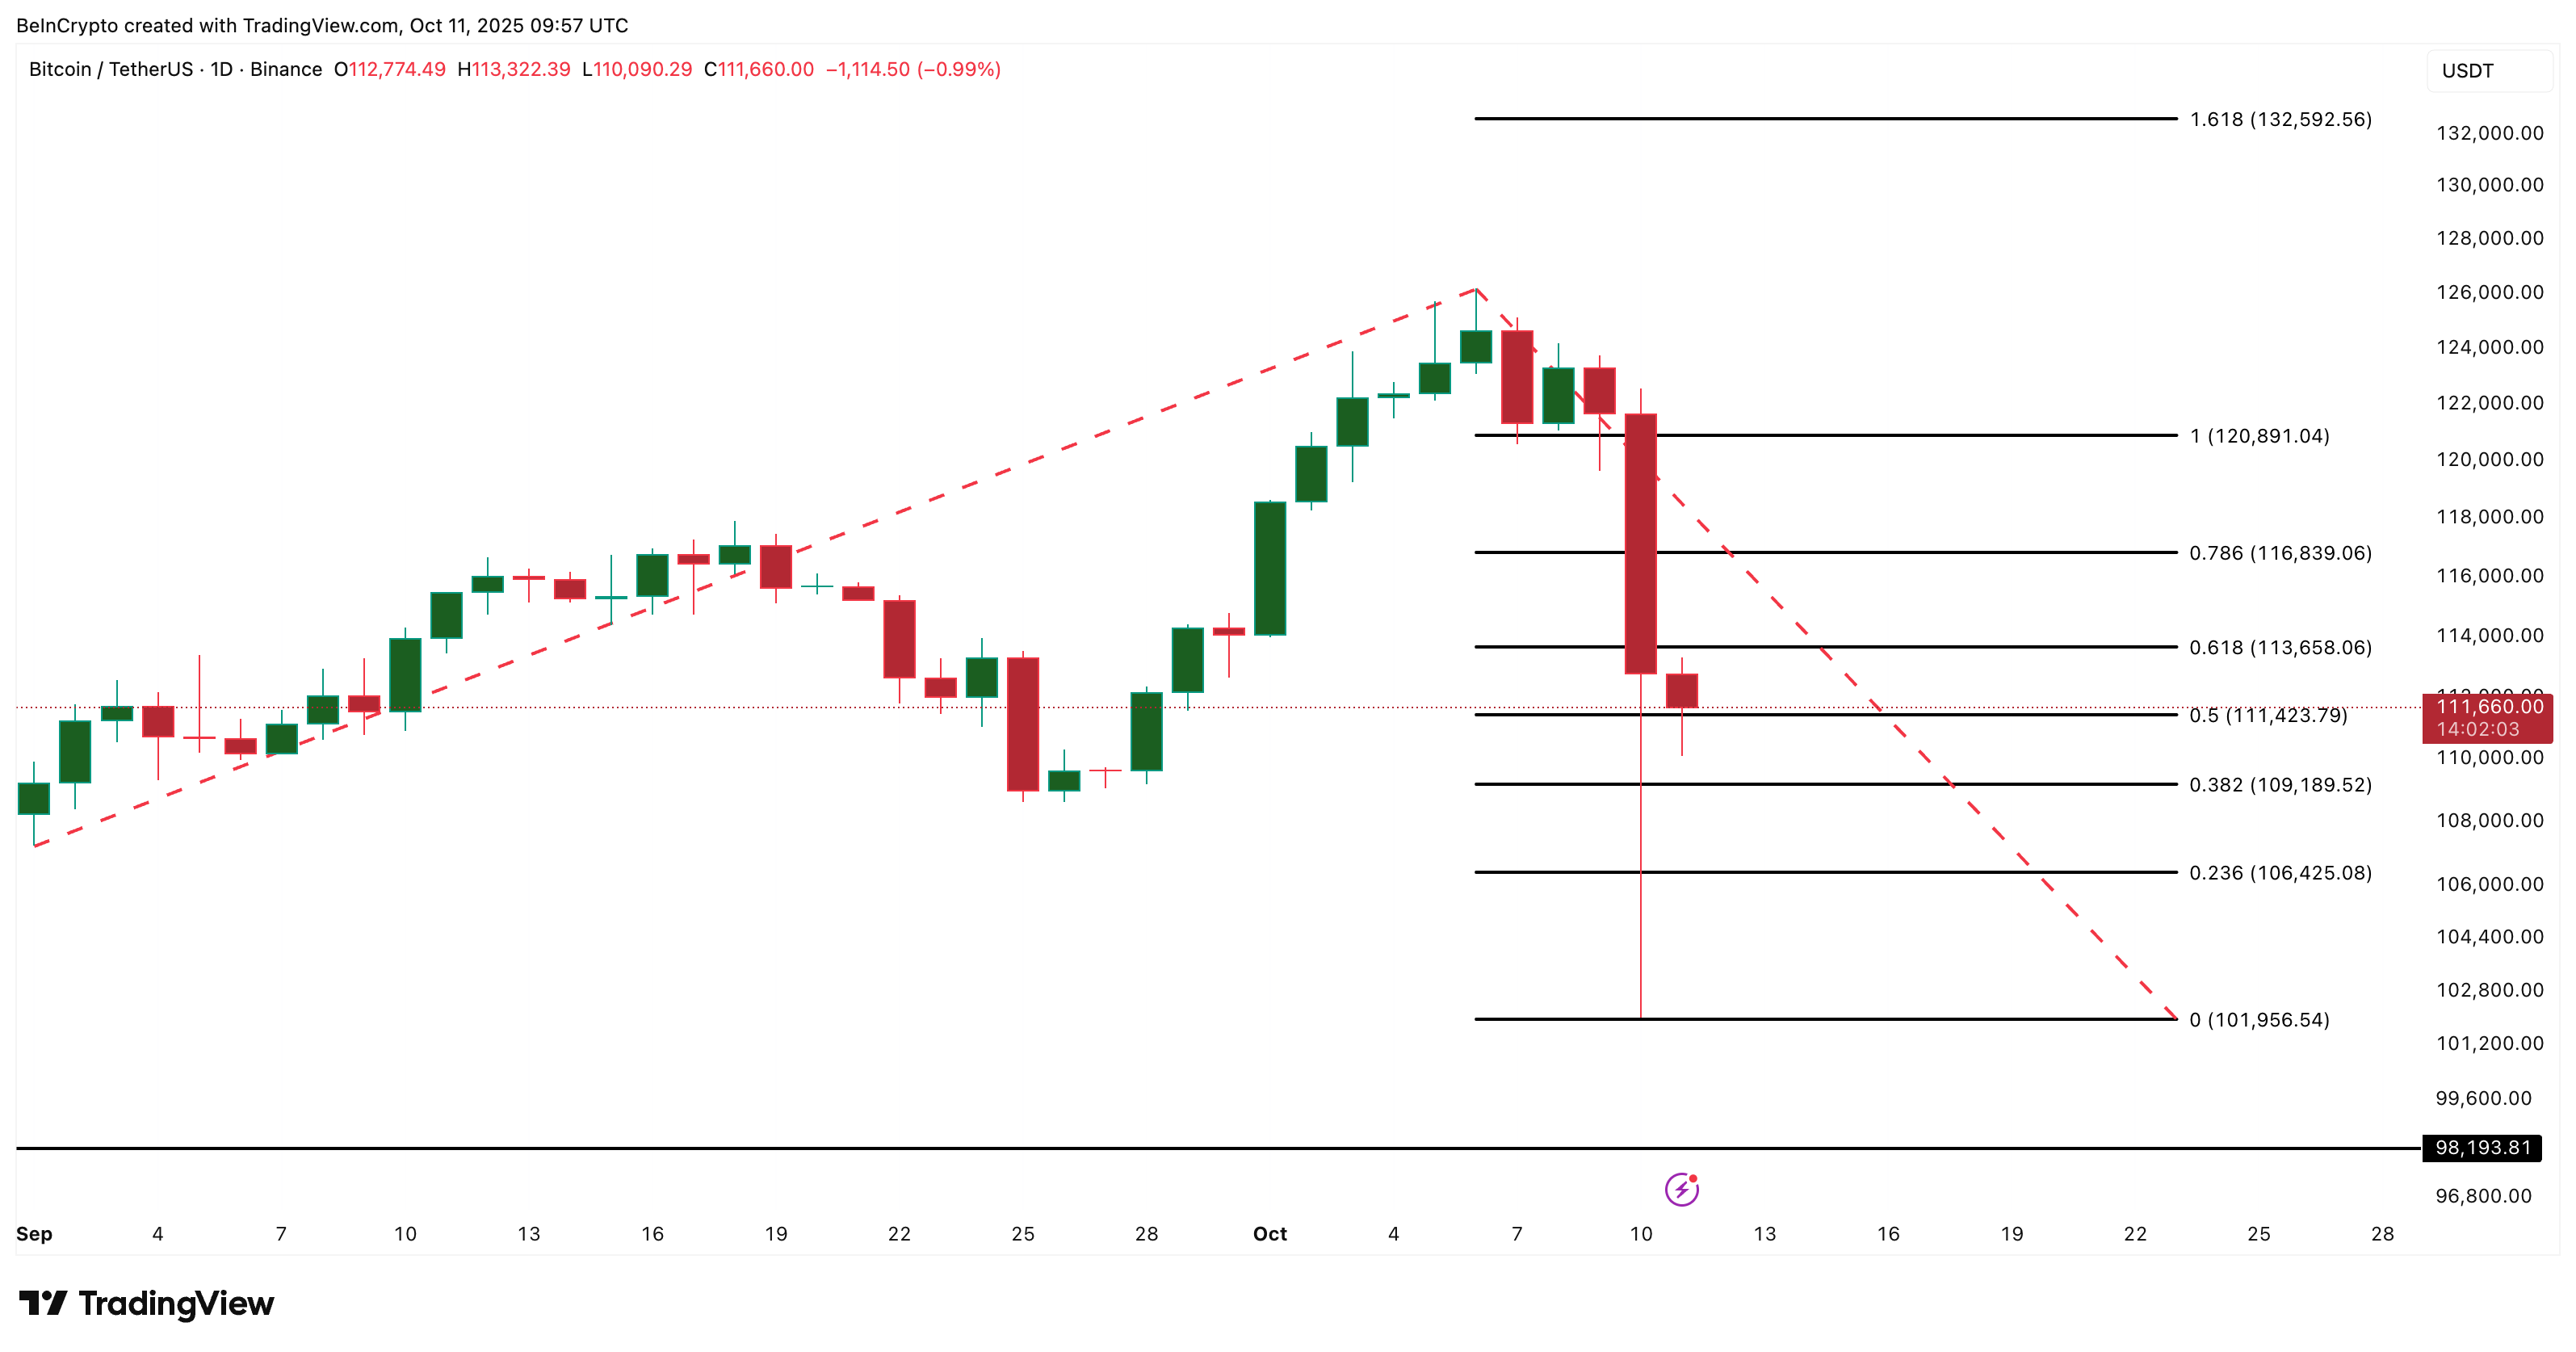 Bitcoin Price Analysis:
TradingView
Bitcoin Price Analysis:
TradingView
The invalidation point sits below $109,100, with downside exposure limited to $106,400 and $101,900, making a drop below $100,000 unlikely in the short term. Only a daily candle close under $101,900 can push the Bitcoin price under $100,000.
Disclaimer: The content of this article solely reflects the author's opinion and does not represent the platform in any capacity. This article is not intended to serve as a reference for making investment decisions.
You may also like
Chainlink (LINK) Price Tests a Crucial Resistance—Is a Rise to $20 on the Horizon
AMD acquires World Labs for $8.2 billion, Fei-Fei Li appointed as Chief Scientist
AMD acquires AI startup World Labs in an all-stock transaction valued at approximately $8.2 billion. World Labs was co-founded by AI pioneer Fei-Fei Li and focuses on spatial intelligence and three-dimensional environment simulation. Upon completion of the transaction, Fei-Fei Li will serve as AMD's Executive Vice President and Chief Scientist. This move indicates that AMD aims to internalize model research capabilities as a driving force for chip design and to compete directly with Nvidia in physical AI domains such as robotics and simulation.
Dow Jones Industrial Average gives back Friday's rally on a Boeing delay
ECB rate hike expectations cool down, Lagarde: Rising long-term rates will suppress growth and inflation
Christine Lagarde, President of the European Central Bank, stated that a significant rise in long-term interest rates will slow economic growth and suppress the transmission of energy prices to overall inflation, exceeding the extent forecasted by the ECB in September. She also emphasized that in the absence of signs of second-round effects, the ECB should adopt "moderate response measures" to control inflation. As a result, the market’s expectation of an ECB rate hike in October has dropped to less than 40%.

Crypto prices
More


