

Date: Thu, Oct 23, 2025 | 08:30 AM GMT
The cryptocurrency market is showing signs of upside momentum today as both Bitcoin (BTC) and Ethereum (ETH) are up by over 1%, setting a positive tone for major altcoins — including Hyperliquid (HYPE).
The HYPE token has jumped 11% in the past 24 hours, and its chart structure suggests this rally might not be over yet. A developing harmonic pattern on the chart — often associated with potential continuation moves — indicates that HYPE could still see more upside in the short term.
 Source: Coinmarketcap
Harmonic Pattern Hints at Potential Upside
As seen on the 4-hour chart, HYPE is currently forming what appears to be a Bearish Gartley harmonic pattern. Despite its bearish name, this pattern typically includes a bullish leg before completion, suggesting a possible short-term rally before any major reversal.
The structure began at point X ($43.645), followed by a decline to point A, a rebound to B, and a correction down to C ($34.493). Since then, HYPE has recovered sharply, now trading around $38.88, showing renewed strength above the 50-hour moving average (MA) at $37.07— a key sign of short-term bullish momentum.
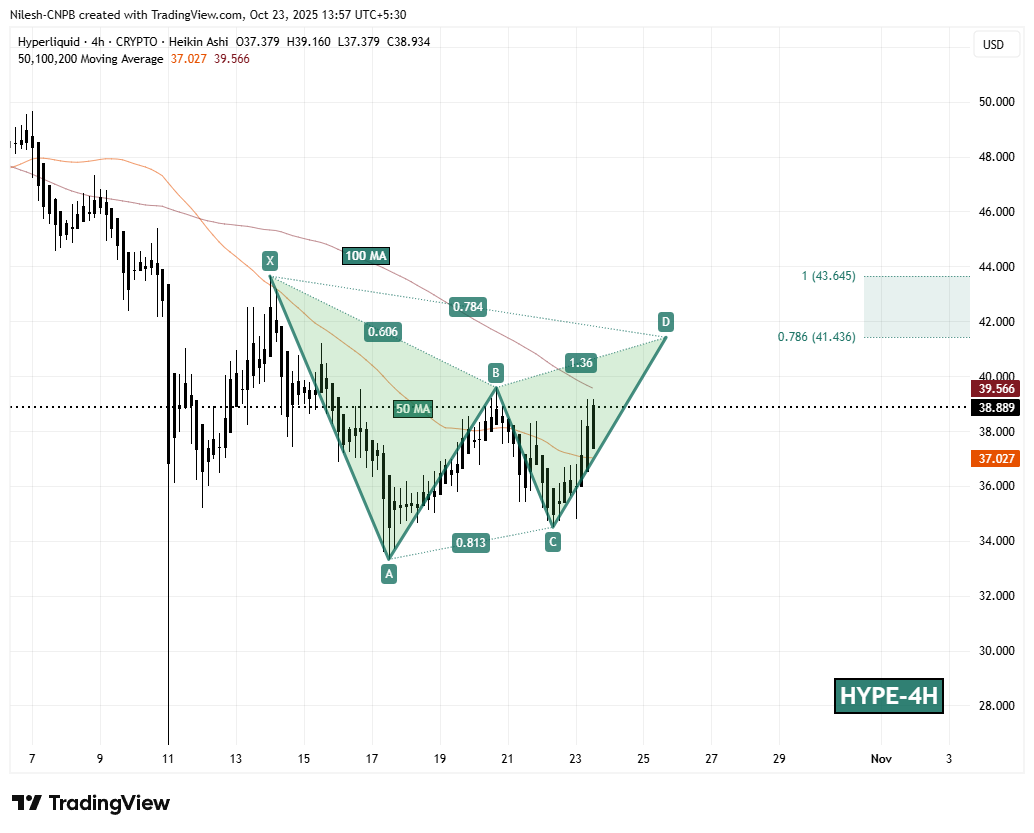 Hyperliquid (HYPE) 4H Chart/Coinsprobe (Source: Tradingview)
The next hurdle for bulls sits near the 100-hour MA around $39.56, which has acted as a resistance zone in previous attempts. A clear break above this level could confirm the continuation phase of the pattern.
What’s Next for HYPE?
If buyers manage to push HYPE above its 100-hour MA, the token could rally further toward the Potential Reversal Zone (PRZ) between $41.43 and $43.64. These Fibonacci-based targets mark the completion area of the Gartley pattern — and from current levels, that would translate to an upside of around 12–14%.
On the downside, the 50-hour MA near $37.07 now serves as crucial short-term support. Holding this zone would keep the bullish bias intact.


