Date: Tue, Oct 28, 2025 | 06:36 PM GMT
The cryptocurrency market continues to show steady momentum today despite both Bitcoin (BTC) and Ethereum (ETH) trading in the red. Interestingly, a few altcoins are holding their ground and even flashing bullish signals — one of them being Plasma (XPL).
After a sharp crash over the past 30 days, XPL is finally showing signs of rebound. The token is up more than 5% today, and more importantly, its latest technical structure is hinting at a potential bullish continuation driven by a harmonic pattern formation.
 Source: Coinmarketcap
Harmonic Pattern Hints at Potential Upside
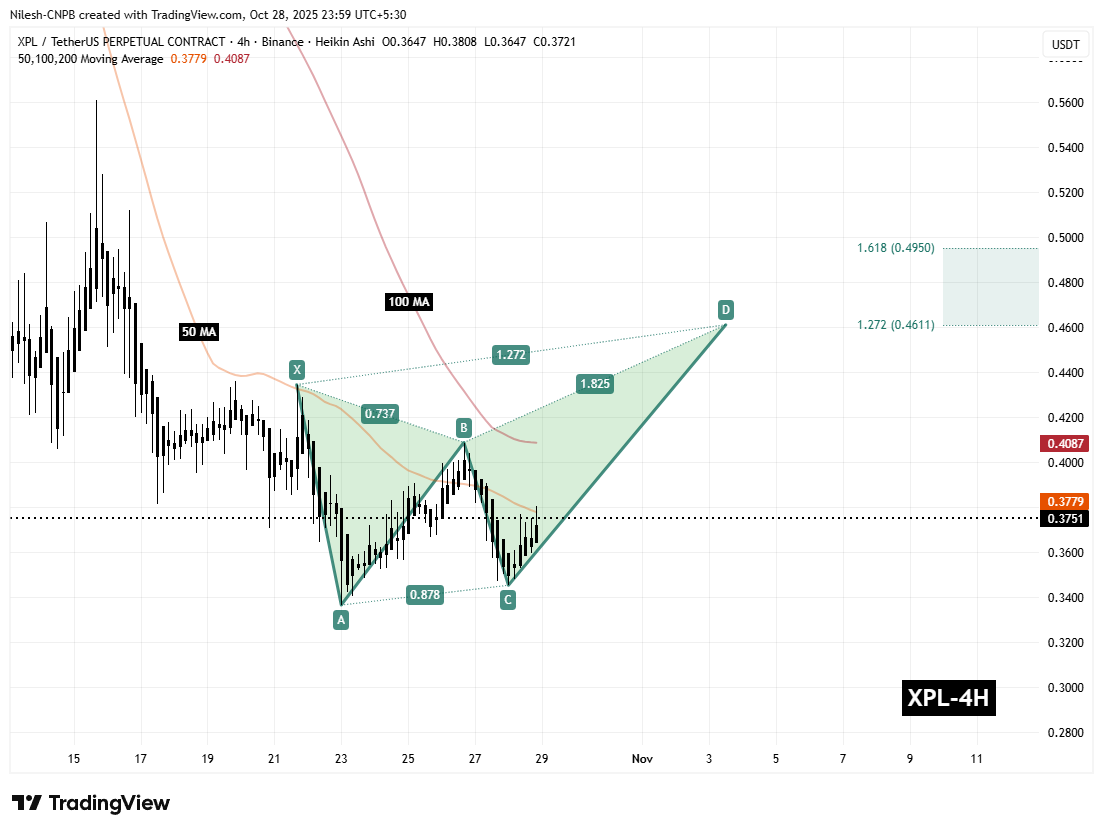
On the 4-hour chart, XPL has formed a Bearish Butterfly harmonic pattern — a setup that, despite its name, often witnesses a strong bullish move during the CD leg before price reaches the Potential Reversal Zone (PRZ).
The structure began from Point X near $0.4345, followed by a steep decline to Point A, then a rebound to Point B, and a pullback to Point C near $0.3454. This corrective wave completed the setup’s foundation, and since then, XPL has shown a steady upward move, currently trading around $0.3751.
 Plasma (XPL) 4H Chart/Coinsprobe (Source: Tradingview)
Price is now approaching the 50-hour moving average ($0.3779) — an important short-term resistance — while the 100-hour MA sits near $0.4087. A confirmed breakout above this dual moving average zone would likely validate the ongoing CD leg, signaling a possible extension toward the PRZ.
What’s Next for XPL?
If bulls manage to reclaim and sustain above these MA levels, the harmonic pattern projects an upside target zone between $0.4611 (1.272 Fibonacci extension) and $0.4950 (1.618 extension) — the PRZ region where this harmonic formation typically completes. Such a move would represent a potential 27% upside from current prices.
However, if XPL fails to hold above its 50-hour MA support, momentum could temporarily fade, leading to a short-term consolidation before any renewed attempt higher.
The critical defensive zone remains near Point C ($0.3454). Losing this level would invalidate the pattern, opening the possibility of a short-lived correction before any rebound attempt.